Free Statistics
of Irreproducible Research!
Description of Statistical Computation | |||||||||||||||||||||||||||||||||||||||||||||||||||||||||||||||||||||||||||||||||
|---|---|---|---|---|---|---|---|---|---|---|---|---|---|---|---|---|---|---|---|---|---|---|---|---|---|---|---|---|---|---|---|---|---|---|---|---|---|---|---|---|---|---|---|---|---|---|---|---|---|---|---|---|---|---|---|---|---|---|---|---|---|---|---|---|---|---|---|---|---|---|---|---|---|---|---|---|---|---|---|---|---|
| Author's title | |||||||||||||||||||||||||||||||||||||||||||||||||||||||||||||||||||||||||||||||||
| Author | *Unverified author* | ||||||||||||||||||||||||||||||||||||||||||||||||||||||||||||||||||||||||||||||||
| R Software Module | rwasp_bootstrapplot.wasp | ||||||||||||||||||||||||||||||||||||||||||||||||||||||||||||||||||||||||||||||||
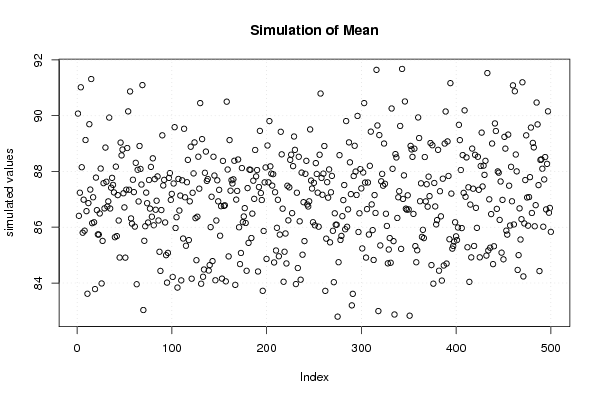
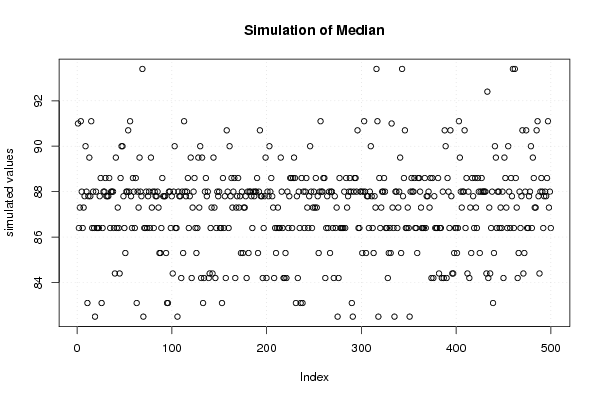
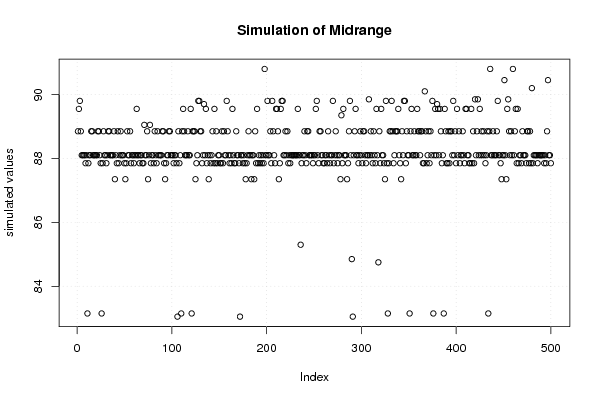
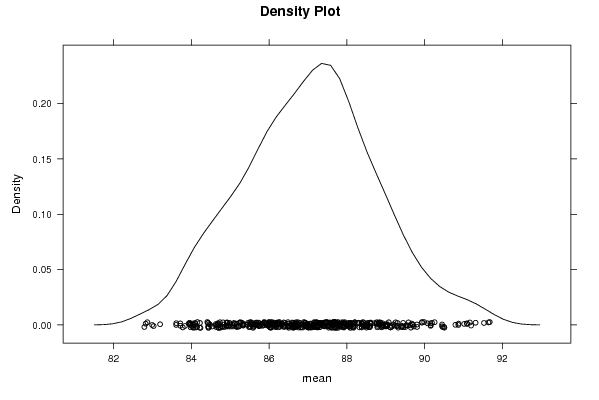
| Title produced by software | Blocked Bootstrap Plot - Central Tendency | ||||||||||||||||||||||||||||||||||||||||||||||||||||||||||||||||||||||||||||||||
| Date of computation | Fri, 26 Oct 2007 05:36:24 -0700 | ||||||||||||||||||||||||||||||||||||||||||||||||||||||||||||||||||||||||||||||||
| Cite this page as follows | Statistical Computations at FreeStatistics.org, Office for Research Development and Education, URL https://freestatistics.org/blog/index.php?v=date/2007/Oct/26/oon01kzihapools1193401859.htm/, Retrieved Sun, 28 Apr 2024 21:26:58 +0000 | ||||||||||||||||||||||||||||||||||||||||||||||||||||||||||||||||||||||||||||||||
| Statistical Computations at FreeStatistics.org, Office for Research Development and Education, URL https://freestatistics.org/blog/index.php?pk=1886, Retrieved Sun, 28 Apr 2024 21:26:58 +0000 | |||||||||||||||||||||||||||||||||||||||||||||||||||||||||||||||||||||||||||||||||
| QR Codes: | |||||||||||||||||||||||||||||||||||||||||||||||||||||||||||||||||||||||||||||||||
|
| |||||||||||||||||||||||||||||||||||||||||||||||||||||||||||||||||||||||||||||||||
| Original text written by user: | |||||||||||||||||||||||||||||||||||||||||||||||||||||||||||||||||||||||||||||||||
| IsPrivate? | No (this computation is public) | ||||||||||||||||||||||||||||||||||||||||||||||||||||||||||||||||||||||||||||||||
| User-defined keywords | blocked bootstrap | ||||||||||||||||||||||||||||||||||||||||||||||||||||||||||||||||||||||||||||||||
| Estimated Impact | 469 | ||||||||||||||||||||||||||||||||||||||||||||||||||||||||||||||||||||||||||||||||
Tree of Dependent Computations | |||||||||||||||||||||||||||||||||||||||||||||||||||||||||||||||||||||||||||||||||
| Family? (F = Feedback message, R = changed R code, M = changed R Module, P = changed Parameters, D = changed Data) | |||||||||||||||||||||||||||||||||||||||||||||||||||||||||||||||||||||||||||||||||
| F [Blocked Bootstrap Plot - Central Tendency] [workshop 3] [2007-10-26 12:36:24] [d06427f3e67cec1f6334fc93f511b0b4] [Current] F D [Blocked Bootstrap Plot - Central Tendency] [Q4: test the hypo...] [2008-10-28 20:43:37] [1e1d8320a8a1170c475bf6e4ce119de6] F R PD [Blocked Bootstrap Plot - Central Tendency] [Blocked Bootstrap...] [2008-10-29 12:56:37] [b635de6fc42b001d22cbe6e730fec936] F [Blocked Bootstrap Plot - Central Tendency] [Taak 1, Q4] [2008-10-29 16:05:43] [deb3c14ac9e4607a6d84fc9d0e0e6cc2] F [Blocked Bootstrap Plot - Central Tendency] [Q4 Blocked bootstrap] [2008-10-30 09:04:04] [fe7291e888d31b8c4db0b24d6c0f75c6] F D [Blocked Bootstrap Plot - Central Tendency] [Herberekening tas...] [2008-10-29 13:05:50] [819b576fab25b35cfda70f80599828ec] F PD [Blocked Bootstrap Plot - Central Tendency] [Q4 blocked bootstrap] [2008-10-29 14:06:15] [7173087adebe3e3a714c80ea2417b3eb] F P [Blocked Bootstrap Plot - Central Tendency] [q4] [2008-11-03 17:18:23] [e43247bc0ab243a5af99ac7f55ba0b41] F D [Blocked Bootstrap Plot - Central Tendency] [Q4 BBP] [2008-10-29 14:22:35] [8e4e5f204c24e6d05647858dae308d17] F D [Blocked Bootstrap Plot - Central Tendency] [Blocked Bootstrap...] [2008-10-29 14:54:01] [495cd80c1a9baafb03c09cd9ab8d8fb5] F R D [Blocked Bootstrap Plot - Central Tendency] [Blocked Bootstrap] [2008-10-29 16:57:59] [b518240a1c80d4f939bf8b3e34f77cec] F PD [Blocked Bootstrap Plot - Central Tendency] [Q4 1000 trekkingen] [2008-10-30 21:12:40] [aa5573c1db401b164e448aef050955a1] F D [Blocked Bootstrap Plot - Central Tendency] [Hypothesis Testin...] [2008-10-29 17:41:05] [a57f5cc542637534b8bb5bcb4d37eab1] - D [Blocked Bootstrap Plot - Central Tendency] [Paper - Bootstrap...] [2008-12-14 15:39:02] [a57f5cc542637534b8bb5bcb4d37eab1] F D [Blocked Bootstrap Plot - Central Tendency] [Q4] [2008-10-29 18:01:33] [87cabf13a90315c7085b765dcebb7412] F D [Blocked Bootstrap Plot - Central Tendency] [Q4: Bootstrap sim...] [2008-10-30 10:46:41] [12d343c4448a5f9e527bb31caeac580b] F D [Blocked Bootstrap Plot - Central Tendency] [Hypothesis Testin...] [2008-10-30 13:41:35] [063e4b67ad7d3a8a83eccec794cd5aa7] F D [Blocked Bootstrap Plot - Central Tendency] [] [2008-10-30 13:47:09] [1376d48f59a7212e8dd85a587491a69b] F D [Blocked Bootstrap Plot - Central Tendency] [taak 4 - Q4 boots...] [2008-10-30 13:47:32] [46c5a5fbda57fdfa1d4ef48658f82a0c] - [Blocked Bootstrap Plot - Central Tendency] [Task 1, Result 4] [2008-10-31 12:31:20] [70cb582895831af4be81fec73c607e93] F [Blocked Bootstrap Plot - Central Tendency] [TAAK 1 Q4] [2008-10-31 12:36:05] [29647dffafb5b58c12a48dbf6cba2b57] F R D [Blocked Bootstrap Plot - Central Tendency] [Blocked Bootstrap...] [2008-11-03 08:34:00] [b5373f20234c18c6452d5f98d8abf0fe] F D [Blocked Bootstrap Plot - Central Tendency] [Hypothesis Testin...] [2008-10-30 13:46:38] [38f43994ada0e6172896e12525dcc585] F D [Blocked Bootstrap Plot - Central Tendency] [Hypothesis Testin...] [2008-11-02 13:43:40] [d32f94eec6fe2d8c421bd223368a5ced] - D [Blocked Bootstrap Plot - Central Tendency] [Blocked Bootstrap ] [2008-10-30 13:51:28] [e1a46c1dcfccb0cb690f79a1a409b517] F D [Blocked Bootstrap Plot - Central Tendency] [Hypothesis Testin...] [2008-10-30 14:35:54] [58bf45a666dc5198906262e8815a9722] F [Blocked Bootstrap Plot - Central Tendency] [] [2008-11-03 19:14:46] [d2d412c7f4d35ffbf5ee5ee89db327d4] F D [Blocked Bootstrap Plot - Central Tendency] [Q4: Blocked boots...] [2008-10-30 15:02:36] [1ce0d16c8f4225c977b42c8fa93bc163] F [Blocked Bootstrap Plot - Central Tendency] [Q4] [2008-11-03 22:03:10] [76963dc1903f0f612b6153510a3818cf] F D [Blocked Bootstrap Plot - Central Tendency] [Q4] [2008-10-30 15:06:18] [cb714085b233acee8e8acd879ea442b6] F D [Blocked Bootstrap Plot - Central Tendency] [q4 bootstap] [2008-10-30 15:43:45] [44a98561a4b3e6ab8cd5a857b48b0914] F D [Blocked Bootstrap Plot - Central Tendency] [Q4 Bootstrap] [2008-10-30 17:32:08] [cf9c64468d04c2c4dd548cc66b4e3677] - D [Blocked Bootstrap Plot - Central Tendency] [reproduce Q4 WS 3a] [2008-10-30 17:50:52] [8545382734d98368249ce527c6558129] F PD [Blocked Bootstrap Plot - Central Tendency] [Hypothesen Q4] [2008-10-31 10:26:37] [e5d91604aae608e98a8ea24759233f66] F D [Blocked Bootstrap Plot - Central Tendency] [Hypothesis Testin...] [2008-10-31 12:03:01] [44ec60eb6065a3f81a5f756bd5af1faf] F PD [Blocked Bootstrap Plot - Central Tendency] [Opdracht 4 Q4 Boo...] [2008-10-31 12:44:33] [1848c1c05ef454c234bcbe26cf08badc] F D [Blocked Bootstrap Plot - Central Tendency] [workshop 3a] [2008-10-31 12:58:34] [28075c6928548bea087cb2be962cfe7e] - R D [Blocked Bootstrap Plot - Central Tendency] [Blocked bootstrap...] [2008-10-31 20:33:17] [e7f730ba3fad917ffc21bb9e72c10880] F D [Blocked Bootstrap Plot - Central Tendency] [Hypothesis Testin...] [2008-11-01 09:50:15] [6743688719638b0cb1c0a6e0bf433315] F [Blocked Bootstrap Plot - Central Tendency] [q4] [2008-11-03 19:59:59] [988ab43f527fc78aae41c84649095267] F [Blocked Bootstrap Plot - Central Tendency] [Hypothesis testin...] [2008-11-03 20:58:36] [3754dd41128068acfc463ebbabce5a9c] F D [Blocked Bootstrap Plot - Central Tendency] [] [2008-11-01 10:52:10] [a4ee3bef49b119f4bd2e925060c84f5e] F D [Blocked Bootstrap Plot - Central Tendency] [WS 3, Task 1,Q4] [2008-11-01 11:10:08] [fad8a251ac01c156a8ae23a83577546f] F D [Blocked Bootstrap Plot - Central Tendency] [Testing Hypothese...] [2008-11-01 12:09:27] [33f4701c7363e8b81858dafbf0350eed] F [Blocked Bootstrap Plot - Central Tendency] [T1 - Q4] [2008-11-03 18:52:56] [b187fac1a1b0cb3920f54366df47fea3] F [Blocked Bootstrap Plot - Central Tendency] [q4] [2008-11-03 22:56:26] [b641c14ac36cb6fee377f3b099dcac19] - [Blocked Bootstrap Plot - Central Tendency] [] [2008-11-09 18:51:01] [888addc516c3b812dd7be4bd54caa358] - [Blocked Bootstrap Plot - Central Tendency] [] [2008-11-09 18:51:01] [888addc516c3b812dd7be4bd54caa358] F D [Blocked Bootstrap Plot - Central Tendency] [Blocked bootstrap...] [2008-11-01 17:10:45] [74be16979710d4c4e7c6647856088456] [Truncated] | |||||||||||||||||||||||||||||||||||||||||||||||||||||||||||||||||||||||||||||||||
| Feedback Forum | |||||||||||||||||||||||||||||||||||||||||||||||||||||||||||||||||||||||||||||||||
Post a new message | |||||||||||||||||||||||||||||||||||||||||||||||||||||||||||||||||||||||||||||||||
Dataset | |||||||||||||||||||||||||||||||||||||||||||||||||||||||||||||||||||||||||||||||||
| Dataseries X: | |||||||||||||||||||||||||||||||||||||||||||||||||||||||||||||||||||||||||||||||||
109.20 88.60 94.30 98.30 86.40 80.60 104.10 108.20 93.40 71.90 94.10 94.90 96.40 91.10 84.40 86.40 88.00 75.10 109.70 103.00 82.10 68.00 96.40 94.30 90.00 88.00 76.10 82.50 81.40 66.50 97.20 94.10 80.70 70.50 87.80 89.50 99.60 84.20 75.10 92.00 80.80 73.10 99.80 90.00 83.10 72.40 78.80 87.30 91.00 80.10 73.60 86.40 74.50 71.20 92.40 81.50 85.30 69.90 84.20 90.70 100.30 | |||||||||||||||||||||||||||||||||||||||||||||||||||||||||||||||||||||||||||||||||
Tables (Output of Computation) | |||||||||||||||||||||||||||||||||||||||||||||||||||||||||||||||||||||||||||||||||
| |||||||||||||||||||||||||||||||||||||||||||||||||||||||||||||||||||||||||||||||||
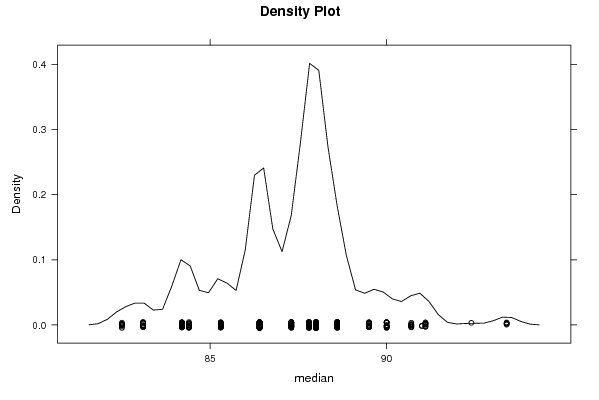
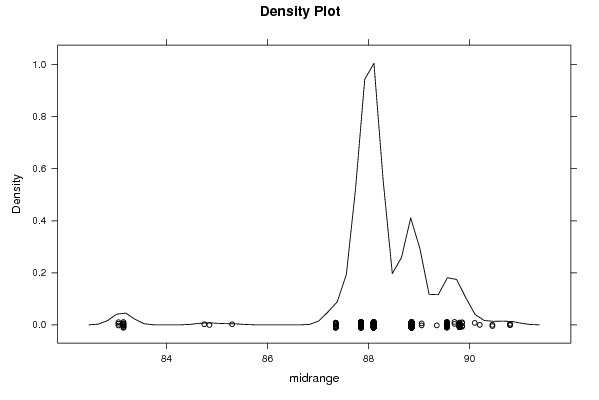
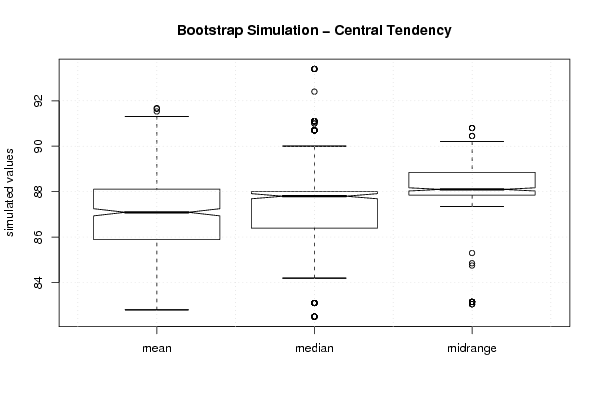
Figures (Output of Computation) | |||||||||||||||||||||||||||||||||||||||||||||||||||||||||||||||||||||||||||||||||
Input Parameters & R Code | |||||||||||||||||||||||||||||||||||||||||||||||||||||||||||||||||||||||||||||||||
| Parameters (Session): | |||||||||||||||||||||||||||||||||||||||||||||||||||||||||||||||||||||||||||||||||
| par1 = 500 ; par2 = 12 ; | |||||||||||||||||||||||||||||||||||||||||||||||||||||||||||||||||||||||||||||||||
| Parameters (R input): | |||||||||||||||||||||||||||||||||||||||||||||||||||||||||||||||||||||||||||||||||
| par1 = 500 ; par2 = 12 ; | |||||||||||||||||||||||||||||||||||||||||||||||||||||||||||||||||||||||||||||||||
| R code (references can be found in the software module): | |||||||||||||||||||||||||||||||||||||||||||||||||||||||||||||||||||||||||||||||||
par1 <- as.numeric(par1) | |||||||||||||||||||||||||||||||||||||||||||||||||||||||||||||||||||||||||||||||||