Free Statistics

of Irreproducible Research!

Author's title

Author*The author of this computation has been verified*
R Software Modulerwasp_bootstrapplot.wasp
Title produced by softwareBlocked Bootstrap Plot - Central Tendency
Date of computationSat, 01 Nov 2008 03:50:15 -0600
Cite this page as followsStatistical Computations at FreeStatistics.org, Office for Research Development and Education, URL https://freestatistics.org/blog/index.php?v=date/2008/Nov/01/t1225533071v0i58q0fb7y90hk.htm/, Retrieved Mon, 13 May 2024 22:00:30 +0000
Statistical Computations at FreeStatistics.org, Office for Research Development and Education, URL https://freestatistics.org/blog/index.php?pk=20334, Retrieved Mon, 13 May 2024 22:00:30 +0000
QR Codes:

Original text written by user:
IsPrivate?No (this computation is public)
User-defined keywords
Estimated Impact211
Family? (F = Feedback message, R = changed R code, M = changed R Module, P = changed Parameters, D = changed Data)
F     [Blocked Bootstrap Plot - Central Tendency] [workshop 3] [2007-10-26 12:36:24] [e9ffc5de6f8a7be62f22b142b5b6b1a8]
F    D    [Blocked Bootstrap Plot - Central Tendency] [Hypothesis Testin...] [2008-11-01 09:50:15] [9b05d7ef5dbcfba4217d280d9092f628] [Current]
F           [Blocked Bootstrap Plot - Central Tendency] [q4] [2008-11-03 19:59:59] [988ab43f527fc78aae41c84649095267]
F             [Blocked Bootstrap Plot - Central Tendency] [Hypothesis testin...] [2008-11-03 20:58:36] [3754dd41128068acfc463ebbabce5a9c]
Feedback Forum
2008-11-06 20:32:55 [Jan Helsen] [reply
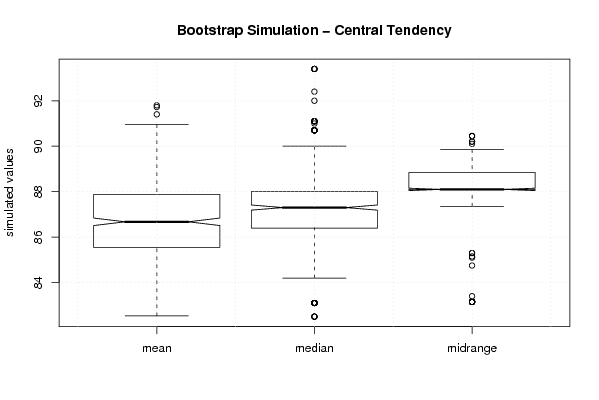
Je reproductie klopt maar je conclusie niet. Je hebt hier in feite de keuze. Ofwel kies je zoals jij voor de midrange. Voordeel is de kleine spreiding maar als je dan naar de outliers kijkt (waar je rekening moet mee houden), wijken die in grote mate af.
Kies je voor de mean dan is de spreiding wel groter maar dan zullen de outlies niet extreem afwijken van de overige gemiddeldes.
2008-11-10 21:42:57 [Ilknur Günes] [reply
Bootstrapping: gem. Dataset , 500 x opnieuw
Telkens 1 eruit nemen en een andere terugleggen ( er bestaat dan natuurlijk de kans dat je hetzelfde terug neemt)
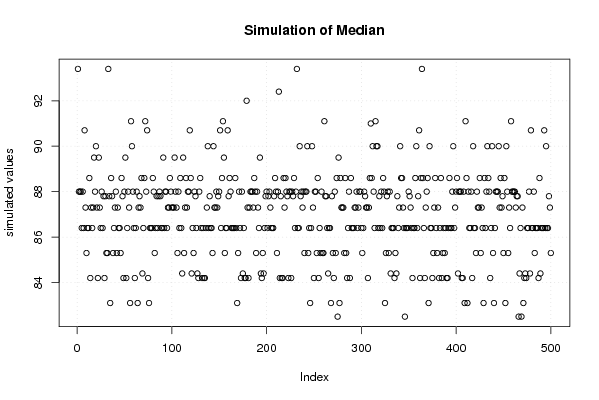
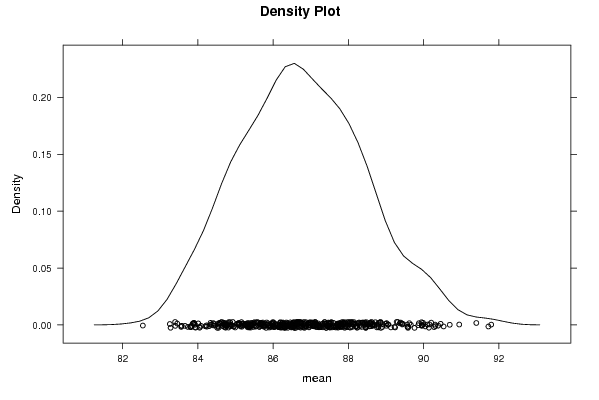
Simulation of mean: Alle punten zijn alle berekende gemiddelden, door elkaar.
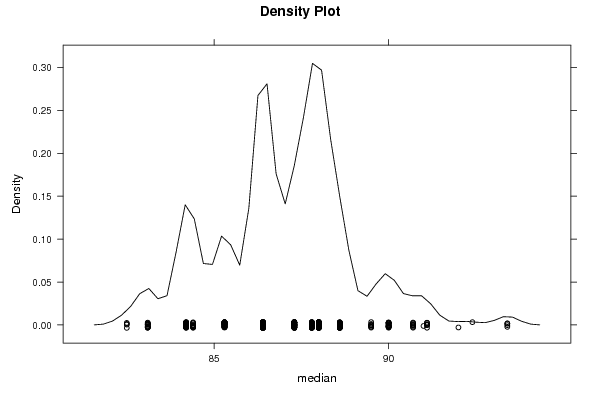
Simulation of median: meer een patron
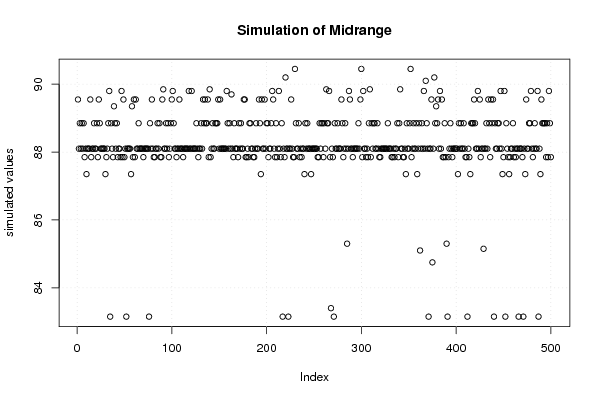
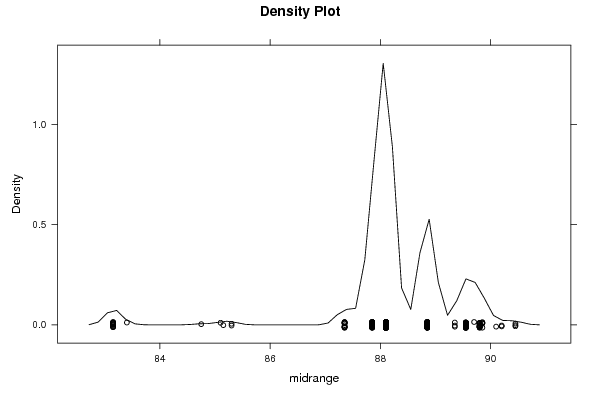
simulation of midrange: duidelijk patroon
Hoe minder variatie, hoe nauwkeuriger
Midrange als gemiddelde nemen omdat daar de variatie het kleinst is
Maar: daar zijn wel heel veel outliers!!! Je hebt een gemiddelde waarvan de getrouwheidsinterval zeer klein is, maar als je er buite zit, zit je er wel extreem buiten. Je moet maw zelf een overweging doen. Dwz dat de mean ook goed kan zijn. Het heft een groter getrouwheidsinterval, maar de outliers zijn minder extreeù.
De punten op de grafiek zij gemiddelden, dus je kan ze niet vinden in je dataset
Outliers zijn dus WEL relevant! ze bepalen de keuze, MAAR het gaat over gemiddelden
2008-12-01 19:45:07 [8e2cc0b2ef568da46d009b2f601285b2] [reply
Je conclusie/antwoord is niet helemaal correct.

De bootstrap plot herberekend 500 keer (hier) het gemiddelde met 1 (random) waarde te weinig met teruglegging. Dit levert een scatter plot op. Idem voor mediaan en midrange.

Midrange is het beste als gemiddelde want minste variatie wel veel outliers maar met een kleine spreiding. Mean heeft een grotere spreiding maar minder outliers.

Meestal gebruikt men de mean en filtert men de outliers weg indien er geen seizoenaliteit is. Bij deze reeks zijn de outliers wel relevant!

Post a new message
Dataseries X:
109.20
88.60
94.30
98.30
86.40
80.60
104.10
108.20
93.40
71.90
94.10
94.90
96.40
91.10
84.40
86.40
88.00
75.10
109.70
103.00
82.10
68.00
96.40
94.30
90.00
88.00
76.10
82.50
81.40
66.50
97.20
94.10
80.70
70.50
87.80
89.50
99.60
84.20
75.10
92.00
80.80
73.10
99.80
90.00
83.10
72.40
78.80
87.30
91.00
80.10
73.60
86.40
74.50
71.20
92.40
81.50
85.30
69.90
84.20
90.70
100.30


Summary of computational transaction
Raw Inputview raw input (R code)
Raw Outputview raw output of R engine
Computing time5 seconds
R Server'Sir Ronald Aylmer Fisher' @ 193.190.124.24

\begin{tabular}{lllllllll}
\hline
Summary of computational transaction \tabularnewline
Raw Input & view raw input (R code)  \tabularnewline
Raw Output & view raw output of R engine  \tabularnewline
Computing time & 5 seconds \tabularnewline
R Server & 'Sir Ronald Aylmer Fisher' @ 193.190.124.24 \tabularnewline
\hline
\end{tabular}
%Source: https://freestatistics.org/blog/index.php?pk=20334&T=0

[TABLE]
[ROW][C]Summary of computational transaction[/C][/ROW]
[ROW][C]Raw Input[/C][C]view raw input (R code) [/C][/ROW]
[ROW][C]Raw Output[/C][C]view raw output of R engine [/C][/ROW]
[ROW][C]Computing time[/C][C]5 seconds[/C][/ROW]
[ROW][C]R Server[/C][C]'Sir Ronald Aylmer Fisher' @ 193.190.124.24[/C][/ROW]
[/TABLE]
Source: https://freestatistics.org/blog/index.php?pk=20334&T=0

Globally Unique Identifier (entire table): ba.freestatistics.org/blog/index.php?pk=20334&T=0

As an alternative you can also use a QR Code:  

The GUIDs for individual cells are displayed in the table below:

Summary of computational transaction
Raw Inputview raw input (R code)
Raw Outputview raw output of R engine
Computing time5 seconds
R Server'Sir Ronald Aylmer Fisher' @ 193.190.124.24


Estimation Results of Blocked Bootstrap
statisticQ1EstimateQ3S.D.IQR
mean85.545081967213186.893442622950887.8751.658218224805072.32991803278688
median86.487.3881.921253390154031.59999999999999
midrange88.188.188.851.141287792649730.75

\begin{tabular}{lllllllll}
\hline
Estimation Results of Blocked Bootstrap \tabularnewline
statistic & Q1 & Estimate & Q3 & S.D. & IQR \tabularnewline
mean & 85.5450819672131 & 86.8934426229508 & 87.875 & 1.65821822480507 & 2.32991803278688 \tabularnewline
median & 86.4 & 87.3 & 88 & 1.92125339015403 & 1.59999999999999 \tabularnewline
midrange & 88.1 & 88.1 & 88.85 & 1.14128779264973 & 0.75 \tabularnewline
\hline
\end{tabular}
%Source: https://freestatistics.org/blog/index.php?pk=20334&T=1

[TABLE]
[ROW][C]Estimation Results of Blocked Bootstrap[/C][/ROW]
[ROW][C]statistic[/C][C]Q1[/C][C]Estimate[/C][C]Q3[/C][C]S.D.[/C][C]IQR[/C][/ROW]
[ROW][C]mean[/C][C]85.5450819672131[/C][C]86.8934426229508[/C][C]87.875[/C][C]1.65821822480507[/C][C]2.32991803278688[/C][/ROW]
[ROW][C]median[/C][C]86.4[/C][C]87.3[/C][C]88[/C][C]1.92125339015403[/C][C]1.59999999999999[/C][/ROW]
[ROW][C]midrange[/C][C]88.1[/C][C]88.1[/C][C]88.85[/C][C]1.14128779264973[/C][C]0.75[/C][/ROW]
[/TABLE]
Source: https://freestatistics.org/blog/index.php?pk=20334&T=1

Globally Unique Identifier (entire table): ba.freestatistics.org/blog/index.php?pk=20334&T=1

As an alternative you can also use a QR Code:  

The GUIDs for individual cells are displayed in the table below:

Estimation Results of Blocked Bootstrap
statisticQ1EstimateQ3S.D.IQR
mean85.545081967213186.893442622950887.8751.658218224805072.32991803278688
median86.487.3881.921253390154031.59999999999999
midrange88.188.188.851.141287792649730.75


Parameters (Session):
par1 = 500 ; par2 = 12 ;
Parameters (R input):
par1 = 500 ; par2 = 12 ; par3 = ; par4 = ; par5 = ; par6 = ; par7 = ; par8 = ; par9 = ; par10 = ; par11 = ; par12 = ; par13 = ; par14 = ; par15 = ; par16 = ; par17 = ; par18 = ; par19 = ; par20 = ;
R code (references can be found in the software module):
par1 <- as.numeric(par1)
par2 <- as.numeric(par2)
if (par1 < 10) par1 = 10
if (par1 > 5000) par1 = 5000
if (par2 < 3) par2 = 3
if (par2 > length(x)) par2 = length(x)
library(lattice)
library(boot)
boot.stat <- function(s)
{
s.mean <- mean(s)
s.median <- median(s)
s.midrange <- (max(s) + min(s)) / 2
c(s.mean, s.median, s.midrange)
}
(r <- tsboot(x, boot.stat, R=par1, l=12, sim='fixed'))
bitmap(file='plot1.png')
plot(r$t[,1],type='p',ylab='simulated values',main='Simulation of Mean')
grid()
dev.off()
bitmap(file='plot2.png')
plot(r$t[,2],type='p',ylab='simulated values',main='Simulation of Median')
grid()
dev.off()
bitmap(file='plot3.png')
plot(r$t[,3],type='p',ylab='simulated values',main='Simulation of Midrange')
grid()
dev.off()
bitmap(file='plot4.png')
densityplot(~r$t[,1],col='black',main='Density Plot',xlab='mean')
dev.off()
bitmap(file='plot5.png')
densityplot(~r$t[,2],col='black',main='Density Plot',xlab='median')
dev.off()
bitmap(file='plot6.png')
densityplot(~r$t[,3],col='black',main='Density Plot',xlab='midrange')
dev.off()
z <- data.frame(cbind(r$t[,1],r$t[,2],r$t[,3]))
colnames(z) <- list('mean','median','midrange')
bitmap(file='plot7.png')
boxplot(z,notch=TRUE,ylab='simulated values',main='Bootstrap Simulation - Central Tendency')
grid()
dev.off()
load(file='createtable')
a<-table.start()
a<-table.row.start(a)
a<-table.element(a,'Estimation Results of Blocked Bootstrap',6,TRUE)
a<-table.row.end(a)
a<-table.row.start(a)
a<-table.element(a,'statistic',header=TRUE)
a<-table.element(a,'Q1',header=TRUE)
a<-table.element(a,'Estimate',header=TRUE)
a<-table.element(a,'Q3',header=TRUE)
a<-table.element(a,'S.D.',header=TRUE)
a<-table.element(a,'IQR',header=TRUE)
a<-table.row.end(a)
a<-table.row.start(a)
a<-table.element(a,'mean',header=TRUE)
q1 <- quantile(r$t[,1],0.25)[[1]]
q3 <- quantile(r$t[,1],0.75)[[1]]
a<-table.element(a,q1)
a<-table.element(a,r$t0[1])
a<-table.element(a,q3)
a<-table.element(a,sqrt(var(r$t[,1])))
a<-table.element(a,q3-q1)
a<-table.row.end(a)
a<-table.row.start(a)
a<-table.element(a,'median',header=TRUE)
q1 <- quantile(r$t[,2],0.25)[[1]]
q3 <- quantile(r$t[,2],0.75)[[1]]
a<-table.element(a,q1)
a<-table.element(a,r$t0[2])
a<-table.element(a,q3)
a<-table.element(a,sqrt(var(r$t[,2])))
a<-table.element(a,q3-q1)
a<-table.row.end(a)
a<-table.row.start(a)
a<-table.element(a,'midrange',header=TRUE)
q1 <- quantile(r$t[,3],0.25)[[1]]
q3 <- quantile(r$t[,3],0.75)[[1]]
a<-table.element(a,q1)
a<-table.element(a,r$t0[3])
a<-table.element(a,q3)
a<-table.element(a,sqrt(var(r$t[,3])))
a<-table.element(a,q3-q1)
a<-table.row.end(a)
a<-table.end(a)
table.save(a,file='mytable.tab')