Free Statistics

of Irreproducible Research!

Author's title

Author*The author of this computation has been verified*
R Software Modulerwasp_bootstrapplot.wasp
Title produced by softwareBlocked Bootstrap Plot - Central Tendency
Date of computationSun, 02 Nov 2008 06:43:40 -0700
Cite this page as followsStatistical Computations at FreeStatistics.org, Office for Research Development and Education, URL https://freestatistics.org/blog/index.php?v=date/2008/Nov/02/t1225633466jmaswwvgh6g36zb.htm/, Retrieved Tue, 14 May 2024 14:21:58 +0000
Statistical Computations at FreeStatistics.org, Office for Research Development and Education, URL https://freestatistics.org/blog/index.php?pk=20558, Retrieved Tue, 14 May 2024 14:21:58 +0000
QR Codes:

Original text written by user:
IsPrivate?No (this computation is public)
User-defined keywords
Estimated Impact180
Family? (F = Feedback message, R = changed R code, M = changed R Module, P = changed Parameters, D = changed Data)
F     [Blocked Bootstrap Plot - Central Tendency] [workshop 3] [2007-10-26 12:36:24] [e9ffc5de6f8a7be62f22b142b5b6b1a8]
F    D  [Blocked Bootstrap Plot - Central Tendency] [Hypothesis Testin...] [2008-10-30 13:46:38] [38f43994ada0e6172896e12525dcc585]
F    D      [Blocked Bootstrap Plot - Central Tendency] [Hypothesis Testin...] [2008-11-02 13:43:40] [382e90e66f02be5ed86892bdc1574692] [Current]
Feedback Forum
2008-11-10 09:44:12 [Steffi Van Isveldt] [reply
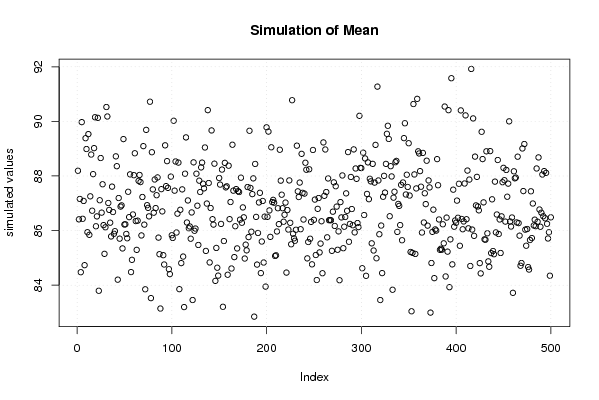
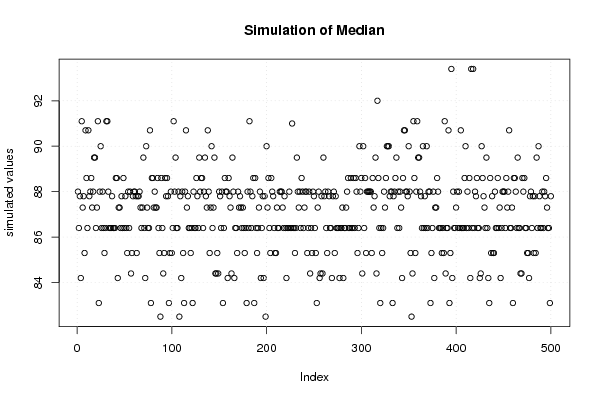
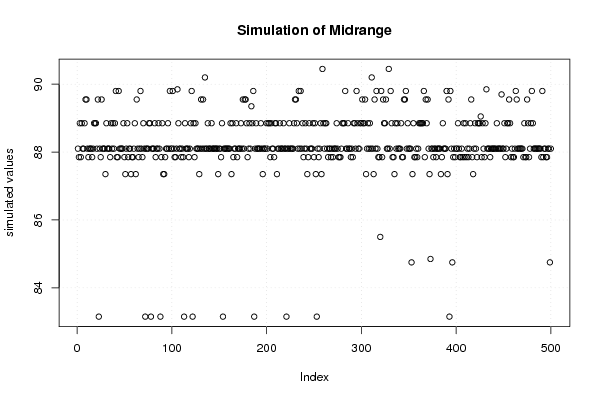
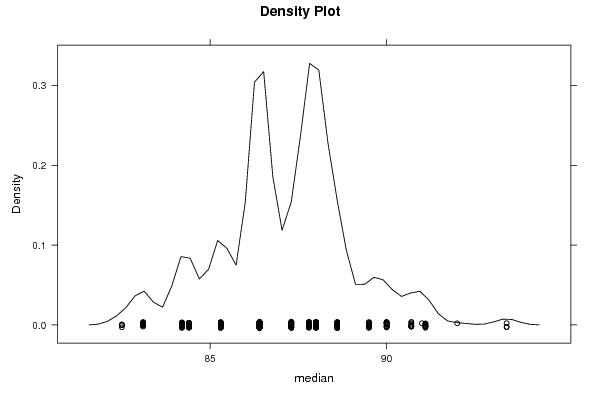
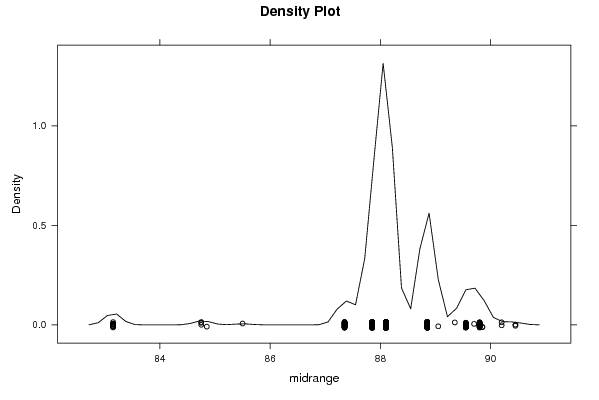
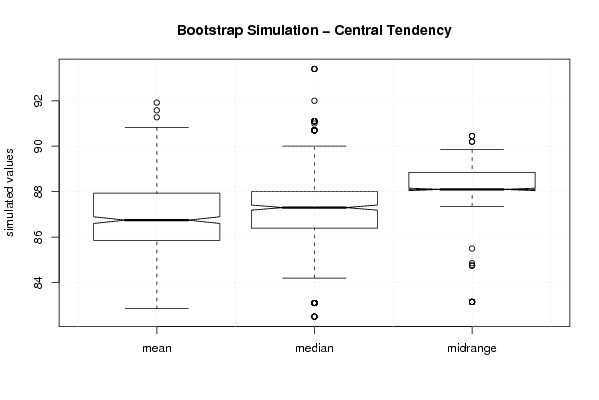
Hier gaan we ons vooral concentreren op de midrange. Dit geeft ons het beste beeld over de totale productie van kledij, dit omdat deze de kleinste spreiding vertoont van de 3 opgegeven tendensen. Er zijn wel enkele outliers waar te nemen, maar deze hebben weinig invloed op het resultaat.
Goede berekening en conclusie!
2008-11-10 14:43:30 [Michael Van Spaandonck] [reply
De midrange kent inderdaad de minste variatie en puur theoretisch gezien is dit dus de beste estimator, zoals correct gesteld door de studente.

Ik zou echter wel volgende nuancering willen toeovegen: outliers zijn niet onbelangrijk en de midrange kent er nogal wat. In sommige gevallen, zoals aangehaald door de oude student in het voorbeelddocument, kan een outlier kwalijke gevolgen hebben en in dat geval zou je misschien beter voor het gemiddelde kunnen gaan, aangezien die weinig outliers kent.
Welke estimator je best gebruikt hangt af van de situatie en hoe je verschillende pro's en contra's tegen elkaar afweegt.
2008-11-11 09:50:10 [Tim Damen] [reply
over het algemeen bezien heeft de midrange de 'smallest variability', de ouliers hebben hier niets mee te maken
2008-11-11 17:56:30 [Evelien Blockx] [reply
De mid-range heeft inderdaad de beste spreiding, dus de beste benadering van de geschatte waarde, als we de outliers buiten beschouwing laten. Maar de outliers zijn hier wel degelijk relevant, dus het zou volgens mij fout zijn om ze buiten beschouwing te laten.

Post a new message
Dataseries X:
109.20
88.60
94.30
98.30
86.40
80.60
104.10
108.20
93.40
71.90
94.10
94.90
96.40
91.10
84.40
86.40
88.00
75.10
109.70
103.00
82.10
68.00
96.40
94.30
90.00
88.00
76.10
82.50
81.40
66.50
97.20
94.10
80.70
70.50
87.80
89.50
99.60
84.20
75.10
92.00
80.80
73.10
99.80
90.00
83.10
72.40
78.80
87.30
91.00
80.10
73.60
86.40
74.50
71.20
92.40
81.50
85.30
69.90
84.20
90.70
100.30


Summary of computational transaction
Raw Inputview raw input (R code)
Raw Outputview raw output of R engine
Computing time4 seconds
R Server'George Udny Yule' @ 72.249.76.132

\begin{tabular}{lllllllll}
\hline
Summary of computational transaction \tabularnewline
Raw Input & view raw input (R code)  \tabularnewline
Raw Output & view raw output of R engine  \tabularnewline
Computing time & 4 seconds \tabularnewline
R Server & 'George Udny Yule' @ 72.249.76.132 \tabularnewline
\hline
\end{tabular}
%Source: https://freestatistics.org/blog/index.php?pk=20558&T=0

[TABLE]
[ROW][C]Summary of computational transaction[/C][/ROW]
[ROW][C]Raw Input[/C][C]view raw input (R code) [/C][/ROW]
[ROW][C]Raw Output[/C][C]view raw output of R engine [/C][/ROW]
[ROW][C]Computing time[/C][C]4 seconds[/C][/ROW]
[ROW][C]R Server[/C][C]'George Udny Yule' @ 72.249.76.132[/C][/ROW]
[/TABLE]
Source: https://freestatistics.org/blog/index.php?pk=20558&T=0

Globally Unique Identifier (entire table): ba.freestatistics.org/blog/index.php?pk=20558&T=0

As an alternative you can also use a QR Code:  

The GUIDs for individual cells are displayed in the table below:

Summary of computational transaction
Raw Inputview raw input (R code)
Raw Outputview raw output of R engine
Computing time4 seconds
R Server'George Udny Yule' @ 72.249.76.132


Estimation Results of Blocked Bootstrap
statisticQ1EstimateQ3S.D.IQR
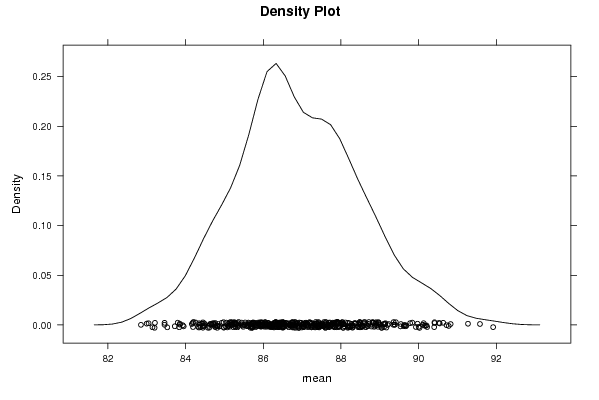
mean85.861885245901686.893442622950887.92909836065571.608655304935062.06721311475411
median86.487.3881.837524899290081.59999999999999
midrange88.188.188.851.036179683584540.75

\begin{tabular}{lllllllll}
\hline
Estimation Results of Blocked Bootstrap \tabularnewline
statistic & Q1 & Estimate & Q3 & S.D. & IQR \tabularnewline
mean & 85.8618852459016 & 86.8934426229508 & 87.9290983606557 & 1.60865530493506 & 2.06721311475411 \tabularnewline
median & 86.4 & 87.3 & 88 & 1.83752489929008 & 1.59999999999999 \tabularnewline
midrange & 88.1 & 88.1 & 88.85 & 1.03617968358454 & 0.75 \tabularnewline
\hline
\end{tabular}
%Source: https://freestatistics.org/blog/index.php?pk=20558&T=1

[TABLE]
[ROW][C]Estimation Results of Blocked Bootstrap[/C][/ROW]
[ROW][C]statistic[/C][C]Q1[/C][C]Estimate[/C][C]Q3[/C][C]S.D.[/C][C]IQR[/C][/ROW]
[ROW][C]mean[/C][C]85.8618852459016[/C][C]86.8934426229508[/C][C]87.9290983606557[/C][C]1.60865530493506[/C][C]2.06721311475411[/C][/ROW]
[ROW][C]median[/C][C]86.4[/C][C]87.3[/C][C]88[/C][C]1.83752489929008[/C][C]1.59999999999999[/C][/ROW]
[ROW][C]midrange[/C][C]88.1[/C][C]88.1[/C][C]88.85[/C][C]1.03617968358454[/C][C]0.75[/C][/ROW]
[/TABLE]
Source: https://freestatistics.org/blog/index.php?pk=20558&T=1

Globally Unique Identifier (entire table): ba.freestatistics.org/blog/index.php?pk=20558&T=1

As an alternative you can also use a QR Code:  

The GUIDs for individual cells are displayed in the table below:

Estimation Results of Blocked Bootstrap
statisticQ1EstimateQ3S.D.IQR
mean85.861885245901686.893442622950887.92909836065571.608655304935062.06721311475411
median86.487.3881.837524899290081.59999999999999
midrange88.188.188.851.036179683584540.75


Parameters (Session):
par1 = 500 ; par2 = 12 ;
Parameters (R input):
par1 = 500 ; par2 = 12 ;
R code (references can be found in the software module):
par1 <- as.numeric(par1)
par2 <- as.numeric(par2)
if (par1 < 10) par1 = 10
if (par1 > 5000) par1 = 5000
if (par2 < 3) par2 = 3
if (par2 > length(x)) par2 = length(x)
library(lattice)
library(boot)
boot.stat <- function(s)
{
s.mean <- mean(s)
s.median <- median(s)
s.midrange <- (max(s) + min(s)) / 2
c(s.mean, s.median, s.midrange)
}
(r <- tsboot(x, boot.stat, R=par1, l=12, sim='fixed'))
bitmap(file='plot1.png')
plot(r$t[,1],type='p',ylab='simulated values',main='Simulation of Mean')
grid()
dev.off()
bitmap(file='plot2.png')
plot(r$t[,2],type='p',ylab='simulated values',main='Simulation of Median')
grid()
dev.off()
bitmap(file='plot3.png')
plot(r$t[,3],type='p',ylab='simulated values',main='Simulation of Midrange')
grid()
dev.off()
bitmap(file='plot4.png')
densityplot(~r$t[,1],col='black',main='Density Plot',xlab='mean')
dev.off()
bitmap(file='plot5.png')
densityplot(~r$t[,2],col='black',main='Density Plot',xlab='median')
dev.off()
bitmap(file='plot6.png')
densityplot(~r$t[,3],col='black',main='Density Plot',xlab='midrange')
dev.off()
z <- data.frame(cbind(r$t[,1],r$t[,2],r$t[,3]))
colnames(z) <- list('mean','median','midrange')
bitmap(file='plot7.png')
boxplot(z,notch=TRUE,ylab='simulated values',main='Bootstrap Simulation - Central Tendency')
grid()
dev.off()
load(file='createtable')
a<-table.start()
a<-table.row.start(a)
a<-table.element(a,'Estimation Results of Blocked Bootstrap',6,TRUE)
a<-table.row.end(a)
a<-table.row.start(a)
a<-table.element(a,'statistic',header=TRUE)
a<-table.element(a,'Q1',header=TRUE)
a<-table.element(a,'Estimate',header=TRUE)
a<-table.element(a,'Q3',header=TRUE)
a<-table.element(a,'S.D.',header=TRUE)
a<-table.element(a,'IQR',header=TRUE)
a<-table.row.end(a)
a<-table.row.start(a)
a<-table.element(a,'mean',header=TRUE)
q1 <- quantile(r$t[,1],0.25)[[1]]
q3 <- quantile(r$t[,1],0.75)[[1]]
a<-table.element(a,q1)
a<-table.element(a,r$t0[1])
a<-table.element(a,q3)
a<-table.element(a,sqrt(var(r$t[,1])))
a<-table.element(a,q3-q1)
a<-table.row.end(a)
a<-table.row.start(a)
a<-table.element(a,'median',header=TRUE)
q1 <- quantile(r$t[,2],0.25)[[1]]
q3 <- quantile(r$t[,2],0.75)[[1]]
a<-table.element(a,q1)
a<-table.element(a,r$t0[2])
a<-table.element(a,q3)
a<-table.element(a,sqrt(var(r$t[,2])))
a<-table.element(a,q3-q1)
a<-table.row.end(a)
a<-table.row.start(a)
a<-table.element(a,'midrange',header=TRUE)
q1 <- quantile(r$t[,3],0.25)[[1]]
q3 <- quantile(r$t[,3],0.75)[[1]]
a<-table.element(a,q1)
a<-table.element(a,r$t0[3])
a<-table.element(a,q3)
a<-table.element(a,sqrt(var(r$t[,3])))
a<-table.element(a,q3-q1)
a<-table.row.end(a)
a<-table.end(a)
table.save(a,file='mytable.tab')