Free Statistics

of Irreproducible Research!

Author's title

Author*The author of this computation has been verified*
R Software Modulerwasp_bootstrapplot.wasp
Title produced by softwareBlocked Bootstrap Plot - Central Tendency
Date of computationWed, 29 Oct 2008 06:56:37 -0600
Cite this page as followsStatistical Computations at FreeStatistics.org, Office for Research Development and Education, URL https://freestatistics.org/blog/index.php?v=date/2008/Oct/29/t12252854677hwxp6042nuw94q.htm/, Retrieved Tue, 14 May 2024 11:50:45 +0000
Statistical Computations at FreeStatistics.org, Office for Research Development and Education, URL https://freestatistics.org/blog/index.php?pk=19833, Retrieved Tue, 14 May 2024 11:50:45 +0000
QR Codes:

Original text written by user:
IsPrivate?No (this computation is public)
User-defined keywordsBlocked Bootstrap productie kleding
Estimated Impact210
Family? (F = Feedback message, R = changed R code, M = changed R Module, P = changed Parameters, D = changed Data)
F     [Blocked Bootstrap Plot - Central Tendency] [workshop 3] [2007-10-26 12:36:24] [e9ffc5de6f8a7be62f22b142b5b6b1a8]
F R PD    [Blocked Bootstrap Plot - Central Tendency] [Blocked Bootstrap...] [2008-10-29 12:56:37] [f4b2017b314c03698059f43b95818e67] [Current]
F           [Blocked Bootstrap Plot - Central Tendency] [Taak 1, Q4] [2008-10-29 16:05:43] [deb3c14ac9e4607a6d84fc9d0e0e6cc2]
F           [Blocked Bootstrap Plot - Central Tendency] [Q4 Blocked bootstrap] [2008-10-30 09:04:04] [fe7291e888d31b8c4db0b24d6c0f75c6]
Feedback Forum
2008-11-10 19:39:44 [Nick Wuyts] [reply
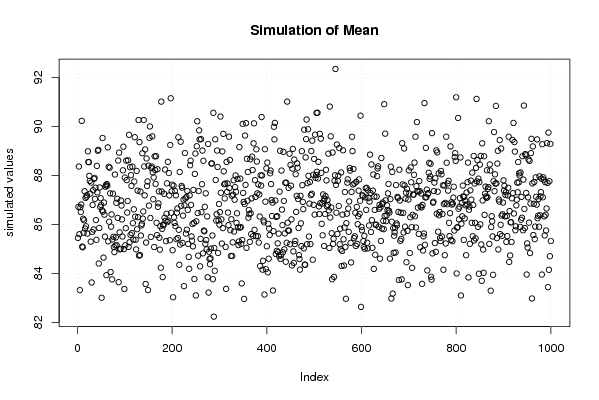
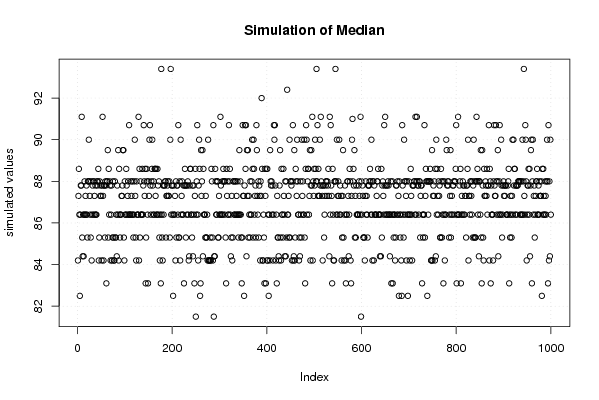
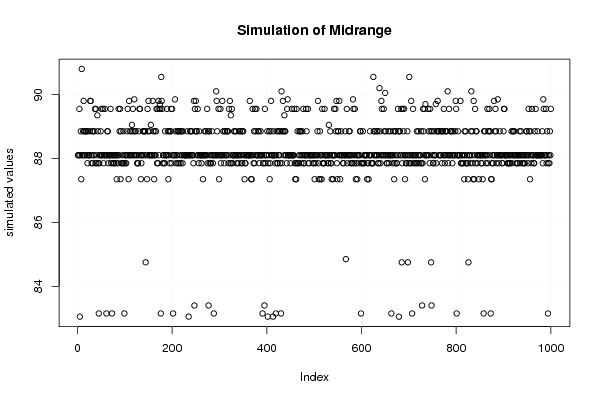
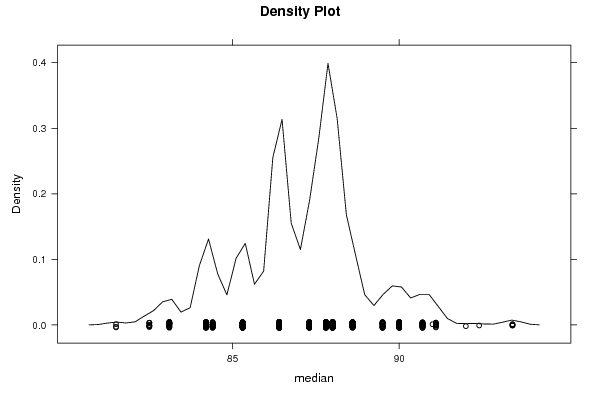
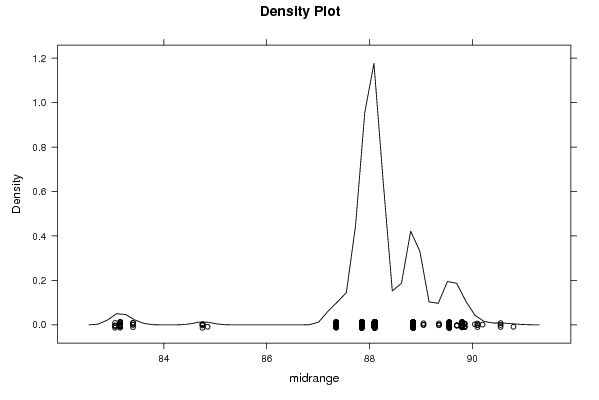
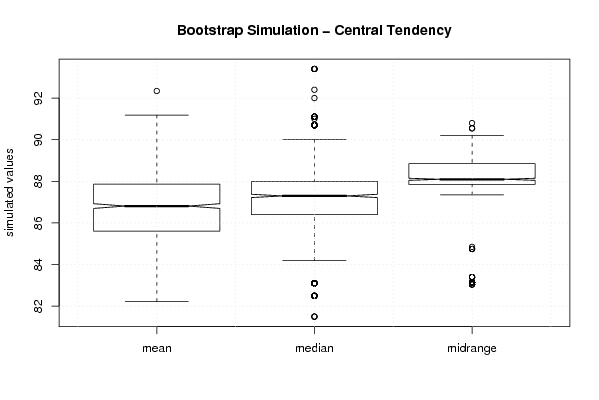
De student heeft het aantal trekkingen verhoogd van 500 naar 1000. Dwz dat de computer 500 keer een gemiddelde gaat berekenen, en random 1 gegeven uit de dataset gaat nemen om het gemiddelde ervan te berekenen (en een bolletje zetten) om vervolgens datzelfde gegeven terug in de dataset te leggen (je kan dus hetzelfde gemiddelde een paar keer terug zien komen, bolletjes die opeen liggen). De vermeerdering geeft hetzelfde resultaat als bij de 500 trekkingen, namelijk dat de midrange het kleinste aantal varianties heeft, maar ook veel outliers.

Conclusie: we nemen de midrange als gemiddelde, de spreiding is daar het kleinst (over het algemeen wordt de mean genomen, hier dus niet).
2008-11-10 20:35:15 [Nick Wuyts] [reply
In het geval van de student gaat de computer 1000 keer een gemiddelde berekenen. Dit is niet verkeerd sinds de uitkomst juister zal zijn, maar dit was niet echt nodig.

Post a new message
Dataseries X:
109.20
88.60
94.30
98.30
86.40
80.60
104.10
108.20
93.40
71.90
94.10
94.90
96.40
91.10
84.40
86.40
88.00
75.10
109.70
103.00
82.10
68.00
96.40
94.30
90.00
88.00
76.10
82.50
81.40
66.50
97.20
94.10
80.70
70.50
87.80
89.50
99.60
84.20
75.10
92.00
80.80
73.10
99.80
90.00
83.10
72.40
78.80
87.30
91.00
80.10
73.60
86.40
74.50
71.20
92.40
81.50
85.30
69.90
84.20
90.70
100.30


Summary of computational transaction
Raw Inputview raw input (R code)
Raw Outputview raw output of R engine
Computing time6 seconds
R Server'Gwilym Jenkins' @ 72.249.127.135

\begin{tabular}{lllllllll}
\hline
Summary of computational transaction \tabularnewline
Raw Input & view raw input (R code)  \tabularnewline
Raw Output & view raw output of R engine  \tabularnewline
Computing time & 6 seconds \tabularnewline
R Server & 'Gwilym Jenkins' @ 72.249.127.135 \tabularnewline
\hline
\end{tabular}
%Source: https://freestatistics.org/blog/index.php?pk=19833&T=0

[TABLE]
[ROW][C]Summary of computational transaction[/C][/ROW]
[ROW][C]Raw Input[/C][C]view raw input (R code) [/C][/ROW]
[ROW][C]Raw Output[/C][C]view raw output of R engine [/C][/ROW]
[ROW][C]Computing time[/C][C]6 seconds[/C][/ROW]
[ROW][C]R Server[/C][C]'Gwilym Jenkins' @ 72.249.127.135[/C][/ROW]
[/TABLE]
Source: https://freestatistics.org/blog/index.php?pk=19833&T=0

Globally Unique Identifier (entire table): ba.freestatistics.org/blog/index.php?pk=19833&T=0

As an alternative you can also use a QR Code:  

The GUIDs for individual cells are displayed in the table below:

Summary of computational transaction
Raw Inputview raw input (R code)
Raw Outputview raw output of R engine
Computing time6 seconds
R Server'Gwilym Jenkins' @ 72.249.127.135


Estimation Results of Blocked Bootstrap
statisticQ1EstimateQ3S.D.IQR
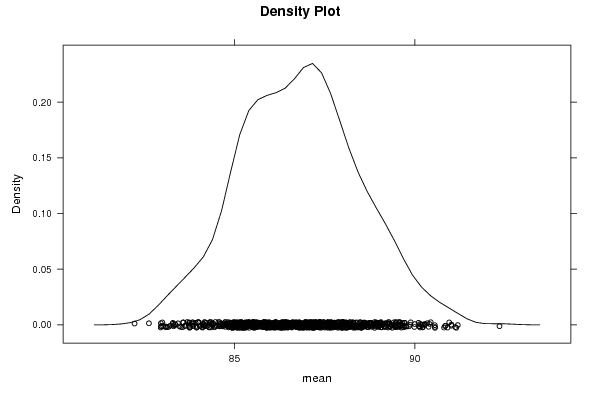
mean85.604508196721386.893442622950887.86721311475411.645541882395832.26270491803278
median86.487.3881.873319095732071.59999999999999
midrange87.8588.188.851.077850750215331

\begin{tabular}{lllllllll}
\hline
Estimation Results of Blocked Bootstrap \tabularnewline
statistic & Q1 & Estimate & Q3 & S.D. & IQR \tabularnewline
mean & 85.6045081967213 & 86.8934426229508 & 87.8672131147541 & 1.64554188239583 & 2.26270491803278 \tabularnewline
median & 86.4 & 87.3 & 88 & 1.87331909573207 & 1.59999999999999 \tabularnewline
midrange & 87.85 & 88.1 & 88.85 & 1.07785075021533 & 1 \tabularnewline
\hline
\end{tabular}
%Source: https://freestatistics.org/blog/index.php?pk=19833&T=1

[TABLE]
[ROW][C]Estimation Results of Blocked Bootstrap[/C][/ROW]
[ROW][C]statistic[/C][C]Q1[/C][C]Estimate[/C][C]Q3[/C][C]S.D.[/C][C]IQR[/C][/ROW]
[ROW][C]mean[/C][C]85.6045081967213[/C][C]86.8934426229508[/C][C]87.8672131147541[/C][C]1.64554188239583[/C][C]2.26270491803278[/C][/ROW]
[ROW][C]median[/C][C]86.4[/C][C]87.3[/C][C]88[/C][C]1.87331909573207[/C][C]1.59999999999999[/C][/ROW]
[ROW][C]midrange[/C][C]87.85[/C][C]88.1[/C][C]88.85[/C][C]1.07785075021533[/C][C]1[/C][/ROW]
[/TABLE]
Source: https://freestatistics.org/blog/index.php?pk=19833&T=1

Globally Unique Identifier (entire table): ba.freestatistics.org/blog/index.php?pk=19833&T=1

As an alternative you can also use a QR Code:  

The GUIDs for individual cells are displayed in the table below:

Estimation Results of Blocked Bootstrap
statisticQ1EstimateQ3S.D.IQR
mean85.604508196721386.893442622950887.86721311475411.645541882395832.26270491803278
median86.487.3881.873319095732071.59999999999999
midrange87.8588.188.851.077850750215331


Parameters (Session):
par1 = 1000 ; par2 = 60 ;
Parameters (R input):
par1 = 1000 ; par2 = 60 ;
R code (references can be found in the software module):
par1 <- as.numeric(par1)
par2 <- as.numeric(par2)
if (par1 < 10) par1 = 10
if (par1 > 5000) par1 = 5000
if (par2 < 3) par2 = 3
if (par2 > length(x)) par2 = length(x)
library(lattice)
library(boot)
boot.stat <- function(s)
{
s.mean <- mean(s)
s.median <- median(s)
s.midrange <- (max(s) + min(s)) / 2
c(s.mean, s.median, s.midrange)
}
(r <- tsboot(x, boot.stat, R=par1, l=12, sim='fixed'))
bitmap(file='plot1.png')
plot(r$t[,1],type='p',ylab='simulated values',main='Simulation of Mean')
grid()
dev.off()
bitmap(file='plot2.png')
plot(r$t[,2],type='p',ylab='simulated values',main='Simulation of Median')
grid()
dev.off()
bitmap(file='plot3.png')
plot(r$t[,3],type='p',ylab='simulated values',main='Simulation of Midrange')
grid()
dev.off()
bitmap(file='plot4.png')
densityplot(~r$t[,1],col='black',main='Density Plot',xlab='mean')
dev.off()
bitmap(file='plot5.png')
densityplot(~r$t[,2],col='black',main='Density Plot',xlab='median')
dev.off()
bitmap(file='plot6.png')
densityplot(~r$t[,3],col='black',main='Density Plot',xlab='midrange')
dev.off()
z <- data.frame(cbind(r$t[,1],r$t[,2],r$t[,3]))
colnames(z) <- list('mean','median','midrange')
bitmap(file='plot7.png')
boxplot(z,notch=TRUE,ylab='simulated values',main='Bootstrap Simulation - Central Tendency')
grid()
dev.off()
load(file='createtable')
a<-table.start()
a<-table.row.start(a)
a<-table.element(a,'Estimation Results of Blocked Bootstrap',6,TRUE)
a<-table.row.end(a)
a<-table.row.start(a)
a<-table.element(a,'statistic',header=TRUE)
a<-table.element(a,'Q1',header=TRUE)
a<-table.element(a,'Estimate',header=TRUE)
a<-table.element(a,'Q3',header=TRUE)
a<-table.element(a,'S.D.',header=TRUE)
a<-table.element(a,'IQR',header=TRUE)
a<-table.row.end(a)
a<-table.row.start(a)
a<-table.element(a,'mean',header=TRUE)
q1 <- quantile(r$t[,1],0.25)[[1]]
q3 <- quantile(r$t[,1],0.75)[[1]]
a<-table.element(a,q1)
a<-table.element(a,r$t0[1])
a<-table.element(a,q3)
a<-table.element(a,sqrt(var(r$t[,1])))
a<-table.element(a,q3-q1)
a<-table.row.end(a)
a<-table.row.start(a)
a<-table.element(a,'median',header=TRUE)
q1 <- quantile(r$t[,2],0.25)[[1]]
q3 <- quantile(r$t[,2],0.75)[[1]]
a<-table.element(a,q1)
a<-table.element(a,r$t0[2])
a<-table.element(a,q3)
a<-table.element(a,sqrt(var(r$t[,2])))
a<-table.element(a,q3-q1)
a<-table.row.end(a)
a<-table.row.start(a)
a<-table.element(a,'midrange',header=TRUE)
q1 <- quantile(r$t[,3],0.25)[[1]]
q3 <- quantile(r$t[,3],0.75)[[1]]
a<-table.element(a,q1)
a<-table.element(a,r$t0[3])
a<-table.element(a,q3)
a<-table.element(a,sqrt(var(r$t[,3])))
a<-table.element(a,q3-q1)
a<-table.row.end(a)
a<-table.end(a)
table.save(a,file='mytable.tab')