Free Statistics

of Irreproducible Research!

Author's title

Author*The author of this computation has been verified*
R Software Modulerwasp_bootstrapplot.wasp
Title produced by softwareBlocked Bootstrap Plot - Central Tendency
Date of computationMon, 03 Nov 2008 13:58:36 -0700
Cite this page as followsStatistical Computations at FreeStatistics.org, Office for Research Development and Education, URL https://freestatistics.org/blog/index.php?v=date/2008/Nov/03/t1225745943cl93epik0sf5jzd.htm/, Retrieved Mon, 13 May 2024 22:56:38 +0000
Statistical Computations at FreeStatistics.org, Office for Research Development and Education, URL https://freestatistics.org/blog/index.php?pk=21260, Retrieved Mon, 13 May 2024 22:56:38 +0000
QR Codes:

Original text written by user:
IsPrivate?No (this computation is public)
User-defined keywords
Estimated Impact174
Family? (F = Feedback message, R = changed R code, M = changed R Module, P = changed Parameters, D = changed Data)
F     [Blocked Bootstrap Plot - Central Tendency] [workshop 3] [2007-10-26 12:36:24] [e9ffc5de6f8a7be62f22b142b5b6b1a8]
F    D  [Blocked Bootstrap Plot - Central Tendency] [Hypothesis Testin...] [2008-11-01 09:50:15] [6743688719638b0cb1c0a6e0bf433315]
F         [Blocked Bootstrap Plot - Central Tendency] [q4] [2008-11-03 19:59:59] [988ab43f527fc78aae41c84649095267]
F             [Blocked Bootstrap Plot - Central Tendency] [Hypothesis testin...] [2008-11-03 20:58:36] [02e7fb326979b65614900650d62c19a6] [Current]
Feedback Forum
2008-11-05 16:46:55 [Ken Van den Heuvel] [reply
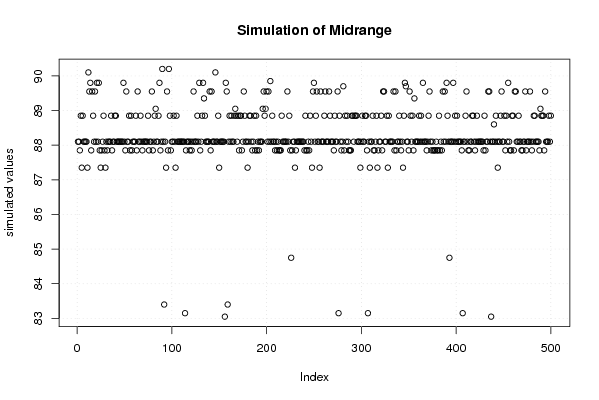
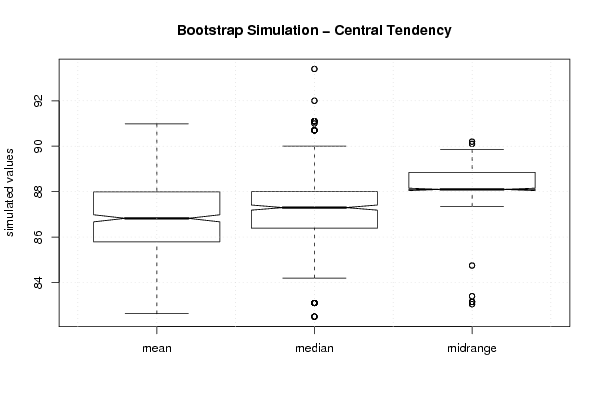
De midrange geeft welliswaar de kleinste spreiding, maar met een aantal outliers. We zullen dus moeten afwegen welke het beste is, rekeninghoudend met spreiding EN outliers. Beoordelen naargelang de situatie is dus aangewezen, de mean en median zomaar uitsluiten lijkt me dus onvoorzichtig.


De outliers zijn tevens WEL van belang en dus niet irrelevant gezien ze de keuze van estimator beinvloeden, en deze outliers tevens ook het resultaat zijn van een gemiddelde van de data.

2008-11-10 17:17:15 [Olivier Uyttendaele] [reply
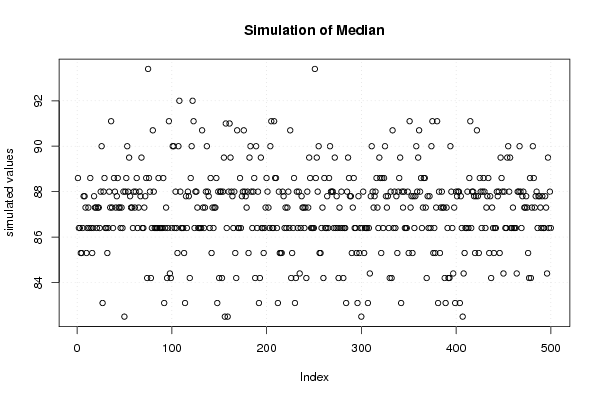
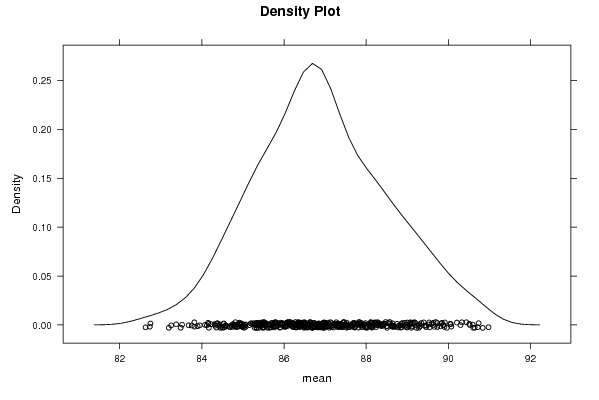
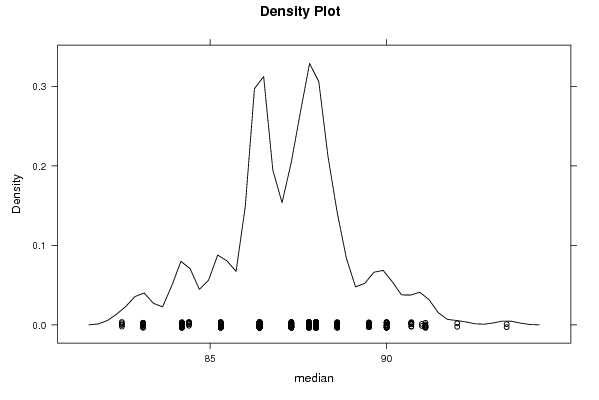
Goed gereproduceerd. De punten die je zit in de grafieken zijn rekenkundige gemiddelden en geen waarnemingen van een dataset. Bij deze berekening wordt er telkens een waarde weggenomen, waarna een nieuw gemiddelde kan genomen worden, werdom wordt er weer een waarde weggenomen en een nieuw gemiddelde… De bedoeling hier is de nauwkeurigheid van het gemiddelde te berekenen. Hoe kleiner de spreiding van de gemiddelden, hoe nauwkeuriger het algemeen gemiddelde. De bootstrap simulation geeft een samenvatting van alle grafieken (scatterplots van de mean, median…) en berekende gemiddelden.
Je schreef in het document dat we best de midrange kunnen gebruiken aangezien daar de variabiliteit het kleinst is. En dus bijgevolg de mean en de midrange niet het beste zijn om dit model te analyseren. Dit is maar gedeeltelijk waar. Het klopt inderdaad at de midrange de kleinste spreiding vertoont, maar je ziet ook duidelijk dat er bij deze midrange er veel outliers aanwezig zijn. De op 1 na kleinste spreiding bevindt zich dan bij de mean die geen outliers vertoont. Bijgevolg dien je deze te gebruiken als beste schatter.

En algemene uitleg over de bootstrap uitgelegd met een concreet voorbeeld gaat als volgt:
“to estimate the uncertainty of the median from a dataset
with 50 elements, we generate a subsample of 50 elements and calculate
the median. This is repeated at least 500 times so that we have at least
500 values for the median. Although the number of bootstrap samples to
use is somewhat arbitrary, 500 subsamples is usually sufficient. To
calculate a 90% confidence interval for the median, the sample medians
are sorted into ascending order and the value of the 25th median
(assuming exactly 500 subsamples were taken) is the lower confidence
limit while the value of the 475th median (assuming exactly 500
subsamples were taken) is the upper confidence limit.”
Bron: 1. Exploratory Data Analysis - 1.3.3.4. Bootstrap Plot

Post a new message
Dataseries X:
109.20
88.60
94.30
98.30
86.40
80.60
104.10
108.20
93.40
71.90
94.10
94.90
96.40
91.10
84.40
86.40
88.00
75.10
109.70
103.00
82.10
68.00
96.40
94.30
90.00
88.00
76.10
82.50
81.40
66.50
97.20
94.10
80.70
70.50
87.80
89.50
99.60
84.20
75.10
92.00
80.80
73.10
99.80
90.00
83.10
72.40
78.80
87.30
91.00
80.10
73.60
86.40
74.50
71.20
92.40
81.50
85.30
69.90
84.20
90.70
100.30


Summary of computational transaction
Raw Inputview raw input (R code)
Raw Outputview raw output of R engine
Computing time3 seconds
R Server'Gwilym Jenkins' @ 72.249.127.135

\begin{tabular}{lllllllll}
\hline
Summary of computational transaction \tabularnewline
Raw Input & view raw input (R code)  \tabularnewline
Raw Output & view raw output of R engine  \tabularnewline
Computing time & 3 seconds \tabularnewline
R Server & 'Gwilym Jenkins' @ 72.249.127.135 \tabularnewline
\hline
\end{tabular}
%Source: https://freestatistics.org/blog/index.php?pk=21260&T=0

[TABLE]
[ROW][C]Summary of computational transaction[/C][/ROW]
[ROW][C]Raw Input[/C][C]view raw input (R code) [/C][/ROW]
[ROW][C]Raw Output[/C][C]view raw output of R engine [/C][/ROW]
[ROW][C]Computing time[/C][C]3 seconds[/C][/ROW]
[ROW][C]R Server[/C][C]'Gwilym Jenkins' @ 72.249.127.135[/C][/ROW]
[/TABLE]
Source: https://freestatistics.org/blog/index.php?pk=21260&T=0

Globally Unique Identifier (entire table): ba.freestatistics.org/blog/index.php?pk=21260&T=0

As an alternative you can also use a QR Code:  

The GUIDs for individual cells are displayed in the table below:

Summary of computational transaction
Raw Inputview raw input (R code)
Raw Outputview raw output of R engine
Computing time3 seconds
R Server'Gwilym Jenkins' @ 72.249.127.135


Estimation Results of Blocked Bootstrap
statisticQ1EstimateQ3S.D.IQR
mean85.787295081967286.893442622950887.99221311475411.602632398502542.20491803278688
median86.487.3881.812647616820631.59999999999999
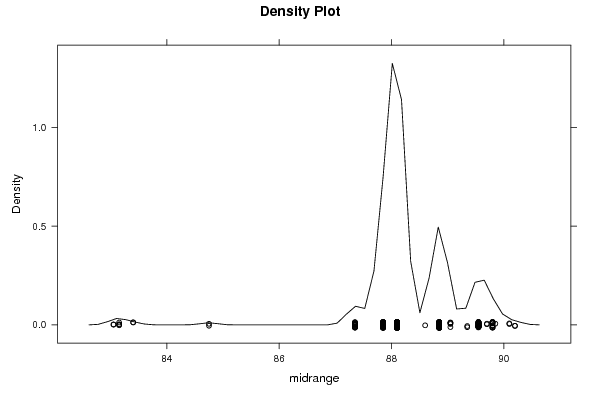
midrange88.188.188.850.9172506186396350.75

\begin{tabular}{lllllllll}
\hline
Estimation Results of Blocked Bootstrap \tabularnewline
statistic & Q1 & Estimate & Q3 & S.D. & IQR \tabularnewline
mean & 85.7872950819672 & 86.8934426229508 & 87.9922131147541 & 1.60263239850254 & 2.20491803278688 \tabularnewline
median & 86.4 & 87.3 & 88 & 1.81264761682063 & 1.59999999999999 \tabularnewline
midrange & 88.1 & 88.1 & 88.85 & 0.917250618639635 & 0.75 \tabularnewline
\hline
\end{tabular}
%Source: https://freestatistics.org/blog/index.php?pk=21260&T=1

[TABLE]
[ROW][C]Estimation Results of Blocked Bootstrap[/C][/ROW]
[ROW][C]statistic[/C][C]Q1[/C][C]Estimate[/C][C]Q3[/C][C]S.D.[/C][C]IQR[/C][/ROW]
[ROW][C]mean[/C][C]85.7872950819672[/C][C]86.8934426229508[/C][C]87.9922131147541[/C][C]1.60263239850254[/C][C]2.20491803278688[/C][/ROW]
[ROW][C]median[/C][C]86.4[/C][C]87.3[/C][C]88[/C][C]1.81264761682063[/C][C]1.59999999999999[/C][/ROW]
[ROW][C]midrange[/C][C]88.1[/C][C]88.1[/C][C]88.85[/C][C]0.917250618639635[/C][C]0.75[/C][/ROW]
[/TABLE]
Source: https://freestatistics.org/blog/index.php?pk=21260&T=1

Globally Unique Identifier (entire table): ba.freestatistics.org/blog/index.php?pk=21260&T=1

As an alternative you can also use a QR Code:  

The GUIDs for individual cells are displayed in the table below:

Estimation Results of Blocked Bootstrap
statisticQ1EstimateQ3S.D.IQR
mean85.787295081967286.893442622950887.99221311475411.602632398502542.20491803278688
median86.487.3881.812647616820631.59999999999999
midrange88.188.188.850.9172506186396350.75


Parameters (Session):
par1 = 500 ; par2 = 12 ;
Parameters (R input):
par1 = 500 ; par2 = 12 ;
R code (references can be found in the software module):
par1 <- as.numeric(par1)
par2 <- as.numeric(par2)
if (par1 < 10) par1 = 10
if (par1 > 5000) par1 = 5000
if (par2 < 3) par2 = 3
if (par2 > length(x)) par2 = length(x)
library(lattice)
library(boot)
boot.stat <- function(s)
{
s.mean <- mean(s)
s.median <- median(s)
s.midrange <- (max(s) + min(s)) / 2
c(s.mean, s.median, s.midrange)
}
(r <- tsboot(x, boot.stat, R=par1, l=12, sim='fixed'))
bitmap(file='plot1.png')
plot(r$t[,1],type='p',ylab='simulated values',main='Simulation of Mean')
grid()
dev.off()
bitmap(file='plot2.png')
plot(r$t[,2],type='p',ylab='simulated values',main='Simulation of Median')
grid()
dev.off()
bitmap(file='plot3.png')
plot(r$t[,3],type='p',ylab='simulated values',main='Simulation of Midrange')
grid()
dev.off()
bitmap(file='plot4.png')
densityplot(~r$t[,1],col='black',main='Density Plot',xlab='mean')
dev.off()
bitmap(file='plot5.png')
densityplot(~r$t[,2],col='black',main='Density Plot',xlab='median')
dev.off()
bitmap(file='plot6.png')
densityplot(~r$t[,3],col='black',main='Density Plot',xlab='midrange')
dev.off()
z <- data.frame(cbind(r$t[,1],r$t[,2],r$t[,3]))
colnames(z) <- list('mean','median','midrange')
bitmap(file='plot7.png')
boxplot(z,notch=TRUE,ylab='simulated values',main='Bootstrap Simulation - Central Tendency')
grid()
dev.off()
load(file='createtable')
a<-table.start()
a<-table.row.start(a)
a<-table.element(a,'Estimation Results of Blocked Bootstrap',6,TRUE)
a<-table.row.end(a)
a<-table.row.start(a)
a<-table.element(a,'statistic',header=TRUE)
a<-table.element(a,'Q1',header=TRUE)
a<-table.element(a,'Estimate',header=TRUE)
a<-table.element(a,'Q3',header=TRUE)
a<-table.element(a,'S.D.',header=TRUE)
a<-table.element(a,'IQR',header=TRUE)
a<-table.row.end(a)
a<-table.row.start(a)
a<-table.element(a,'mean',header=TRUE)
q1 <- quantile(r$t[,1],0.25)[[1]]
q3 <- quantile(r$t[,1],0.75)[[1]]
a<-table.element(a,q1)
a<-table.element(a,r$t0[1])
a<-table.element(a,q3)
a<-table.element(a,sqrt(var(r$t[,1])))
a<-table.element(a,q3-q1)
a<-table.row.end(a)
a<-table.row.start(a)
a<-table.element(a,'median',header=TRUE)
q1 <- quantile(r$t[,2],0.25)[[1]]
q3 <- quantile(r$t[,2],0.75)[[1]]
a<-table.element(a,q1)
a<-table.element(a,r$t0[2])
a<-table.element(a,q3)
a<-table.element(a,sqrt(var(r$t[,2])))
a<-table.element(a,q3-q1)
a<-table.row.end(a)
a<-table.row.start(a)
a<-table.element(a,'midrange',header=TRUE)
q1 <- quantile(r$t[,3],0.25)[[1]]
q3 <- quantile(r$t[,3],0.75)[[1]]
a<-table.element(a,q1)
a<-table.element(a,r$t0[3])
a<-table.element(a,q3)
a<-table.element(a,sqrt(var(r$t[,3])))
a<-table.element(a,q3-q1)
a<-table.row.end(a)
a<-table.end(a)
table.save(a,file='mytable.tab')