Free Statistics

of Irreproducible Research!

Author's title

Author*Unverified author*
R Software Modulerwasp_bootstrapplot.wasp
Title produced by softwareBlocked Bootstrap Plot - Central Tendency
Date of computationWed, 29 Oct 2008 08:22:35 -0600
Cite this page as followsStatistical Computations at FreeStatistics.org, Office for Research Development and Education, URL https://freestatistics.org/blog/index.php?v=date/2008/Oct/29/t1225290264q9qvzaactmqhq3p.htm/, Retrieved Tue, 14 May 2024 03:33:56 +0000
Statistical Computations at FreeStatistics.org, Office for Research Development and Education, URL https://freestatistics.org/blog/index.php?pk=19866, Retrieved Tue, 14 May 2024 03:33:56 +0000
QR Codes:

Original text written by user:
IsPrivate?No (this computation is public)
User-defined keywords
Estimated Impact191
Family? (F = Feedback message, R = changed R code, M = changed R Module, P = changed Parameters, D = changed Data)
F     [Blocked Bootstrap Plot - Central Tendency] [workshop 3] [2007-10-26 12:36:24] [e9ffc5de6f8a7be62f22b142b5b6b1a8]
F    D    [Blocked Bootstrap Plot - Central Tendency] [Q4 BBP] [2008-10-29 14:22:35] [3cb29b4293f2e3432d2608f7187d3d03] [Current]
Feedback Forum
2008-11-06 17:20:49 [Romina Machiels] [reply
De student heeft de vraag goed beantwoord.
2008-11-07 10:29:09 [Siem Van Opstal] [reply
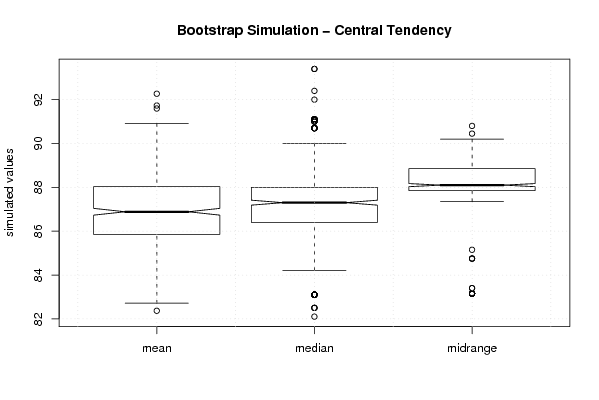
Het is een moeilijke keuze. Bij de midrange is de spreiding het kleinst dus de betrouwbaarheid het grootst maar als er outliers zijn, zijn het ineens heel sterke. Bij het gemiddelde is het betrouwbaarheidsinterval iets groter maar al de gegevens blijven dicht bij het gemiddelde liggen, er zijn niet zo'n sterke outliers.
2008-11-10 09:52:21 [Davy De Nef] [reply
Er werd de software voor de Blocked Bootstrap gebruikt. D
eze berekent meermaals het gemiddelde van de reeks maar laat elke keer 1 random simulatie weg. Elk punt wordt ook teruggeplaatst en kan hergebruikt worden.
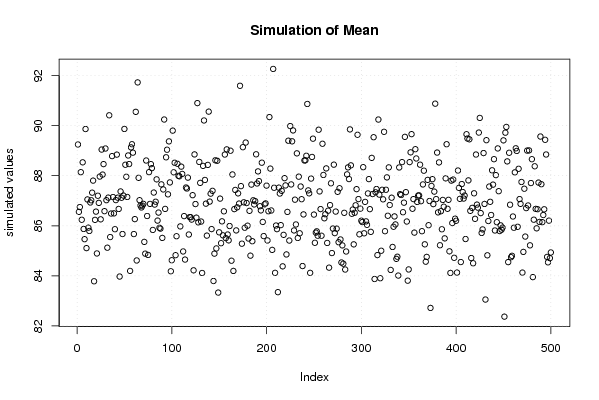
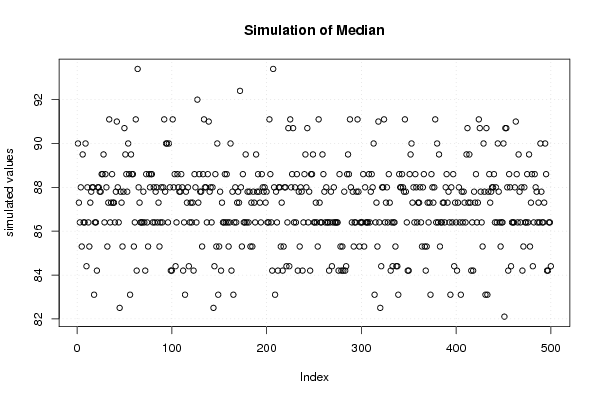
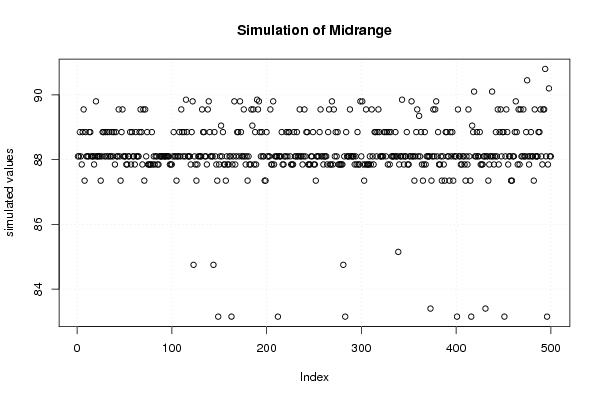
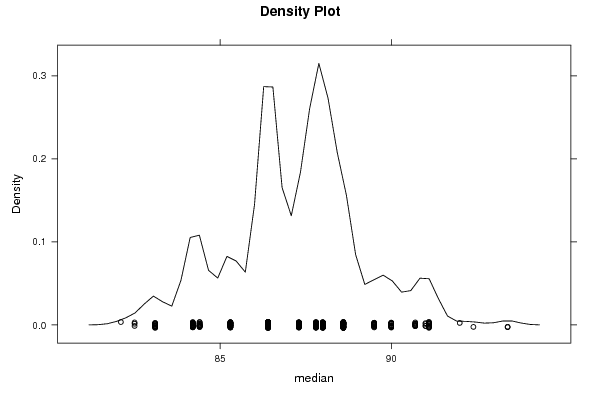
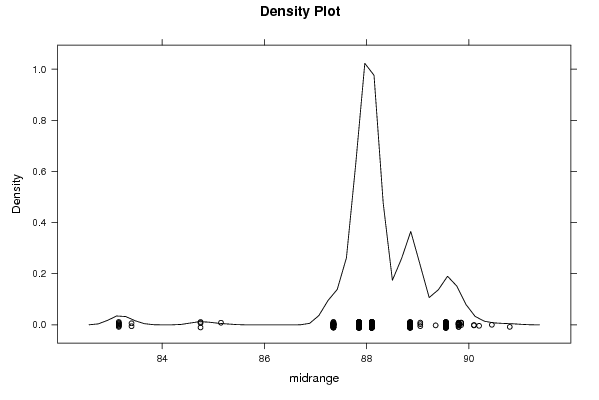
Dit wordt zo ook gedaan voor de mediaan en midrange. We zien bij het gemiddelde terwijl er bij de mediaan een duidelijker patroon zichtbaar wordt, bij de midrange wordt dit patroon nog duidelijker.
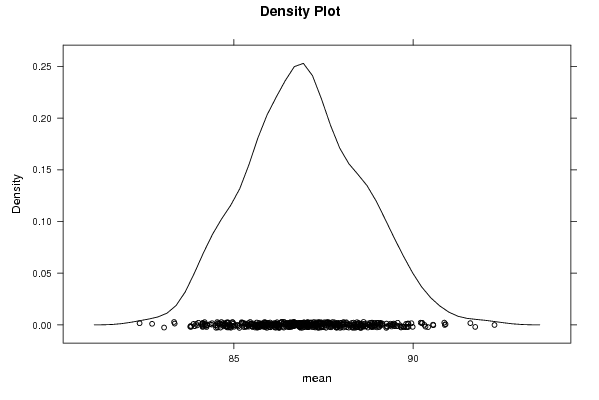
Bij het gemiddelde vinden we een normaalverdeling terug, bij de andere 2 is dat totaal niet het geval.
Als we dan naar de Bootstrap simulation kijken van central tendency, zien we kleine notches bij de midrange. Wat dus wil zeggen dat alles hier dicht op elkaar gepakt zit. Er is een kleine spreiding MAAR er zijn veel outliers. (=bolletjes boven en onder)
Als we naar de mean kijken zien we dat die een veel zekerder gemiddelde weergeeft omdat er minder outliers zijn.
In principe kan je beide nemen, mean of midrange. Over het algemeen wordt geopteerd om te kijken naar het rekenkundig gemiddelde.
2008-11-10 15:55:39 [Niels Herremans] [reply
Hoe groter de spreiding is hoe minder nauwkeurig. In de opdracht opteer ik hier voor mid range als estimator. Er is hier een kleinere spreiding. Maar als ik een observatie neem buiten het betrouwbaarheidsinterval dan ligt die ook ver buiten dit interval.
Ik zou ook het rekenkundig gemiddelde kunnen nemen. De spreiding is hier groter maar er is meer kans dat de observatie in het betrouwbaarheidsinterval ligt.

Post a new message
Dataseries X:
109.20
88.60
94.30
98.30
86.40
80.60
104.10
108.20
93.40
71.90
94.10
94.90
96.40
91.10
84.40
86.40
88.00
75.10
109.70
103.00
82.10
68.00
96.40
94.30
90.00
88.00
76.10
82.50
81.40
66.50
97.20
94.10
80.70
70.50
87.80
89.50
99.60
84.20
75.10
92.00
80.80
73.10
99.80
90.00
83.10
72.40
78.80
87.30
91.00
80.10
73.60
86.40
74.50
71.20
92.40
81.50
85.30
69.90
84.20
90.70
100.30


Summary of computational transaction
Raw Inputview raw input (R code)
Raw Outputview raw output of R engine
Computing time6 seconds
R Server'Sir Ronald Aylmer Fisher' @ 193.190.124.24

\begin{tabular}{lllllllll}
\hline
Summary of computational transaction \tabularnewline
Raw Input & view raw input (R code)  \tabularnewline
Raw Output & view raw output of R engine  \tabularnewline
Computing time & 6 seconds \tabularnewline
R Server & 'Sir Ronald Aylmer Fisher' @ 193.190.124.24 \tabularnewline
\hline
\end{tabular}
%Source: https://freestatistics.org/blog/index.php?pk=19866&T=0

[TABLE]
[ROW][C]Summary of computational transaction[/C][/ROW]
[ROW][C]Raw Input[/C][C]view raw input (R code) [/C][/ROW]
[ROW][C]Raw Output[/C][C]view raw output of R engine [/C][/ROW]
[ROW][C]Computing time[/C][C]6 seconds[/C][/ROW]
[ROW][C]R Server[/C][C]'Sir Ronald Aylmer Fisher' @ 193.190.124.24[/C][/ROW]
[/TABLE]
Source: https://freestatistics.org/blog/index.php?pk=19866&T=0

Globally Unique Identifier (entire table): ba.freestatistics.org/blog/index.php?pk=19866&T=0

As an alternative you can also use a QR Code:  

The GUIDs for individual cells are displayed in the table below:

Summary of computational transaction
Raw Inputview raw input (R code)
Raw Outputview raw output of R engine
Computing time6 seconds
R Server'Sir Ronald Aylmer Fisher' @ 193.190.124.24


Estimation Results of Blocked Bootstrap
statisticQ1EstimateQ3S.D.IQR
mean85.852459016393486.893442622950888.02622950819671.624378659626702.17377049180330
median86.487.3881.899595347691171.59999999999999
midrange87.8588.188.851.003036691856501

\begin{tabular}{lllllllll}
\hline
Estimation Results of Blocked Bootstrap \tabularnewline
statistic & Q1 & Estimate & Q3 & S.D. & IQR \tabularnewline
mean & 85.8524590163934 & 86.8934426229508 & 88.0262295081967 & 1.62437865962670 & 2.17377049180330 \tabularnewline
median & 86.4 & 87.3 & 88 & 1.89959534769117 & 1.59999999999999 \tabularnewline
midrange & 87.85 & 88.1 & 88.85 & 1.00303669185650 & 1 \tabularnewline
\hline
\end{tabular}
%Source: https://freestatistics.org/blog/index.php?pk=19866&T=1

[TABLE]
[ROW][C]Estimation Results of Blocked Bootstrap[/C][/ROW]
[ROW][C]statistic[/C][C]Q1[/C][C]Estimate[/C][C]Q3[/C][C]S.D.[/C][C]IQR[/C][/ROW]
[ROW][C]mean[/C][C]85.8524590163934[/C][C]86.8934426229508[/C][C]88.0262295081967[/C][C]1.62437865962670[/C][C]2.17377049180330[/C][/ROW]
[ROW][C]median[/C][C]86.4[/C][C]87.3[/C][C]88[/C][C]1.89959534769117[/C][C]1.59999999999999[/C][/ROW]
[ROW][C]midrange[/C][C]87.85[/C][C]88.1[/C][C]88.85[/C][C]1.00303669185650[/C][C]1[/C][/ROW]
[/TABLE]
Source: https://freestatistics.org/blog/index.php?pk=19866&T=1

Globally Unique Identifier (entire table): ba.freestatistics.org/blog/index.php?pk=19866&T=1

As an alternative you can also use a QR Code:  

The GUIDs for individual cells are displayed in the table below:

Estimation Results of Blocked Bootstrap
statisticQ1EstimateQ3S.D.IQR
mean85.852459016393486.893442622950888.02622950819671.624378659626702.17377049180330
median86.487.3881.899595347691171.59999999999999
midrange87.8588.188.851.003036691856501


Parameters (Session):
par1 = 500 ; par2 = 12 ;
Parameters (R input):
par1 = 500 ; par2 = 12 ;
R code (references can be found in the software module):
par1 <- as.numeric(par1)
par2 <- as.numeric(par2)
if (par1 < 10) par1 = 10
if (par1 > 5000) par1 = 5000
if (par2 < 3) par2 = 3
if (par2 > length(x)) par2 = length(x)
library(lattice)
library(boot)
boot.stat <- function(s)
{
s.mean <- mean(s)
s.median <- median(s)
s.midrange <- (max(s) + min(s)) / 2
c(s.mean, s.median, s.midrange)
}
(r <- tsboot(x, boot.stat, R=par1, l=12, sim='fixed'))
bitmap(file='plot1.png')
plot(r$t[,1],type='p',ylab='simulated values',main='Simulation of Mean')
grid()
dev.off()
bitmap(file='plot2.png')
plot(r$t[,2],type='p',ylab='simulated values',main='Simulation of Median')
grid()
dev.off()
bitmap(file='plot3.png')
plot(r$t[,3],type='p',ylab='simulated values',main='Simulation of Midrange')
grid()
dev.off()
bitmap(file='plot4.png')
densityplot(~r$t[,1],col='black',main='Density Plot',xlab='mean')
dev.off()
bitmap(file='plot5.png')
densityplot(~r$t[,2],col='black',main='Density Plot',xlab='median')
dev.off()
bitmap(file='plot6.png')
densityplot(~r$t[,3],col='black',main='Density Plot',xlab='midrange')
dev.off()
z <- data.frame(cbind(r$t[,1],r$t[,2],r$t[,3]))
colnames(z) <- list('mean','median','midrange')
bitmap(file='plot7.png')
boxplot(z,notch=TRUE,ylab='simulated values',main='Bootstrap Simulation - Central Tendency')
grid()
dev.off()
load(file='createtable')
a<-table.start()
a<-table.row.start(a)
a<-table.element(a,'Estimation Results of Blocked Bootstrap',6,TRUE)
a<-table.row.end(a)
a<-table.row.start(a)
a<-table.element(a,'statistic',header=TRUE)
a<-table.element(a,'Q1',header=TRUE)
a<-table.element(a,'Estimate',header=TRUE)
a<-table.element(a,'Q3',header=TRUE)
a<-table.element(a,'S.D.',header=TRUE)
a<-table.element(a,'IQR',header=TRUE)
a<-table.row.end(a)
a<-table.row.start(a)
a<-table.element(a,'mean',header=TRUE)
q1 <- quantile(r$t[,1],0.25)[[1]]
q3 <- quantile(r$t[,1],0.75)[[1]]
a<-table.element(a,q1)
a<-table.element(a,r$t0[1])
a<-table.element(a,q3)
a<-table.element(a,sqrt(var(r$t[,1])))
a<-table.element(a,q3-q1)
a<-table.row.end(a)
a<-table.row.start(a)
a<-table.element(a,'median',header=TRUE)
q1 <- quantile(r$t[,2],0.25)[[1]]
q3 <- quantile(r$t[,2],0.75)[[1]]
a<-table.element(a,q1)
a<-table.element(a,r$t0[2])
a<-table.element(a,q3)
a<-table.element(a,sqrt(var(r$t[,2])))
a<-table.element(a,q3-q1)
a<-table.row.end(a)
a<-table.row.start(a)
a<-table.element(a,'midrange',header=TRUE)
q1 <- quantile(r$t[,3],0.25)[[1]]
q3 <- quantile(r$t[,3],0.75)[[1]]
a<-table.element(a,q1)
a<-table.element(a,r$t0[3])
a<-table.element(a,q3)
a<-table.element(a,sqrt(var(r$t[,3])))
a<-table.element(a,q3-q1)
a<-table.row.end(a)
a<-table.end(a)
table.save(a,file='mytable.tab')