Free Statistics

of Irreproducible Research!

Author's title

Author*The author of this computation has been verified*
R Software Modulerwasp_arimabackwardselection.wasp
Title produced by softwareARIMA Backward Selection
Date of computationSun, 18 Dec 2016 17:46:17 +0100
Cite this page as followsStatistical Computations at FreeStatistics.org, Office for Research Development and Education, URL https://freestatistics.org/blog/index.php?v=date/2016/Dec/18/t1482079630lw2zwo9ngddsaby.htm/, Retrieved Fri, 01 Nov 2024 03:35:39 +0000
Statistical Computations at FreeStatistics.org, Office for Research Development and Education, URL https://freestatistics.org/blog/index.php?pk=301176, Retrieved Fri, 01 Nov 2024 03:35:39 +0000
QR Codes:

Original text written by user:
IsPrivate?No (this computation is public)
User-defined keywords
Estimated Impact121
Family? (F = Feedback message, R = changed R code, M = changed R Module, P = changed Parameters, D = changed Data)
-     [(Partial) Autocorrelation Function] [Autocorrelation F...] [2016-12-11 16:38:45] [48565d122ad1a5ad6c25b7f5730e03d6]
- RMP     [ARIMA Backward Selection] [Arima backward] [2016-12-18 16:46:17] [10299735033611e1e2dae6371997f8c9] [Current]
-           [ARIMA Backward Selection] [Backward F1] [2016-12-18 17:16:24] [48565d122ad1a5ad6c25b7f5730e03d6]
- RM        [ARIMA Forecasting] [Arima forecast F1] [2016-12-18 18:48:42] [48565d122ad1a5ad6c25b7f5730e03d6]
- R P         [ARIMA Forecasting] [ARIMA forecast F1] [2016-12-23 11:21:48] [e37f5c813d0dfcb3787d64bb91655c98]
- RM        [Standard Deviation-Mean Plot] [SDMP F1] [2016-12-21 09:32:02] [48565d122ad1a5ad6c25b7f5730e03d6]
-           [ARIMA Backward Selection] [F1 Arima backward...] [2016-12-23 10:56:30] [48565d122ad1a5ad6c25b7f5730e03d6]
Feedback Forum

Post a new message
Dataseries X:
3567.2
3968.25
4285.35
4130.95
4219.4
4626.2
3860.75
4174.15
4668.65
4630.05
4553.7
4603.85
4310.7
4831.3
5145.3
4886.65
4934.05
5304.7
4419.45
4804.85
5105
5132.6
4982.5
4906.7
4506.4
5010.85
5392.25
5049.7
5143.9
5449.9
4520.4
4936.95
5358.55
5289.5
5123.55
4985.65
4682.65
5175.55
5374.7
5289
5176.15
5604.25
4608.8
4898.15
5448.65
5373.05
5078.6
5233.4
4629.2
5387.8
5736.65
5357.9
5337.95
5795.5
4804.05
5120.5
5850.45
5734.75
5539
5582.85
4983.1
5672
6185.8
5835.6
5930.4
6444.65
5171.05
5739.1
6413.9
6230.2
6015.45
6174.25
5579.25
6133.45
6478.7
6184.4
6185.65
6556
5123.25
6028.9
6499.95
6190.05
6027.95
6034
5128.75
6087.7
6628.15
6075.3
6352.1
6824
5412.35
6171.25
6521.35
6457.6
5930.95
5842.7
5120.1
5719.95
5946.7
5921.1
6072
6489.4
5291.15
5986.45
6538.15
6442.8
6169.55
5793
5254.85
6050.75
6606.15
6221.15
6293.4
6908.4
5498.95
6145.35


Summary of computational transaction
Raw Input view raw input (R code)
Raw Outputview raw output of R engine
Computing time10 seconds
R ServerBig Analytics Cloud Computing Center

\begin{tabular}{lllllllll}
\hline
Summary of computational transaction \tabularnewline
Raw Input view raw input (R code)  \tabularnewline
Raw Outputview raw output of R engine  \tabularnewline
Computing time10 seconds \tabularnewline
R ServerBig Analytics Cloud Computing Center \tabularnewline
\hline
\end{tabular}
%Source: https://freestatistics.org/blog/index.php?pk=301176&T=0

[TABLE]
[ROW]
Summary of computational transaction[/C][/ROW] [ROW]Raw Input[/C] view raw input (R code) [/C][/ROW] [ROW]Raw Output[/C]view raw output of R engine [/C][/ROW] [ROW]Computing time[/C]10 seconds[/C][/ROW] [ROW]R Server[/C]Big Analytics Cloud Computing Center[/C][/ROW] [/TABLE] Source: https://freestatistics.org/blog/index.php?pk=301176&T=0

Globally Unique Identifier (entire table): ba.freestatistics.org/blog/index.php?pk=301176&T=0

As an alternative you can also use a QR Code:  

The GUIDs for individual cells are displayed in the table below:

Summary of computational transaction
Raw Input view raw input (R code)
Raw Outputview raw output of R engine
Computing time10 seconds
R ServerBig Analytics Cloud Computing Center


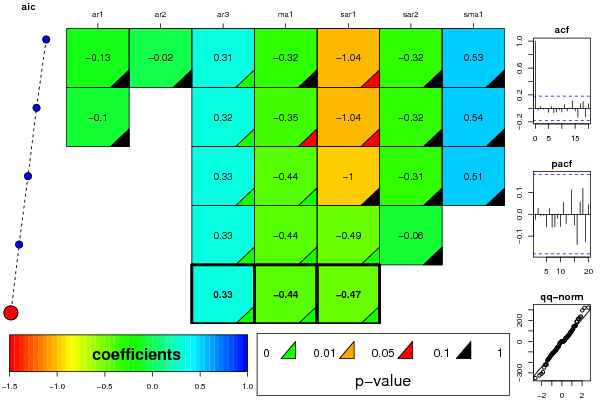
ARIMA Parameter Estimation and Backward Selection
Iterationar1ar2ar3ma1sar1sar2sma1
Estimates ( 1 )-0.1287-0.02070.3124-0.3199-1.0364-0.32210.5323
(p-val)(0.6736 )(0.8998 )(0.006 )(0.3118 )(0.0889 )(0.2579 )(0.3879 )
Estimates ( 2 )-0.098500.319-0.352-1.042-0.32450.5387
(p-val)(0.597 )(NA )(0.0012 )(0.0583 )(0.0785 )(0.2431 )(0.368 )
Estimates ( 3 )000.3278-0.4354-0.9987-0.3050.5065
(p-val)(NA )(NA )(8e-04 )(0 )(0.1166 )(0.2974 )(0.4325 )
Estimates ( 4 )000.3266-0.4358-0.494-0.06340
(p-val)(NA )(NA )(9e-04 )(0 )(0 )(0.5712 )(NA )
Estimates ( 5 )000.3318-0.438-0.469100
(p-val)(NA )(NA )(7e-04 )(0 )(0 )(NA )(NA )
Estimates ( 6 )NANANANANANANA
(p-val)(NA )(NA )(NA )(NA )(NA )(NA )(NA )
Estimates ( 7 )NANANANANANANA
(p-val)(NA )(NA )(NA )(NA )(NA )(NA )(NA )
Estimates ( 8 )NANANANANANANA
(p-val)(NA )(NA )(NA )(NA )(NA )(NA )(NA )
Estimates ( 9 )NANANANANANANA
(p-val)(NA )(NA )(NA )(NA )(NA )(NA )(NA )
Estimates ( 10 )NANANANANANANA
(p-val)(NA )(NA )(NA )(NA )(NA )(NA )(NA )
Estimates ( 11 )NANANANANANANA
(p-val)(NA )(NA )(NA )(NA )(NA )(NA )(NA )
Estimates ( 12 )NANANANANANANA
(p-val)(NA )(NA )(NA )(NA )(NA )(NA )(NA )
Estimates ( 13 )NANANANANANANA
(p-val)(NA )(NA )(NA )(NA )(NA )(NA )(NA )

\begin{tabular}{lllllllll}
\hline
ARIMA Parameter Estimation and Backward Selection \tabularnewline
Iteration & ar1 & ar2 & ar3 & ma1 & sar1 & sar2 & sma1 \tabularnewline
Estimates ( 1 ) & -0.1287 & -0.0207 & 0.3124 & -0.3199 & -1.0364 & -0.3221 & 0.5323 \tabularnewline
(p-val) & (0.6736 ) & (0.8998 ) & (0.006 ) & (0.3118 ) & (0.0889 ) & (0.2579 ) & (0.3879 ) \tabularnewline
Estimates ( 2 ) & -0.0985 & 0 & 0.319 & -0.352 & -1.042 & -0.3245 & 0.5387 \tabularnewline
(p-val) & (0.597 ) & (NA ) & (0.0012 ) & (0.0583 ) & (0.0785 ) & (0.2431 ) & (0.368 ) \tabularnewline
Estimates ( 3 ) & 0 & 0 & 0.3278 & -0.4354 & -0.9987 & -0.305 & 0.5065 \tabularnewline
(p-val) & (NA ) & (NA ) & (8e-04 ) & (0 ) & (0.1166 ) & (0.2974 ) & (0.4325 ) \tabularnewline
Estimates ( 4 ) & 0 & 0 & 0.3266 & -0.4358 & -0.494 & -0.0634 & 0 \tabularnewline
(p-val) & (NA ) & (NA ) & (9e-04 ) & (0 ) & (0 ) & (0.5712 ) & (NA ) \tabularnewline
Estimates ( 5 ) & 0 & 0 & 0.3318 & -0.438 & -0.4691 & 0 & 0 \tabularnewline
(p-val) & (NA ) & (NA ) & (7e-04 ) & (0 ) & (0 ) & (NA ) & (NA ) \tabularnewline
Estimates ( 6 ) & NA & NA & NA & NA & NA & NA & NA \tabularnewline
(p-val) & (NA ) & (NA ) & (NA ) & (NA ) & (NA ) & (NA ) & (NA ) \tabularnewline
Estimates ( 7 ) & NA & NA & NA & NA & NA & NA & NA \tabularnewline
(p-val) & (NA ) & (NA ) & (NA ) & (NA ) & (NA ) & (NA ) & (NA ) \tabularnewline
Estimates ( 8 ) & NA & NA & NA & NA & NA & NA & NA \tabularnewline
(p-val) & (NA ) & (NA ) & (NA ) & (NA ) & (NA ) & (NA ) & (NA ) \tabularnewline
Estimates ( 9 ) & NA & NA & NA & NA & NA & NA & NA \tabularnewline
(p-val) & (NA ) & (NA ) & (NA ) & (NA ) & (NA ) & (NA ) & (NA ) \tabularnewline
Estimates ( 10 ) & NA & NA & NA & NA & NA & NA & NA \tabularnewline
(p-val) & (NA ) & (NA ) & (NA ) & (NA ) & (NA ) & (NA ) & (NA ) \tabularnewline
Estimates ( 11 ) & NA & NA & NA & NA & NA & NA & NA \tabularnewline
(p-val) & (NA ) & (NA ) & (NA ) & (NA ) & (NA ) & (NA ) & (NA ) \tabularnewline
Estimates ( 12 ) & NA & NA & NA & NA & NA & NA & NA \tabularnewline
(p-val) & (NA ) & (NA ) & (NA ) & (NA ) & (NA ) & (NA ) & (NA ) \tabularnewline
Estimates ( 13 ) & NA & NA & NA & NA & NA & NA & NA \tabularnewline
(p-val) & (NA ) & (NA ) & (NA ) & (NA ) & (NA ) & (NA ) & (NA ) \tabularnewline
\hline
\end{tabular}
%Source: https://freestatistics.org/blog/index.php?pk=301176&T=1

[TABLE]
[ROW][C]ARIMA Parameter Estimation and Backward Selection[/C][/ROW]
[ROW][C]Iteration[/C][C]ar1[/C][C]ar2[/C][C]ar3[/C][C]ma1[/C][C]sar1[/C][C]sar2[/C][C]sma1[/C][/ROW]
[ROW][C]Estimates ( 1 )[/C][C]-0.1287[/C][C]-0.0207[/C][C]0.3124[/C][C]-0.3199[/C][C]-1.0364[/C][C]-0.3221[/C][C]0.5323[/C][/ROW]
[ROW][C](p-val)[/C][C](0.6736 )[/C][C](0.8998 )[/C][C](0.006 )[/C][C](0.3118 )[/C][C](0.0889 )[/C][C](0.2579 )[/C][C](0.3879 )[/C][/ROW]
[ROW][C]Estimates ( 2 )[/C][C]-0.0985[/C][C]0[/C][C]0.319[/C][C]-0.352[/C][C]-1.042[/C][C]-0.3245[/C][C]0.5387[/C][/ROW]
[ROW][C](p-val)[/C][C](0.597 )[/C][C](NA )[/C][C](0.0012 )[/C][C](0.0583 )[/C][C](0.0785 )[/C][C](0.2431 )[/C][C](0.368 )[/C][/ROW]
[ROW][C]Estimates ( 3 )[/C][C]0[/C][C]0[/C][C]0.3278[/C][C]-0.4354[/C][C]-0.9987[/C][C]-0.305[/C][C]0.5065[/C][/ROW]
[ROW][C](p-val)[/C][C](NA )[/C][C](NA )[/C][C](8e-04 )[/C][C](0 )[/C][C](0.1166 )[/C][C](0.2974 )[/C][C](0.4325 )[/C][/ROW]
[ROW][C]Estimates ( 4 )[/C][C]0[/C][C]0[/C][C]0.3266[/C][C]-0.4358[/C][C]-0.494[/C][C]-0.0634[/C][C]0[/C][/ROW]
[ROW][C](p-val)[/C][C](NA )[/C][C](NA )[/C][C](9e-04 )[/C][C](0 )[/C][C](0 )[/C][C](0.5712 )[/C][C](NA )[/C][/ROW]
[ROW][C]Estimates ( 5 )[/C][C]0[/C][C]0[/C][C]0.3318[/C][C]-0.438[/C][C]-0.4691[/C][C]0[/C][C]0[/C][/ROW]
[ROW][C](p-val)[/C][C](NA )[/C][C](NA )[/C][C](7e-04 )[/C][C](0 )[/C][C](0 )[/C][C](NA )[/C][C](NA )[/C][/ROW]
[ROW][C]Estimates ( 6 )[/C][C]NA[/C][C]NA[/C][C]NA[/C][C]NA[/C][C]NA[/C][C]NA[/C][C]NA[/C][/ROW]
[ROW][C](p-val)[/C][C](NA )[/C][C](NA )[/C][C](NA )[/C][C](NA )[/C][C](NA )[/C][C](NA )[/C][C](NA )[/C][/ROW]
[ROW][C]Estimates ( 7 )[/C][C]NA[/C][C]NA[/C][C]NA[/C][C]NA[/C][C]NA[/C][C]NA[/C][C]NA[/C][/ROW]
[ROW][C](p-val)[/C][C](NA )[/C][C](NA )[/C][C](NA )[/C][C](NA )[/C][C](NA )[/C][C](NA )[/C][C](NA )[/C][/ROW]
[ROW][C]Estimates ( 8 )[/C][C]NA[/C][C]NA[/C][C]NA[/C][C]NA[/C][C]NA[/C][C]NA[/C][C]NA[/C][/ROW]
[ROW][C](p-val)[/C][C](NA )[/C][C](NA )[/C][C](NA )[/C][C](NA )[/C][C](NA )[/C][C](NA )[/C][C](NA )[/C][/ROW]
[ROW][C]Estimates ( 9 )[/C][C]NA[/C][C]NA[/C][C]NA[/C][C]NA[/C][C]NA[/C][C]NA[/C][C]NA[/C][/ROW]
[ROW][C](p-val)[/C][C](NA )[/C][C](NA )[/C][C](NA )[/C][C](NA )[/C][C](NA )[/C][C](NA )[/C][C](NA )[/C][/ROW]
[ROW][C]Estimates ( 10 )[/C][C]NA[/C][C]NA[/C][C]NA[/C][C]NA[/C][C]NA[/C][C]NA[/C][C]NA[/C][/ROW]
[ROW][C](p-val)[/C][C](NA )[/C][C](NA )[/C][C](NA )[/C][C](NA )[/C][C](NA )[/C][C](NA )[/C][C](NA )[/C][/ROW]
[ROW][C]Estimates ( 11 )[/C][C]NA[/C][C]NA[/C][C]NA[/C][C]NA[/C][C]NA[/C][C]NA[/C][C]NA[/C][/ROW]
[ROW][C](p-val)[/C][C](NA )[/C][C](NA )[/C][C](NA )[/C][C](NA )[/C][C](NA )[/C][C](NA )[/C][C](NA )[/C][/ROW]
[ROW][C]Estimates ( 12 )[/C][C]NA[/C][C]NA[/C][C]NA[/C][C]NA[/C][C]NA[/C][C]NA[/C][C]NA[/C][/ROW]
[ROW][C](p-val)[/C][C](NA )[/C][C](NA )[/C][C](NA )[/C][C](NA )[/C][C](NA )[/C][C](NA )[/C][C](NA )[/C][/ROW]
[ROW][C]Estimates ( 13 )[/C][C]NA[/C][C]NA[/C][C]NA[/C][C]NA[/C][C]NA[/C][C]NA[/C][C]NA[/C][/ROW]
[ROW][C](p-val)[/C][C](NA )[/C][C](NA )[/C][C](NA )[/C][C](NA )[/C][C](NA )[/C][C](NA )[/C][C](NA )[/C][/ROW]
[/TABLE]
Source: https://freestatistics.org/blog/index.php?pk=301176&T=1

Globally Unique Identifier (entire table): ba.freestatistics.org/blog/index.php?pk=301176&T=1

As an alternative you can also use a QR Code:  

The GUIDs for individual cells are displayed in the table below:

ARIMA Parameter Estimation and Backward Selection
Iterationar1ar2ar3ma1sar1sar2sma1
Estimates ( 1 )-0.1287-0.02070.3124-0.3199-1.0364-0.32210.5323
(p-val)(0.6736 )(0.8998 )(0.006 )(0.3118 )(0.0889 )(0.2579 )(0.3879 )
Estimates ( 2 )-0.098500.319-0.352-1.042-0.32450.5387
(p-val)(0.597 )(NA )(0.0012 )(0.0583 )(0.0785 )(0.2431 )(0.368 )
Estimates ( 3 )000.3278-0.4354-0.9987-0.3050.5065
(p-val)(NA )(NA )(8e-04 )(0 )(0.1166 )(0.2974 )(0.4325 )
Estimates ( 4 )000.3266-0.4358-0.494-0.06340
(p-val)(NA )(NA )(9e-04 )(0 )(0 )(0.5712 )(NA )
Estimates ( 5 )000.3318-0.438-0.469100
(p-val)(NA )(NA )(7e-04 )(0 )(0 )(NA )(NA )
Estimates ( 6 )NANANANANANANA
(p-val)(NA )(NA )(NA )(NA )(NA )(NA )(NA )
Estimates ( 7 )NANANANANANANA
(p-val)(NA )(NA )(NA )(NA )(NA )(NA )(NA )
Estimates ( 8 )NANANANANANANA
(p-val)(NA )(NA )(NA )(NA )(NA )(NA )(NA )
Estimates ( 9 )NANANANANANANA
(p-val)(NA )(NA )(NA )(NA )(NA )(NA )(NA )
Estimates ( 10 )NANANANANANANA
(p-val)(NA )(NA )(NA )(NA )(NA )(NA )(NA )
Estimates ( 11 )NANANANANANANA
(p-val)(NA )(NA )(NA )(NA )(NA )(NA )(NA )
Estimates ( 12 )NANANANANANANA
(p-val)(NA )(NA )(NA )(NA )(NA )(NA )(NA )
Estimates ( 13 )NANANANANANANA
(p-val)(NA )(NA )(NA )(NA )(NA )(NA )(NA )


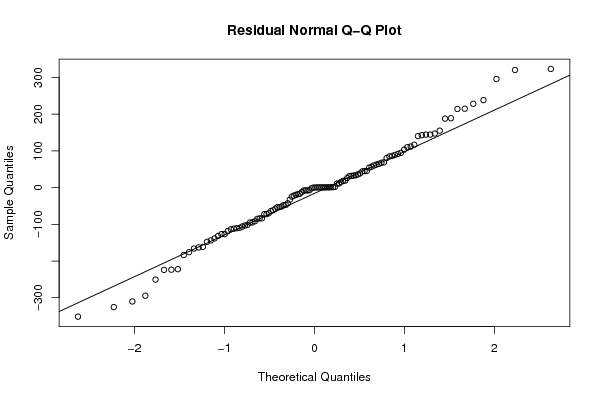
Estimated ARIMA Residuals
Value
-12.1497304126533
92.0087522689599
33.6545730975537
-61.6619803342512
-95.104296812611
-72.3158816258234
-110.62380826062
32.0114712569548
-147.699945468834
18.4907741743734
-63.8152630790685
-85.1024661541884
-183.617749745139
-19.798212300247
89.0122607285908
-52.878834660881
-7.86075708544465
-106.124653582932
-103.406947958638
11.0414049246597
62.6181464891516
-7.7052730266345
-72.3597521883918
-161.563127843049
-6.95050009973598
0.574252299126528
-109.813252701894
147.412137049234
-118.384555462311
84.9777857147246
-126.549211125964
-101.490382888253
103.655195352
26.2285629634167
-94.5519256755118
155.164712693864
-175.933739653212
228.336747438816
80.4956948966757
-51.5135884902922
-113.442645335542
15.3539714382504
31.3004409436352
-18.027432674673
214.995235925587
54.4906361595021
68.9874014791721
-22.1223954274419
-131.676900166465
-7.7280432931866
214.283036133537
38.5701191485059
144.46772958477
67.7098940654187
-222.205343927433
111.906781407914
64.6546605803296
32.8089156799988
-47.9831934335716
44.1667616037021
35.9174034045618
-143.698352133243
-165.895278825138
-16.9080622108322
11.3914388089788
-83.7260526992286
-351.57482526402
320.501115342758
-42.7014994101692
-83.5406657638122
-138.285670986304
-91.5452557883363
-294.509255402484
189.256285876838
238.502577349113
-24.7211247174328
116.833735324152
45.0076019004355
19.0270183613457
-32.9869507177327
-250.602330582704
94.8952500691975
-310.134824978627
-224.138741411646
-126.625776620169
-111.921097240238
-223.669230513527
295.885291945922
188.015551683817
142.929441775075
144.411590850631
-53.1667483926658
110.152305848579
60.2211532253104
140.338469150872
-325.507310696539
86.3727796438962
56.914538937207
323.367743872469
-57.6475976730262
-162.973902839116
45.3287456324661
-47.025624527736
-69.8266382416078

\begin{tabular}{lllllllll}
\hline
Estimated ARIMA Residuals \tabularnewline
Value \tabularnewline
-12.1497304126533 \tabularnewline
92.0087522689599 \tabularnewline
33.6545730975537 \tabularnewline
-61.6619803342512 \tabularnewline
-95.104296812611 \tabularnewline
-72.3158816258234 \tabularnewline
-110.62380826062 \tabularnewline
32.0114712569548 \tabularnewline
-147.699945468834 \tabularnewline
18.4907741743734 \tabularnewline
-63.8152630790685 \tabularnewline
-85.1024661541884 \tabularnewline
-183.617749745139 \tabularnewline
-19.798212300247 \tabularnewline
89.0122607285908 \tabularnewline
-52.878834660881 \tabularnewline
-7.86075708544465 \tabularnewline
-106.124653582932 \tabularnewline
-103.406947958638 \tabularnewline
11.0414049246597 \tabularnewline
62.6181464891516 \tabularnewline
-7.7052730266345 \tabularnewline
-72.3597521883918 \tabularnewline
-161.563127843049 \tabularnewline
-6.95050009973598 \tabularnewline
0.574252299126528 \tabularnewline
-109.813252701894 \tabularnewline
147.412137049234 \tabularnewline
-118.384555462311 \tabularnewline
84.9777857147246 \tabularnewline
-126.549211125964 \tabularnewline
-101.490382888253 \tabularnewline
103.655195352 \tabularnewline
26.2285629634167 \tabularnewline
-94.5519256755118 \tabularnewline
155.164712693864 \tabularnewline
-175.933739653212 \tabularnewline
228.336747438816 \tabularnewline
80.4956948966757 \tabularnewline
-51.5135884902922 \tabularnewline
-113.442645335542 \tabularnewline
15.3539714382504 \tabularnewline
31.3004409436352 \tabularnewline
-18.027432674673 \tabularnewline
214.995235925587 \tabularnewline
54.4906361595021 \tabularnewline
68.9874014791721 \tabularnewline
-22.1223954274419 \tabularnewline
-131.676900166465 \tabularnewline
-7.7280432931866 \tabularnewline
214.283036133537 \tabularnewline
38.5701191485059 \tabularnewline
144.46772958477 \tabularnewline
67.7098940654187 \tabularnewline
-222.205343927433 \tabularnewline
111.906781407914 \tabularnewline
64.6546605803296 \tabularnewline
32.8089156799988 \tabularnewline
-47.9831934335716 \tabularnewline
44.1667616037021 \tabularnewline
35.9174034045618 \tabularnewline
-143.698352133243 \tabularnewline
-165.895278825138 \tabularnewline
-16.9080622108322 \tabularnewline
11.3914388089788 \tabularnewline
-83.7260526992286 \tabularnewline
-351.57482526402 \tabularnewline
320.501115342758 \tabularnewline
-42.7014994101692 \tabularnewline
-83.5406657638122 \tabularnewline
-138.285670986304 \tabularnewline
-91.5452557883363 \tabularnewline
-294.509255402484 \tabularnewline
189.256285876838 \tabularnewline
238.502577349113 \tabularnewline
-24.7211247174328 \tabularnewline
116.833735324152 \tabularnewline
45.0076019004355 \tabularnewline
19.0270183613457 \tabularnewline
-32.9869507177327 \tabularnewline
-250.602330582704 \tabularnewline
94.8952500691975 \tabularnewline
-310.134824978627 \tabularnewline
-224.138741411646 \tabularnewline
-126.625776620169 \tabularnewline
-111.921097240238 \tabularnewline
-223.669230513527 \tabularnewline
295.885291945922 \tabularnewline
188.015551683817 \tabularnewline
142.929441775075 \tabularnewline
144.411590850631 \tabularnewline
-53.1667483926658 \tabularnewline
110.152305848579 \tabularnewline
60.2211532253104 \tabularnewline
140.338469150872 \tabularnewline
-325.507310696539 \tabularnewline
86.3727796438962 \tabularnewline
56.914538937207 \tabularnewline
323.367743872469 \tabularnewline
-57.6475976730262 \tabularnewline
-162.973902839116 \tabularnewline
45.3287456324661 \tabularnewline
-47.025624527736 \tabularnewline
-69.8266382416078 \tabularnewline
\hline
\end{tabular}
%Source: https://freestatistics.org/blog/index.php?pk=301176&T=2

[TABLE]
[ROW][C]Estimated ARIMA Residuals[/C][/ROW]
[ROW][C]Value[/C][/ROW]
[ROW][C]-12.1497304126533[/C][/ROW]
[ROW][C]92.0087522689599[/C][/ROW]
[ROW][C]33.6545730975537[/C][/ROW]
[ROW][C]-61.6619803342512[/C][/ROW]
[ROW][C]-95.104296812611[/C][/ROW]
[ROW][C]-72.3158816258234[/C][/ROW]
[ROW][C]-110.62380826062[/C][/ROW]
[ROW][C]32.0114712569548[/C][/ROW]
[ROW][C]-147.699945468834[/C][/ROW]
[ROW][C]18.4907741743734[/C][/ROW]
[ROW][C]-63.8152630790685[/C][/ROW]
[ROW][C]-85.1024661541884[/C][/ROW]
[ROW][C]-183.617749745139[/C][/ROW]
[ROW][C]-19.798212300247[/C][/ROW]
[ROW][C]89.0122607285908[/C][/ROW]
[ROW][C]-52.878834660881[/C][/ROW]
[ROW][C]-7.86075708544465[/C][/ROW]
[ROW][C]-106.124653582932[/C][/ROW]
[ROW][C]-103.406947958638[/C][/ROW]
[ROW][C]11.0414049246597[/C][/ROW]
[ROW][C]62.6181464891516[/C][/ROW]
[ROW][C]-7.7052730266345[/C][/ROW]
[ROW][C]-72.3597521883918[/C][/ROW]
[ROW][C]-161.563127843049[/C][/ROW]
[ROW][C]-6.95050009973598[/C][/ROW]
[ROW][C]0.574252299126528[/C][/ROW]
[ROW][C]-109.813252701894[/C][/ROW]
[ROW][C]147.412137049234[/C][/ROW]
[ROW][C]-118.384555462311[/C][/ROW]
[ROW][C]84.9777857147246[/C][/ROW]
[ROW][C]-126.549211125964[/C][/ROW]
[ROW][C]-101.490382888253[/C][/ROW]
[ROW][C]103.655195352[/C][/ROW]
[ROW][C]26.2285629634167[/C][/ROW]
[ROW][C]-94.5519256755118[/C][/ROW]
[ROW][C]155.164712693864[/C][/ROW]
[ROW][C]-175.933739653212[/C][/ROW]
[ROW][C]228.336747438816[/C][/ROW]
[ROW][C]80.4956948966757[/C][/ROW]
[ROW][C]-51.5135884902922[/C][/ROW]
[ROW][C]-113.442645335542[/C][/ROW]
[ROW][C]15.3539714382504[/C][/ROW]
[ROW][C]31.3004409436352[/C][/ROW]
[ROW][C]-18.027432674673[/C][/ROW]
[ROW][C]214.995235925587[/C][/ROW]
[ROW][C]54.4906361595021[/C][/ROW]
[ROW][C]68.9874014791721[/C][/ROW]
[ROW][C]-22.1223954274419[/C][/ROW]
[ROW][C]-131.676900166465[/C][/ROW]
[ROW][C]-7.7280432931866[/C][/ROW]
[ROW][C]214.283036133537[/C][/ROW]
[ROW][C]38.5701191485059[/C][/ROW]
[ROW][C]144.46772958477[/C][/ROW]
[ROW][C]67.7098940654187[/C][/ROW]
[ROW][C]-222.205343927433[/C][/ROW]
[ROW][C]111.906781407914[/C][/ROW]
[ROW][C]64.6546605803296[/C][/ROW]
[ROW][C]32.8089156799988[/C][/ROW]
[ROW][C]-47.9831934335716[/C][/ROW]
[ROW][C]44.1667616037021[/C][/ROW]
[ROW][C]35.9174034045618[/C][/ROW]
[ROW][C]-143.698352133243[/C][/ROW]
[ROW][C]-165.895278825138[/C][/ROW]
[ROW][C]-16.9080622108322[/C][/ROW]
[ROW][C]11.3914388089788[/C][/ROW]
[ROW][C]-83.7260526992286[/C][/ROW]
[ROW][C]-351.57482526402[/C][/ROW]
[ROW][C]320.501115342758[/C][/ROW]
[ROW][C]-42.7014994101692[/C][/ROW]
[ROW][C]-83.5406657638122[/C][/ROW]
[ROW][C]-138.285670986304[/C][/ROW]
[ROW][C]-91.5452557883363[/C][/ROW]
[ROW][C]-294.509255402484[/C][/ROW]
[ROW][C]189.256285876838[/C][/ROW]
[ROW][C]238.502577349113[/C][/ROW]
[ROW][C]-24.7211247174328[/C][/ROW]
[ROW][C]116.833735324152[/C][/ROW]
[ROW][C]45.0076019004355[/C][/ROW]
[ROW][C]19.0270183613457[/C][/ROW]
[ROW][C]-32.9869507177327[/C][/ROW]
[ROW][C]-250.602330582704[/C][/ROW]
[ROW][C]94.8952500691975[/C][/ROW]
[ROW][C]-310.134824978627[/C][/ROW]
[ROW][C]-224.138741411646[/C][/ROW]
[ROW][C]-126.625776620169[/C][/ROW]
[ROW][C]-111.921097240238[/C][/ROW]
[ROW][C]-223.669230513527[/C][/ROW]
[ROW][C]295.885291945922[/C][/ROW]
[ROW][C]188.015551683817[/C][/ROW]
[ROW][C]142.929441775075[/C][/ROW]
[ROW][C]144.411590850631[/C][/ROW]
[ROW][C]-53.1667483926658[/C][/ROW]
[ROW][C]110.152305848579[/C][/ROW]
[ROW][C]60.2211532253104[/C][/ROW]
[ROW][C]140.338469150872[/C][/ROW]
[ROW][C]-325.507310696539[/C][/ROW]
[ROW][C]86.3727796438962[/C][/ROW]
[ROW][C]56.914538937207[/C][/ROW]
[ROW][C]323.367743872469[/C][/ROW]
[ROW][C]-57.6475976730262[/C][/ROW]
[ROW][C]-162.973902839116[/C][/ROW]
[ROW][C]45.3287456324661[/C][/ROW]
[ROW][C]-47.025624527736[/C][/ROW]
[ROW][C]-69.8266382416078[/C][/ROW]
[/TABLE]
Source: https://freestatistics.org/blog/index.php?pk=301176&T=2

Globally Unique Identifier (entire table): ba.freestatistics.org/blog/index.php?pk=301176&T=2

As an alternative you can also use a QR Code:  

The GUIDs for individual cells are displayed in the table below:

Estimated ARIMA Residuals
Value
-12.1497304126533
92.0087522689599
33.6545730975537
-61.6619803342512
-95.104296812611
-72.3158816258234
-110.62380826062
32.0114712569548
-147.699945468834
18.4907741743734
-63.8152630790685
-85.1024661541884
-183.617749745139
-19.798212300247
89.0122607285908
-52.878834660881
-7.86075708544465
-106.124653582932
-103.406947958638
11.0414049246597
62.6181464891516
-7.7052730266345
-72.3597521883918
-161.563127843049
-6.95050009973598
0.574252299126528
-109.813252701894
147.412137049234
-118.384555462311
84.9777857147246
-126.549211125964
-101.490382888253
103.655195352
26.2285629634167
-94.5519256755118
155.164712693864
-175.933739653212
228.336747438816
80.4956948966757
-51.5135884902922
-113.442645335542
15.3539714382504
31.3004409436352
-18.027432674673
214.995235925587
54.4906361595021
68.9874014791721
-22.1223954274419
-131.676900166465
-7.7280432931866
214.283036133537
38.5701191485059
144.46772958477
67.7098940654187
-222.205343927433
111.906781407914
64.6546605803296
32.8089156799988
-47.9831934335716
44.1667616037021
35.9174034045618
-143.698352133243
-165.895278825138
-16.9080622108322
11.3914388089788
-83.7260526992286
-351.57482526402
320.501115342758
-42.7014994101692
-83.5406657638122
-138.285670986304
-91.5452557883363
-294.509255402484
189.256285876838
238.502577349113
-24.7211247174328
116.833735324152
45.0076019004355
19.0270183613457
-32.9869507177327
-250.602330582704
94.8952500691975
-310.134824978627
-224.138741411646
-126.625776620169
-111.921097240238
-223.669230513527
295.885291945922
188.015551683817
142.929441775075
144.411590850631
-53.1667483926658
110.152305848579
60.2211532253104
140.338469150872
-325.507310696539
86.3727796438962
56.914538937207
323.367743872469
-57.6475976730262
-162.973902839116
45.3287456324661
-47.025624527736
-69.8266382416078


Parameters (Session):
par1 = Default ; par2 = 1 ; par3 = 0 ; par4 = 0 ; par5 = 12 ; par6 = White Noise ; par7 = 0.95 ;
Parameters (R input):
par1 = FALSE ; par2 = 1 ; par3 = 1 ; par4 = 1 ; par5 = 12 ; par6 = 3 ; par7 = 1 ; par8 = 2 ; par9 = 1 ;
R code (references can be found in the software module):
library(lattice)
if (par1 == 'TRUE') par1 <- TRUE
if (par1 == 'FALSE') par1 <- FALSE
par2 <- as.numeric(par2) #Box-Cox lambda transformation parameter
par3 <- as.numeric(par3) #degree of non-seasonal differencing
par4 <- as.numeric(par4) #degree of seasonal differencing
par5 <- as.numeric(par5) #seasonal period
par6 <- as.numeric(par6) #degree (p) of the non-seasonal AR(p) polynomial
par7 <- as.numeric(par7) #degree (q) of the non-seasonal MA(q) polynomial
par8 <- as.numeric(par8) #degree (P) of the seasonal AR(P) polynomial
par9 <- as.numeric(par9) #degree (Q) of the seasonal MA(Q) polynomial
armaGR <- function(arima.out, names, n){
try1 <- arima.out$coef
try2 <- sqrt(diag(arima.out$var.coef))
try.data.frame <- data.frame(matrix(NA,ncol=4,nrow=length(names)))
dimnames(try.data.frame) <- list(names,c('coef','std','tstat','pv'))
try.data.frame[,1] <- try1
for(i in 1:length(try2)) try.data.frame[which(rownames(try.data.frame)==names(try2)[i]),2] <- try2[i]
try.data.frame[,3] <- try.data.frame[,1] / try.data.frame[,2]
try.data.frame[,4] <- round((1-pt(abs(try.data.frame[,3]),df=n-(length(try2)+1)))*2,5)
vector <- rep(NA,length(names))
vector[is.na(try.data.frame[,4])] <- 0
maxi <- which.max(try.data.frame[,4])
continue <- max(try.data.frame[,4],na.rm=TRUE) > .05
vector[maxi] <- 0
list(summary=try.data.frame,next.vector=vector,continue=continue)
}
arimaSelect <- function(series, order=c(13,0,0), seasonal=list(order=c(2,0,0),period=12), include.mean=F){
nrc <- order[1]+order[3]+seasonal$order[1]+seasonal$order[3]
coeff <- matrix(NA, nrow=nrc*2, ncol=nrc)
pval <- matrix(NA, nrow=nrc*2, ncol=nrc)
mylist <- rep(list(NULL), nrc)
names <- NULL
if(order[1] > 0) names <- paste('ar',1:order[1],sep='')
if(order[3] > 0) names <- c( names , paste('ma',1:order[3],sep='') )
if(seasonal$order[1] > 0) names <- c(names, paste('sar',1:seasonal$order[1],sep=''))
if(seasonal$order[3] > 0) names <- c(names, paste('sma',1:seasonal$order[3],sep=''))
arima.out <- arima(series, order=order, seasonal=seasonal, include.mean=include.mean, method='ML')
mylist[[1]] <- arima.out
last.arma <- armaGR(arima.out, names, length(series))
mystop <- FALSE
i <- 1
coeff[i,] <- last.arma[[1]][,1]
pval [i,] <- last.arma[[1]][,4]
i <- 2
aic <- arima.out$aic
while(!mystop){
mylist[[i]] <- arima.out
arima.out <- arima(series, order=order, seasonal=seasonal, include.mean=include.mean, method='ML', fixed=last.arma$next.vector)
aic <- c(aic, arima.out$aic)
last.arma <- armaGR(arima.out, names, length(series))
mystop <- !last.arma$continue
coeff[i,] <- last.arma[[1]][,1]
pval [i,] <- last.arma[[1]][,4]
i <- i+1
}
list(coeff, pval, mylist, aic=aic)
}
arimaSelectplot <- function(arimaSelect.out,noms,choix){
noms <- names(arimaSelect.out[[3]][[1]]$coef)
coeff <- arimaSelect.out[[1]]
k <- min(which(is.na(coeff[,1])))-1
coeff <- coeff[1:k,]
pval <- arimaSelect.out[[2]][1:k,]
aic <- arimaSelect.out$aic[1:k]
coeff[coeff==0] <- NA
n <- ncol(coeff)
if(missing(choix)) choix <- k
layout(matrix(c(1,1,1,2,
3,3,3,2,
3,3,3,4,
5,6,7,7),nr=4),
widths=c(10,35,45,15),
heights=c(30,30,15,15))
couleurs <- rainbow(75)[1:50]#(50)
ticks <- pretty(coeff)
par(mar=c(1,1,3,1))
plot(aic,k:1-.5,type='o',pch=21,bg='blue',cex=2,axes=F,lty=2,xpd=NA)
points(aic[choix],k-choix+.5,pch=21,cex=4,bg=2,xpd=NA)
title('aic',line=2)
par(mar=c(3,0,0,0))
plot(0,axes=F,xlab='',ylab='',xlim=range(ticks),ylim=c(.1,1))
rect(xleft = min(ticks) + (0:49)/50*(max(ticks)-min(ticks)),
xright = min(ticks) + (1:50)/50*(max(ticks)-min(ticks)),
ytop = rep(1,50),
ybottom= rep(0,50),col=couleurs,border=NA)
axis(1,ticks)
rect(xleft=min(ticks),xright=max(ticks),ytop=1,ybottom=0)
text(mean(coeff,na.rm=T),.5,'coefficients',cex=2,font=2)
par(mar=c(1,1,3,1))
image(1:n,1:k,t(coeff[k:1,]),axes=F,col=couleurs,zlim=range(ticks))
for(i in 1:n) for(j in 1:k) if(!is.na(coeff[j,i])) {
if(pval[j,i]<.01) symb = 'green'
else if( (pval[j,i]<.05) & (pval[j,i]>=.01)) symb = 'orange'
else if( (pval[j,i]<.1) & (pval[j,i]>=.05)) symb = 'red'
else symb = 'black'
polygon(c(i+.5 ,i+.2 ,i+.5 ,i+.5),
c(k-j+0.5,k-j+0.5,k-j+0.8,k-j+0.5),
col=symb)
if(j==choix) {
rect(xleft=i-.5,
xright=i+.5,
ybottom=k-j+1.5,
ytop=k-j+.5,
lwd=4)
text(i,
k-j+1,
round(coeff[j,i],2),
cex=1.2,
font=2)
}
else{
rect(xleft=i-.5,xright=i+.5,ybottom=k-j+1.5,ytop=k-j+.5)
text(i,k-j+1,round(coeff[j,i],2),cex=1.2,font=1)
}
}
axis(3,1:n,noms)
par(mar=c(0.5,0,0,0.5))
plot(0,axes=F,xlab='',ylab='',type='n',xlim=c(0,8),ylim=c(-.2,.8))
cols <- c('green','orange','red','black')
niv <- c('0','0.01','0.05','0.1')
for(i in 0:3){
polygon(c(1+2*i ,1+2*i ,1+2*i-.5 ,1+2*i),
c(.4 ,.7 , .4 , .4),
col=cols[i+1])
text(2*i,0.5,niv[i+1],cex=1.5)
}
text(8,.5,1,cex=1.5)
text(4,0,'p-value',cex=2)
box()
residus <- arimaSelect.out[[3]][[choix]]$res
par(mar=c(1,2,4,1))
acf(residus,main='')
title('acf',line=.5)
par(mar=c(1,2,4,1))
pacf(residus,main='')
title('pacf',line=.5)
par(mar=c(2,2,4,1))
qqnorm(residus,main='')
title('qq-norm',line=.5)
qqline(residus)
residus
}
if (par2 == 0) x <- log(x)
if (par2 != 0) x <- x^par2
(selection <- arimaSelect(x, order=c(par6,par3,par7), seasonal=list(order=c(par8,par4,par9), period=par5)))
bitmap(file='test1.png')
resid <- arimaSelectplot(selection)
dev.off()
resid
bitmap(file='test2.png')
acf(resid,length(resid)/2, main='Residual Autocorrelation Function')
dev.off()
bitmap(file='test3.png')
pacf(resid,length(resid)/2, main='Residual Partial Autocorrelation Function')
dev.off()
bitmap(file='test4.png')
cpgram(resid, main='Residual Cumulative Periodogram')
dev.off()
bitmap(file='test5.png')
hist(resid, main='Residual Histogram', xlab='values of Residuals')
dev.off()
bitmap(file='test6.png')
densityplot(~resid,col='black',main='Residual Density Plot', xlab='values of Residuals')
dev.off()
bitmap(file='test7.png')
qqnorm(resid, main='Residual Normal Q-Q Plot')
qqline(resid)
dev.off()
ncols <- length(selection[[1]][1,])
nrows <- length(selection[[2]][,1])-1
load(file='createtable')
a<-table.start()
a<-table.row.start(a)
a<-table.element(a,'ARIMA Parameter Estimation and Backward Selection', ncols+1,TRUE)
a<-table.row.end(a)
a<-table.row.start(a)
a<-table.element(a,'Iteration', header=TRUE)
for (i in 1:ncols) {
a<-table.element(a,names(selection[[3]][[1]]$coef)[i],header=TRUE)
}
a<-table.row.end(a)
for (j in 1:nrows) {
a<-table.row.start(a)
mydum <- 'Estimates ('
mydum <- paste(mydum,j)
mydum <- paste(mydum,')')
a<-table.element(a,mydum, header=TRUE)
for (i in 1:ncols) {
a<-table.element(a,round(selection[[1]][j,i],4))
}
a<-table.row.end(a)
a<-table.row.start(a)
a<-table.element(a,'(p-val)', header=TRUE)
for (i in 1:ncols) {
mydum <- '('
mydum <- paste(mydum,round(selection[[2]][j,i],4),sep='')
mydum <- paste(mydum,')')
a<-table.element(a,mydum)
}
a<-table.row.end(a)
}
a<-table.end(a)
table.save(a,file='mytable.tab')
a<-table.start()
a<-table.row.start(a)
a<-table.element(a,'Estimated ARIMA Residuals', 1,TRUE)
a<-table.row.end(a)
a<-table.row.start(a)
a<-table.element(a,'Value', 1,TRUE)
a<-table.row.end(a)
for (i in (par4*par5+par3):length(resid)) {
a<-table.row.start(a)
a<-table.element(a,resid[i])
a<-table.row.end(a)
}
a<-table.end(a)
table.save(a,file='mytable1.tab')