Free Statistics

of Irreproducible Research!

Author's title

Author*The author of this computation has been verified*
R Software Modulerwasp_exponentialsmoothing.wasp
Title produced by softwareExponential Smoothing
Date of computationFri, 16 Dec 2016 17:58:05 +0100
Cite this page as followsStatistical Computations at FreeStatistics.org, Office for Research Development and Education, URL https://freestatistics.org/blog/index.php?v=date/2016/Dec/16/t1481907500zs9ssvzas5b6co5.htm/, Retrieved Fri, 01 Nov 2024 03:36:07 +0000
Statistical Computations at FreeStatistics.org, Office for Research Development and Education, URL https://freestatistics.org/blog/index.php?pk=300455, Retrieved Fri, 01 Nov 2024 03:36:07 +0000
QR Codes:

Original text written by user:
IsPrivate?No (this computation is public)
User-defined keywords
Estimated Impact92
Family? (F = Feedback message, R = changed R code, M = changed R Module, P = changed Parameters, D = changed Data)
-     [ARIMA Backward Selection] [] [2016-12-16 13:36:55] [683f400e1b95307fc738e729f07c4fce]
-    D  [ARIMA Backward Selection] [] [2016-12-16 14:17:56] [683f400e1b95307fc738e729f07c4fce]
- R  D    [ARIMA Backward Selection] [] [2016-12-16 14:51:40] [683f400e1b95307fc738e729f07c4fce]
- RM D        [Exponential Smoothing] [] [2016-12-16 16:58:05] [404ac5ee4f7301873f6a96ef36861981] [Current]
Feedback Forum

Post a new message
Dataseries X:
2931
3626
4098
3473
3606
4174
4451
3321
3678
4583
5062
5028
5592
6210
6568
5836
6424
6452
6480
2493
2738
2939
3094
2750
2874
3239
3247
2496
2363
2397
2666
2365
2870
2783
2664
1979


Summary of computational transaction
Raw Input view raw input (R code)
Raw Outputview raw output of R engine
Computing time2 seconds
R ServerBig Analytics Cloud Computing Center

\begin{tabular}{lllllllll}
\hline
Summary of computational transaction \tabularnewline
Raw Input view raw input (R code)  \tabularnewline
Raw Outputview raw output of R engine  \tabularnewline
Computing time2 seconds \tabularnewline
R ServerBig Analytics Cloud Computing Center \tabularnewline
\hline
\end{tabular}
%Source: https://freestatistics.org/blog/index.php?pk=300455&T=0

[TABLE]
[ROW]
Summary of computational transaction[/C][/ROW] [ROW]Raw Input[/C] view raw input (R code) [/C][/ROW] [ROW]Raw Output[/C]view raw output of R engine [/C][/ROW] [ROW]Computing time[/C]2 seconds[/C][/ROW] [ROW]R Server[/C]Big Analytics Cloud Computing Center[/C][/ROW] [/TABLE] Source: https://freestatistics.org/blog/index.php?pk=300455&T=0

Globally Unique Identifier (entire table): ba.freestatistics.org/blog/index.php?pk=300455&T=0

As an alternative you can also use a QR Code:  

The GUIDs for individual cells are displayed in the table below:

Summary of computational transaction
Raw Input view raw input (R code)
Raw Outputview raw output of R engine
Computing time2 seconds
R ServerBig Analytics Cloud Computing Center


Estimated Parameters of Exponential Smoothing
ParameterValue
alpha0.971163489430171
beta0.126761265970314
gammaFALSE

\begin{tabular}{lllllllll}
\hline
Estimated Parameters of Exponential Smoothing \tabularnewline
Parameter & Value \tabularnewline
alpha & 0.971163489430171 \tabularnewline
beta & 0.126761265970314 \tabularnewline
gamma & FALSE \tabularnewline
\hline
\end{tabular}
%Source: https://freestatistics.org/blog/index.php?pk=300455&T=1

[TABLE]
[ROW][C]Estimated Parameters of Exponential Smoothing[/C][/ROW]
[ROW][C]Parameter[/C][C]Value[/C][/ROW]
[ROW][C]alpha[/C][C]0.971163489430171[/C][/ROW]
[ROW][C]beta[/C][C]0.126761265970314[/C][/ROW]
[ROW][C]gamma[/C][C]FALSE[/C][/ROW]
[/TABLE]
Source: https://freestatistics.org/blog/index.php?pk=300455&T=1

Globally Unique Identifier (entire table): ba.freestatistics.org/blog/index.php?pk=300455&T=1

As an alternative you can also use a QR Code:  

The GUIDs for individual cells are displayed in the table below:

Estimated Parameters of Exponential Smoothing
ParameterValue
alpha0.971163489430171
beta0.126761265970314
gammaFALSE


Interpolation Forecasts of Exponential Smoothing
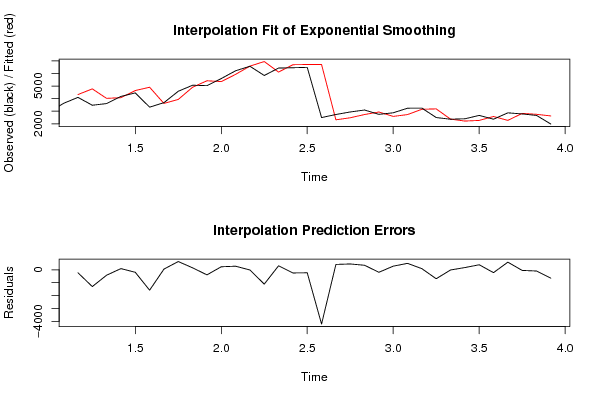
tObservedFittedResiduals
340984321-223
434734771.97792317237-1298.97792317237
536064018.09350822864-412.093508228636
641744074.7877086926699.2122913073385
744514640.25705334027-189.257053340268
833214902.27684023039-1581.27684023039
936783617.7533037984360.246696201566
1045833934.83421755377648.165782446229
1150624902.67372328157159.326276718425
1250285415.38415567699-387.384155676989
1355925349.46009652417242.539903475833
1462105925.15338108375284.846618916246
1565686576.9997062329-8.99970623290028
1658366942.36529183798-1106.36529183798
1764246105.80937635783318.190623642174
1864526691.90130199756-239.901301997565
1964806706.46145680571-226.461456805715
2024936706.19515408137-4213.19515408137
2127382315.4894047724422.510595227603
2229392478.82537967387460.174620326125
2330942735.38949756755358.610502432453
2427502937.46532577786-187.465325777859
2528742586.1341570122287.865842987798
2632392731.86525227308507.134747726919
2732473152.9735885117894.026411488217
2824963184.46139868472-688.461398684722
2923632371.27194737861-8.27194737861055
3023972217.63933143902179.360668560976
3126662268.30902045466397.690979545343
3223652579.97124741588-214.971247415875
3328702270.17405643488599.825943565119
3427832825.52026927908-42.5202692790831
3526642751.80879604831-87.8087960483058
3619792623.30497708847-644.304977088475

\begin{tabular}{lllllllll}
\hline
Interpolation Forecasts of Exponential Smoothing \tabularnewline
t & Observed & Fitted & Residuals \tabularnewline
3 & 4098 & 4321 & -223 \tabularnewline
4 & 3473 & 4771.97792317237 & -1298.97792317237 \tabularnewline
5 & 3606 & 4018.09350822864 & -412.093508228636 \tabularnewline
6 & 4174 & 4074.78770869266 & 99.2122913073385 \tabularnewline
7 & 4451 & 4640.25705334027 & -189.257053340268 \tabularnewline
8 & 3321 & 4902.27684023039 & -1581.27684023039 \tabularnewline
9 & 3678 & 3617.75330379843 & 60.246696201566 \tabularnewline
10 & 4583 & 3934.83421755377 & 648.165782446229 \tabularnewline
11 & 5062 & 4902.67372328157 & 159.326276718425 \tabularnewline
12 & 5028 & 5415.38415567699 & -387.384155676989 \tabularnewline
13 & 5592 & 5349.46009652417 & 242.539903475833 \tabularnewline
14 & 6210 & 5925.15338108375 & 284.846618916246 \tabularnewline
15 & 6568 & 6576.9997062329 & -8.99970623290028 \tabularnewline
16 & 5836 & 6942.36529183798 & -1106.36529183798 \tabularnewline
17 & 6424 & 6105.80937635783 & 318.190623642174 \tabularnewline
18 & 6452 & 6691.90130199756 & -239.901301997565 \tabularnewline
19 & 6480 & 6706.46145680571 & -226.461456805715 \tabularnewline
20 & 2493 & 6706.19515408137 & -4213.19515408137 \tabularnewline
21 & 2738 & 2315.4894047724 & 422.510595227603 \tabularnewline
22 & 2939 & 2478.82537967387 & 460.174620326125 \tabularnewline
23 & 3094 & 2735.38949756755 & 358.610502432453 \tabularnewline
24 & 2750 & 2937.46532577786 & -187.465325777859 \tabularnewline
25 & 2874 & 2586.1341570122 & 287.865842987798 \tabularnewline
26 & 3239 & 2731.86525227308 & 507.134747726919 \tabularnewline
27 & 3247 & 3152.97358851178 & 94.026411488217 \tabularnewline
28 & 2496 & 3184.46139868472 & -688.461398684722 \tabularnewline
29 & 2363 & 2371.27194737861 & -8.27194737861055 \tabularnewline
30 & 2397 & 2217.63933143902 & 179.360668560976 \tabularnewline
31 & 2666 & 2268.30902045466 & 397.690979545343 \tabularnewline
32 & 2365 & 2579.97124741588 & -214.971247415875 \tabularnewline
33 & 2870 & 2270.17405643488 & 599.825943565119 \tabularnewline
34 & 2783 & 2825.52026927908 & -42.5202692790831 \tabularnewline
35 & 2664 & 2751.80879604831 & -87.8087960483058 \tabularnewline
36 & 1979 & 2623.30497708847 & -644.304977088475 \tabularnewline
\hline
\end{tabular}
%Source: https://freestatistics.org/blog/index.php?pk=300455&T=2

[TABLE]
[ROW][C]Interpolation Forecasts of Exponential Smoothing[/C][/ROW]
[ROW][C]t[/C][C]Observed[/C][C]Fitted[/C][C]Residuals[/C][/ROW]
[ROW][C]3[/C][C]4098[/C][C]4321[/C][C]-223[/C][/ROW]
[ROW][C]4[/C][C]3473[/C][C]4771.97792317237[/C][C]-1298.97792317237[/C][/ROW]
[ROW][C]5[/C][C]3606[/C][C]4018.09350822864[/C][C]-412.093508228636[/C][/ROW]
[ROW][C]6[/C][C]4174[/C][C]4074.78770869266[/C][C]99.2122913073385[/C][/ROW]
[ROW][C]7[/C][C]4451[/C][C]4640.25705334027[/C][C]-189.257053340268[/C][/ROW]
[ROW][C]8[/C][C]3321[/C][C]4902.27684023039[/C][C]-1581.27684023039[/C][/ROW]
[ROW][C]9[/C][C]3678[/C][C]3617.75330379843[/C][C]60.246696201566[/C][/ROW]
[ROW][C]10[/C][C]4583[/C][C]3934.83421755377[/C][C]648.165782446229[/C][/ROW]
[ROW][C]11[/C][C]5062[/C][C]4902.67372328157[/C][C]159.326276718425[/C][/ROW]
[ROW][C]12[/C][C]5028[/C][C]5415.38415567699[/C][C]-387.384155676989[/C][/ROW]
[ROW][C]13[/C][C]5592[/C][C]5349.46009652417[/C][C]242.539903475833[/C][/ROW]
[ROW][C]14[/C][C]6210[/C][C]5925.15338108375[/C][C]284.846618916246[/C][/ROW]
[ROW][C]15[/C][C]6568[/C][C]6576.9997062329[/C][C]-8.99970623290028[/C][/ROW]
[ROW][C]16[/C][C]5836[/C][C]6942.36529183798[/C][C]-1106.36529183798[/C][/ROW]
[ROW][C]17[/C][C]6424[/C][C]6105.80937635783[/C][C]318.190623642174[/C][/ROW]
[ROW][C]18[/C][C]6452[/C][C]6691.90130199756[/C][C]-239.901301997565[/C][/ROW]
[ROW][C]19[/C][C]6480[/C][C]6706.46145680571[/C][C]-226.461456805715[/C][/ROW]
[ROW][C]20[/C][C]2493[/C][C]6706.19515408137[/C][C]-4213.19515408137[/C][/ROW]
[ROW][C]21[/C][C]2738[/C][C]2315.4894047724[/C][C]422.510595227603[/C][/ROW]
[ROW][C]22[/C][C]2939[/C][C]2478.82537967387[/C][C]460.174620326125[/C][/ROW]
[ROW][C]23[/C][C]3094[/C][C]2735.38949756755[/C][C]358.610502432453[/C][/ROW]
[ROW][C]24[/C][C]2750[/C][C]2937.46532577786[/C][C]-187.465325777859[/C][/ROW]
[ROW][C]25[/C][C]2874[/C][C]2586.1341570122[/C][C]287.865842987798[/C][/ROW]
[ROW][C]26[/C][C]3239[/C][C]2731.86525227308[/C][C]507.134747726919[/C][/ROW]
[ROW][C]27[/C][C]3247[/C][C]3152.97358851178[/C][C]94.026411488217[/C][/ROW]
[ROW][C]28[/C][C]2496[/C][C]3184.46139868472[/C][C]-688.461398684722[/C][/ROW]
[ROW][C]29[/C][C]2363[/C][C]2371.27194737861[/C][C]-8.27194737861055[/C][/ROW]
[ROW][C]30[/C][C]2397[/C][C]2217.63933143902[/C][C]179.360668560976[/C][/ROW]
[ROW][C]31[/C][C]2666[/C][C]2268.30902045466[/C][C]397.690979545343[/C][/ROW]
[ROW][C]32[/C][C]2365[/C][C]2579.97124741588[/C][C]-214.971247415875[/C][/ROW]
[ROW][C]33[/C][C]2870[/C][C]2270.17405643488[/C][C]599.825943565119[/C][/ROW]
[ROW][C]34[/C][C]2783[/C][C]2825.52026927908[/C][C]-42.5202692790831[/C][/ROW]
[ROW][C]35[/C][C]2664[/C][C]2751.80879604831[/C][C]-87.8087960483058[/C][/ROW]
[ROW][C]36[/C][C]1979[/C][C]2623.30497708847[/C][C]-644.304977088475[/C][/ROW]
[/TABLE]
Source: https://freestatistics.org/blog/index.php?pk=300455&T=2

Globally Unique Identifier (entire table): ba.freestatistics.org/blog/index.php?pk=300455&T=2

As an alternative you can also use a QR Code:  

The GUIDs for individual cells are displayed in the table below:

Interpolation Forecasts of Exponential Smoothing
tObservedFittedResiduals
340984321-223
434734771.97792317237-1298.97792317237
536064018.09350822864-412.093508228636
641744074.7877086926699.2122913073385
744514640.25705334027-189.257053340268
833214902.27684023039-1581.27684023039
936783617.7533037984360.246696201566
1045833934.83421755377648.165782446229
1150624902.67372328157159.326276718425
1250285415.38415567699-387.384155676989
1355925349.46009652417242.539903475833
1462105925.15338108375284.846618916246
1565686576.9997062329-8.99970623290028
1658366942.36529183798-1106.36529183798
1764246105.80937635783318.190623642174
1864526691.90130199756-239.901301997565
1964806706.46145680571-226.461456805715
2024936706.19515408137-4213.19515408137
2127382315.4894047724422.510595227603
2229392478.82537967387460.174620326125
2330942735.38949756755358.610502432453
2427502937.46532577786-187.465325777859
2528742586.1341570122287.865842987798
2632392731.86525227308507.134747726919
2732473152.9735885117894.026411488217
2824963184.46139868472-688.461398684722
2923632371.27194737861-8.27194737861055
3023972217.63933143902179.360668560976
3126662268.30902045466397.690979545343
3223652579.97124741588-214.971247415875
3328702270.17405643488599.825943565119
3427832825.52026927908-42.5202692790831
3526642751.80879604831-87.8087960483058
3619792623.30497708847-644.304977088475


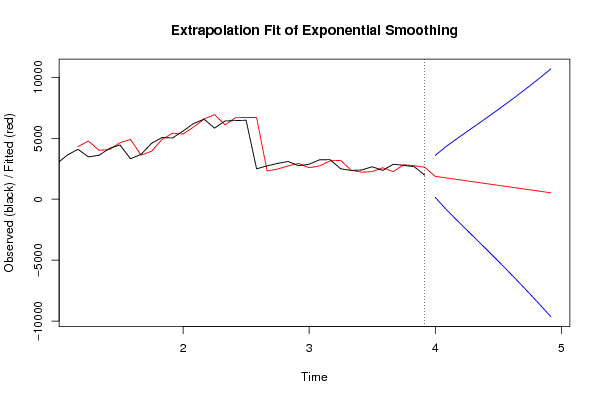
Extrapolation Forecasts of Exponential Smoothing
tForecast95% Lower Bound95% Upper Bound
371875.03463239257152.8674690367453597.2017957484
381752.48975750314-800.4019158382724305.38143084455
391629.94488261371-1673.487865146474933.37763037388
401507.40000772427-2522.735400379565537.5354158281
411384.85513283484-3368.577517522756138.28778319243
421262.31025794541-4220.568108397426745.18862428823
431139.76538305597-5083.769517879517363.30028399146
441017.22050816654-5961.053777806827995.4947941399
45894.675633277108-6854.106646609918643.45791316413
46772.130758387675-7763.923757326269308.18527410161
47649.585883498242-8691.078291621229990.2500586177
48527.041008608809-9635.8751099118510689.9571271295

\begin{tabular}{lllllllll}
\hline
Extrapolation Forecasts of Exponential Smoothing \tabularnewline
t & Forecast & 95% Lower Bound & 95% Upper Bound \tabularnewline
37 & 1875.03463239257 & 152.867469036745 & 3597.2017957484 \tabularnewline
38 & 1752.48975750314 & -800.401915838272 & 4305.38143084455 \tabularnewline
39 & 1629.94488261371 & -1673.48786514647 & 4933.37763037388 \tabularnewline
40 & 1507.40000772427 & -2522.73540037956 & 5537.5354158281 \tabularnewline
41 & 1384.85513283484 & -3368.57751752275 & 6138.28778319243 \tabularnewline
42 & 1262.31025794541 & -4220.56810839742 & 6745.18862428823 \tabularnewline
43 & 1139.76538305597 & -5083.76951787951 & 7363.30028399146 \tabularnewline
44 & 1017.22050816654 & -5961.05377780682 & 7995.4947941399 \tabularnewline
45 & 894.675633277108 & -6854.10664660991 & 8643.45791316413 \tabularnewline
46 & 772.130758387675 & -7763.92375732626 & 9308.18527410161 \tabularnewline
47 & 649.585883498242 & -8691.07829162122 & 9990.2500586177 \tabularnewline
48 & 527.041008608809 & -9635.87510991185 & 10689.9571271295 \tabularnewline
\hline
\end{tabular}
%Source: https://freestatistics.org/blog/index.php?pk=300455&T=3

[TABLE]
[ROW][C]Extrapolation Forecasts of Exponential Smoothing[/C][/ROW]
[ROW][C]t[/C][C]Forecast[/C][C]95% Lower Bound[/C][C]95% Upper Bound[/C][/ROW]
[ROW][C]37[/C][C]1875.03463239257[/C][C]152.867469036745[/C][C]3597.2017957484[/C][/ROW]
[ROW][C]38[/C][C]1752.48975750314[/C][C]-800.401915838272[/C][C]4305.38143084455[/C][/ROW]
[ROW][C]39[/C][C]1629.94488261371[/C][C]-1673.48786514647[/C][C]4933.37763037388[/C][/ROW]
[ROW][C]40[/C][C]1507.40000772427[/C][C]-2522.73540037956[/C][C]5537.5354158281[/C][/ROW]
[ROW][C]41[/C][C]1384.85513283484[/C][C]-3368.57751752275[/C][C]6138.28778319243[/C][/ROW]
[ROW][C]42[/C][C]1262.31025794541[/C][C]-4220.56810839742[/C][C]6745.18862428823[/C][/ROW]
[ROW][C]43[/C][C]1139.76538305597[/C][C]-5083.76951787951[/C][C]7363.30028399146[/C][/ROW]
[ROW][C]44[/C][C]1017.22050816654[/C][C]-5961.05377780682[/C][C]7995.4947941399[/C][/ROW]
[ROW][C]45[/C][C]894.675633277108[/C][C]-6854.10664660991[/C][C]8643.45791316413[/C][/ROW]
[ROW][C]46[/C][C]772.130758387675[/C][C]-7763.92375732626[/C][C]9308.18527410161[/C][/ROW]
[ROW][C]47[/C][C]649.585883498242[/C][C]-8691.07829162122[/C][C]9990.2500586177[/C][/ROW]
[ROW][C]48[/C][C]527.041008608809[/C][C]-9635.87510991185[/C][C]10689.9571271295[/C][/ROW]
[/TABLE]
Source: https://freestatistics.org/blog/index.php?pk=300455&T=3

Globally Unique Identifier (entire table): ba.freestatistics.org/blog/index.php?pk=300455&T=3

As an alternative you can also use a QR Code:  

The GUIDs for individual cells are displayed in the table below:

Extrapolation Forecasts of Exponential Smoothing
tForecast95% Lower Bound95% Upper Bound
371875.03463239257152.8674690367453597.2017957484
381752.48975750314-800.4019158382724305.38143084455
391629.94488261371-1673.487865146474933.37763037388
401507.40000772427-2522.735400379565537.5354158281
411384.85513283484-3368.577517522756138.28778319243
421262.31025794541-4220.568108397426745.18862428823
431139.76538305597-5083.769517879517363.30028399146
441017.22050816654-5961.053777806827995.4947941399
45894.675633277108-6854.106646609918643.45791316413
46772.130758387675-7763.923757326269308.18527410161
47649.585883498242-8691.078291621229990.2500586177
48527.041008608809-9635.8751099118510689.9571271295


Parameters (Session):
par1 = FALSE ; par2 = 1 ; par3 = 2 ; par4 = 0 ; par5 = 1 ; par6 = 3 ; par7 = 1 ; par8 = 2 ; par9 = 0 ;
Parameters (R input):
par1 = 12 ; par2 = Double ; par3 = additive ; par4 = 12 ;
R code (references can be found in the software module):
par1 <- as.numeric(par1)
par4 <- as.numeric(par4)
if (par2 == 'Single') K <- 1
if (par2 == 'Double') K <- 2
if (par2 == 'Triple') K <- par1
nx <- length(x)
nxmK <- nx - K
x <- ts(x, frequency = par1)
if (par2 == 'Single') fit <- HoltWinters(x, gamma=F, beta=F)
if (par2 == 'Double') fit <- HoltWinters(x, gamma=F)
if (par2 == 'Triple') fit <- HoltWinters(x, seasonal=par3)
fit
myresid <- x - fit$fitted[,'xhat']
bitmap(file='test1.png')
op <- par(mfrow=c(2,1))
plot(fit,ylab='Observed (black) / Fitted (red)',main='Interpolation Fit of Exponential Smoothing')
plot(myresid,ylab='Residuals',main='Interpolation Prediction Errors')
par(op)
dev.off()
bitmap(file='test2.png')
p <- predict(fit, par4, prediction.interval=TRUE)
np <- length(p[,1])
plot(fit,p,ylab='Observed (black) / Fitted (red)',main='Extrapolation Fit of Exponential Smoothing')
dev.off()
bitmap(file='test3.png')
op <- par(mfrow = c(2,2))
acf(as.numeric(myresid),lag.max = nx/2,main='Residual ACF')
spectrum(myresid,main='Residals Periodogram')
cpgram(myresid,main='Residal Cumulative Periodogram')
qqnorm(myresid,main='Residual Normal QQ Plot')
qqline(myresid)
par(op)
dev.off()
load(file='createtable')
a<-table.start()
a<-table.row.start(a)
a<-table.element(a,'Estimated Parameters of Exponential Smoothing',2,TRUE)
a<-table.row.end(a)
a<-table.row.start(a)
a<-table.element(a,'Parameter',header=TRUE)
a<-table.element(a,'Value',header=TRUE)
a<-table.row.end(a)
a<-table.row.start(a)
a<-table.element(a,'alpha',header=TRUE)
a<-table.element(a,fit$alpha)
a<-table.row.end(a)
a<-table.row.start(a)
a<-table.element(a,'beta',header=TRUE)
a<-table.element(a,fit$beta)
a<-table.row.end(a)
a<-table.row.start(a)
a<-table.element(a,'gamma',header=TRUE)
a<-table.element(a,fit$gamma)
a<-table.row.end(a)
a<-table.end(a)
table.save(a,file='mytable.tab')
a<-table.start()
a<-table.row.start(a)
a<-table.element(a,'Interpolation Forecasts of Exponential Smoothing',4,TRUE)
a<-table.row.end(a)
a<-table.row.start(a)
a<-table.element(a,'t',header=TRUE)
a<-table.element(a,'Observed',header=TRUE)
a<-table.element(a,'Fitted',header=TRUE)
a<-table.element(a,'Residuals',header=TRUE)
a<-table.row.end(a)
for (i in 1:nxmK) {
a<-table.row.start(a)
a<-table.element(a,i+K,header=TRUE)
a<-table.element(a,x[i+K])
a<-table.element(a,fit$fitted[i,'xhat'])
a<-table.element(a,myresid[i])
a<-table.row.end(a)
}
a<-table.end(a)
table.save(a,file='mytable1.tab')
a<-table.start()
a<-table.row.start(a)
a<-table.element(a,'Extrapolation Forecasts of Exponential Smoothing',4,TRUE)
a<-table.row.end(a)
a<-table.row.start(a)
a<-table.element(a,'t',header=TRUE)
a<-table.element(a,'Forecast',header=TRUE)
a<-table.element(a,'95% Lower Bound',header=TRUE)
a<-table.element(a,'95% Upper Bound',header=TRUE)
a<-table.row.end(a)
for (i in 1:np) {
a<-table.row.start(a)
a<-table.element(a,nx+i,header=TRUE)
a<-table.element(a,p[i,'fit'])
a<-table.element(a,p[i,'lwr'])
a<-table.element(a,p[i,'upr'])
a<-table.row.end(a)
}
a<-table.end(a)
table.save(a,file='mytable2.tab')