Free Statistics

of Irreproducible Research!

Author's title

Author*The author of this computation has been verified*
R Software Modulerwasp_autocorrelation.wasp
Title produced by software(Partial) Autocorrelation Function
Date of computationTue, 21 Dec 2010 20:22:04 +0000
Cite this page as followsStatistical Computations at FreeStatistics.org, Office for Research Development and Education, URL https://freestatistics.org/blog/index.php?v=date/2010/Dec/21/t1292962782idi24zmiwsnivkv.htm/, Retrieved Sat, 18 May 2024 02:14:34 +0000
Statistical Computations at FreeStatistics.org, Office for Research Development and Education, URL https://freestatistics.org/blog/index.php?pk=113938, Retrieved Sat, 18 May 2024 02:14:34 +0000
QR Codes:

Original text written by user:
IsPrivate?No (this computation is public)
User-defined keywords
Estimated Impact149
Family? (F = Feedback message, R = changed R code, M = changed R Module, P = changed Parameters, D = changed Data)
-     [Univariate Data Series] [] [2008-12-14 11:54:22] [d2d412c7f4d35ffbf5ee5ee89db327d4]
- RMP   [(Partial) Autocorrelation Function] [] [2010-12-07 13:42:19] [dd4fe494cff2ee46c12b15bdc7b848ca]
-    D    [(Partial) Autocorrelation Function] [] [2010-12-21 20:16:07] [dd4fe494cff2ee46c12b15bdc7b848ca]
-   P         [(Partial) Autocorrelation Function] [] [2010-12-21 20:22:04] [6c31f786e793d35ef3a03978bc5de774] [Current]
Feedback Forum

Post a new message
Dataseries X:
320
324
343
295
301
367
196
182
342
361
333
330
345
323
365
323
316
358
235
169
430
409
407
341
326
374
364
349
300
385
304
196
443
414
325
388
356
386
444
387
327
448
225
182
460
411
342
361
377
331
428
340
352
461
221
198
422
329
320
375
364
351
380
319
322
386
221
187
343
342
365
313
356
337
389
326
343
357
220
218
391
425
332
298
360
336
325
393
301
426
265
210
429
440
357
431
442
422
544
420
396
482
261
211
448
468
464
425


Summary of computational transaction
Raw Inputview raw input (R code)
Raw Outputview raw output of R engine
Computing time2 seconds
R Server'RServer@AstonUniversity' @ vre.aston.ac.uk

\begin{tabular}{lllllllll}
\hline
Summary of computational transaction \tabularnewline
Raw Input & view raw input (R code)  \tabularnewline
Raw Output & view raw output of R engine  \tabularnewline
Computing time & 2 seconds \tabularnewline
R Server & 'RServer@AstonUniversity' @ vre.aston.ac.uk \tabularnewline
\hline
\end{tabular}
%Source: https://freestatistics.org/blog/index.php?pk=113938&T=0

[TABLE]
[ROW][C]Summary of computational transaction[/C][/ROW]
[ROW][C]Raw Input[/C][C]view raw input (R code) [/C][/ROW]
[ROW][C]Raw Output[/C][C]view raw output of R engine [/C][/ROW]
[ROW][C]Computing time[/C][C]2 seconds[/C][/ROW]
[ROW][C]R Server[/C][C]'RServer@AstonUniversity' @ vre.aston.ac.uk[/C][/ROW]
[/TABLE]
Source: https://freestatistics.org/blog/index.php?pk=113938&T=0

Globally Unique Identifier (entire table): ba.freestatistics.org/blog/index.php?pk=113938&T=0

As an alternative you can also use a QR Code:  

The GUIDs for individual cells are displayed in the table below:

Summary of computational transaction
Raw Inputview raw input (R code)
Raw Outputview raw output of R engine
Computing time2 seconds
R Server'RServer@AstonUniversity' @ vre.aston.ac.uk


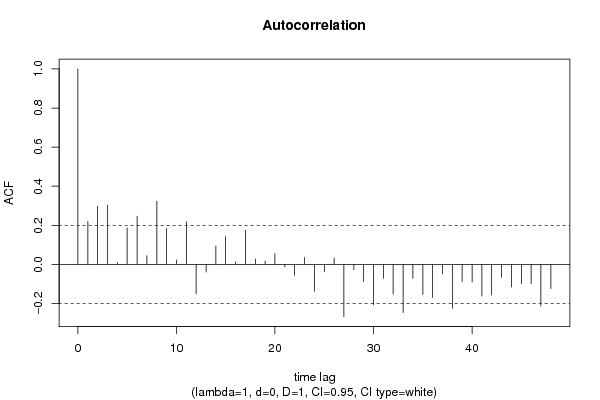
Autocorrelation Function
Time lag kACF(k)T-STATP-value
10.2201022.15660.016769
20.2980882.92060.002177
30.302582.96470.001911
40.0092030.09020.464168
50.1868531.83080.035118
60.2469592.41970.008708
70.044780.43880.330912
80.3232033.16670.001033
90.1831021.7940.037979
100.022410.21960.413335
110.2191762.14750.017137
12-0.150688-1.47640.07155
13-0.039245-0.38450.350723
140.0940350.92140.179588
150.1432181.40320.081885
160.0138280.13550.446256
170.1747261.7120.045066
180.0282210.27650.391376
190.0180120.17650.430146
200.0543350.53240.29785
21-0.013283-0.13010.448361
22-0.056077-0.54940.291989
230.0351780.34470.365545
24-0.137102-1.34330.091168
25-0.037979-0.37210.355315
260.0326620.320.374822
27-0.267305-2.6190.005124
28-0.027206-0.26660.395188
29-0.087305-0.85540.197228
30-0.20639-2.02220.022969
31-0.070815-0.69380.244728
32-0.151813-1.48750.070086
33-0.245923-2.40950.008939
34-0.071327-0.69890.243165
35-0.153525-1.50420.067902
36-0.169496-1.66070.050017
37-0.049335-0.48340.314963
38-0.225043-2.2050.014922
39-0.087937-0.86160.195526
40-0.090597-0.88770.188469
41-0.161647-1.58380.058262
42-0.156021-1.52870.064815
43-0.066339-0.650.258627
44-0.115351-1.13020.130603
45-0.098853-0.96860.1676
46-0.097618-0.95650.170621
47-0.212346-2.08060.020069
48-0.123454-1.20960.114703

\begin{tabular}{lllllllll}
\hline
Autocorrelation Function \tabularnewline
Time lag k & ACF(k) & T-STAT & P-value \tabularnewline
1 & 0.220102 & 2.1566 & 0.016769 \tabularnewline
2 & 0.298088 & 2.9206 & 0.002177 \tabularnewline
3 & 0.30258 & 2.9647 & 0.001911 \tabularnewline
4 & 0.009203 & 0.0902 & 0.464168 \tabularnewline
5 & 0.186853 & 1.8308 & 0.035118 \tabularnewline
6 & 0.246959 & 2.4197 & 0.008708 \tabularnewline
7 & 0.04478 & 0.4388 & 0.330912 \tabularnewline
8 & 0.323203 & 3.1667 & 0.001033 \tabularnewline
9 & 0.183102 & 1.794 & 0.037979 \tabularnewline
10 & 0.02241 & 0.2196 & 0.413335 \tabularnewline
11 & 0.219176 & 2.1475 & 0.017137 \tabularnewline
12 & -0.150688 & -1.4764 & 0.07155 \tabularnewline
13 & -0.039245 & -0.3845 & 0.350723 \tabularnewline
14 & 0.094035 & 0.9214 & 0.179588 \tabularnewline
15 & 0.143218 & 1.4032 & 0.081885 \tabularnewline
16 & 0.013828 & 0.1355 & 0.446256 \tabularnewline
17 & 0.174726 & 1.712 & 0.045066 \tabularnewline
18 & 0.028221 & 0.2765 & 0.391376 \tabularnewline
19 & 0.018012 & 0.1765 & 0.430146 \tabularnewline
20 & 0.054335 & 0.5324 & 0.29785 \tabularnewline
21 & -0.013283 & -0.1301 & 0.448361 \tabularnewline
22 & -0.056077 & -0.5494 & 0.291989 \tabularnewline
23 & 0.035178 & 0.3447 & 0.365545 \tabularnewline
24 & -0.137102 & -1.3433 & 0.091168 \tabularnewline
25 & -0.037979 & -0.3721 & 0.355315 \tabularnewline
26 & 0.032662 & 0.32 & 0.374822 \tabularnewline
27 & -0.267305 & -2.619 & 0.005124 \tabularnewline
28 & -0.027206 & -0.2666 & 0.395188 \tabularnewline
29 & -0.087305 & -0.8554 & 0.197228 \tabularnewline
30 & -0.20639 & -2.0222 & 0.022969 \tabularnewline
31 & -0.070815 & -0.6938 & 0.244728 \tabularnewline
32 & -0.151813 & -1.4875 & 0.070086 \tabularnewline
33 & -0.245923 & -2.4095 & 0.008939 \tabularnewline
34 & -0.071327 & -0.6989 & 0.243165 \tabularnewline
35 & -0.153525 & -1.5042 & 0.067902 \tabularnewline
36 & -0.169496 & -1.6607 & 0.050017 \tabularnewline
37 & -0.049335 & -0.4834 & 0.314963 \tabularnewline
38 & -0.225043 & -2.205 & 0.014922 \tabularnewline
39 & -0.087937 & -0.8616 & 0.195526 \tabularnewline
40 & -0.090597 & -0.8877 & 0.188469 \tabularnewline
41 & -0.161647 & -1.5838 & 0.058262 \tabularnewline
42 & -0.156021 & -1.5287 & 0.064815 \tabularnewline
43 & -0.066339 & -0.65 & 0.258627 \tabularnewline
44 & -0.115351 & -1.1302 & 0.130603 \tabularnewline
45 & -0.098853 & -0.9686 & 0.1676 \tabularnewline
46 & -0.097618 & -0.9565 & 0.170621 \tabularnewline
47 & -0.212346 & -2.0806 & 0.020069 \tabularnewline
48 & -0.123454 & -1.2096 & 0.114703 \tabularnewline
\hline
\end{tabular}
%Source: https://freestatistics.org/blog/index.php?pk=113938&T=1

[TABLE]
[ROW][C]Autocorrelation Function[/C][/ROW]
[ROW][C]Time lag k[/C][C]ACF(k)[/C][C]T-STAT[/C][C]P-value[/C][/ROW]
[ROW][C]1[/C][C]0.220102[/C][C]2.1566[/C][C]0.016769[/C][/ROW]
[ROW][C]2[/C][C]0.298088[/C][C]2.9206[/C][C]0.002177[/C][/ROW]
[ROW][C]3[/C][C]0.30258[/C][C]2.9647[/C][C]0.001911[/C][/ROW]
[ROW][C]4[/C][C]0.009203[/C][C]0.0902[/C][C]0.464168[/C][/ROW]
[ROW][C]5[/C][C]0.186853[/C][C]1.8308[/C][C]0.035118[/C][/ROW]
[ROW][C]6[/C][C]0.246959[/C][C]2.4197[/C][C]0.008708[/C][/ROW]
[ROW][C]7[/C][C]0.04478[/C][C]0.4388[/C][C]0.330912[/C][/ROW]
[ROW][C]8[/C][C]0.323203[/C][C]3.1667[/C][C]0.001033[/C][/ROW]
[ROW][C]9[/C][C]0.183102[/C][C]1.794[/C][C]0.037979[/C][/ROW]
[ROW][C]10[/C][C]0.02241[/C][C]0.2196[/C][C]0.413335[/C][/ROW]
[ROW][C]11[/C][C]0.219176[/C][C]2.1475[/C][C]0.017137[/C][/ROW]
[ROW][C]12[/C][C]-0.150688[/C][C]-1.4764[/C][C]0.07155[/C][/ROW]
[ROW][C]13[/C][C]-0.039245[/C][C]-0.3845[/C][C]0.350723[/C][/ROW]
[ROW][C]14[/C][C]0.094035[/C][C]0.9214[/C][C]0.179588[/C][/ROW]
[ROW][C]15[/C][C]0.143218[/C][C]1.4032[/C][C]0.081885[/C][/ROW]
[ROW][C]16[/C][C]0.013828[/C][C]0.1355[/C][C]0.446256[/C][/ROW]
[ROW][C]17[/C][C]0.174726[/C][C]1.712[/C][C]0.045066[/C][/ROW]
[ROW][C]18[/C][C]0.028221[/C][C]0.2765[/C][C]0.391376[/C][/ROW]
[ROW][C]19[/C][C]0.018012[/C][C]0.1765[/C][C]0.430146[/C][/ROW]
[ROW][C]20[/C][C]0.054335[/C][C]0.5324[/C][C]0.29785[/C][/ROW]
[ROW][C]21[/C][C]-0.013283[/C][C]-0.1301[/C][C]0.448361[/C][/ROW]
[ROW][C]22[/C][C]-0.056077[/C][C]-0.5494[/C][C]0.291989[/C][/ROW]
[ROW][C]23[/C][C]0.035178[/C][C]0.3447[/C][C]0.365545[/C][/ROW]
[ROW][C]24[/C][C]-0.137102[/C][C]-1.3433[/C][C]0.091168[/C][/ROW]
[ROW][C]25[/C][C]-0.037979[/C][C]-0.3721[/C][C]0.355315[/C][/ROW]
[ROW][C]26[/C][C]0.032662[/C][C]0.32[/C][C]0.374822[/C][/ROW]
[ROW][C]27[/C][C]-0.267305[/C][C]-2.619[/C][C]0.005124[/C][/ROW]
[ROW][C]28[/C][C]-0.027206[/C][C]-0.2666[/C][C]0.395188[/C][/ROW]
[ROW][C]29[/C][C]-0.087305[/C][C]-0.8554[/C][C]0.197228[/C][/ROW]
[ROW][C]30[/C][C]-0.20639[/C][C]-2.0222[/C][C]0.022969[/C][/ROW]
[ROW][C]31[/C][C]-0.070815[/C][C]-0.6938[/C][C]0.244728[/C][/ROW]
[ROW][C]32[/C][C]-0.151813[/C][C]-1.4875[/C][C]0.070086[/C][/ROW]
[ROW][C]33[/C][C]-0.245923[/C][C]-2.4095[/C][C]0.008939[/C][/ROW]
[ROW][C]34[/C][C]-0.071327[/C][C]-0.6989[/C][C]0.243165[/C][/ROW]
[ROW][C]35[/C][C]-0.153525[/C][C]-1.5042[/C][C]0.067902[/C][/ROW]
[ROW][C]36[/C][C]-0.169496[/C][C]-1.6607[/C][C]0.050017[/C][/ROW]
[ROW][C]37[/C][C]-0.049335[/C][C]-0.4834[/C][C]0.314963[/C][/ROW]
[ROW][C]38[/C][C]-0.225043[/C][C]-2.205[/C][C]0.014922[/C][/ROW]
[ROW][C]39[/C][C]-0.087937[/C][C]-0.8616[/C][C]0.195526[/C][/ROW]
[ROW][C]40[/C][C]-0.090597[/C][C]-0.8877[/C][C]0.188469[/C][/ROW]
[ROW][C]41[/C][C]-0.161647[/C][C]-1.5838[/C][C]0.058262[/C][/ROW]
[ROW][C]42[/C][C]-0.156021[/C][C]-1.5287[/C][C]0.064815[/C][/ROW]
[ROW][C]43[/C][C]-0.066339[/C][C]-0.65[/C][C]0.258627[/C][/ROW]
[ROW][C]44[/C][C]-0.115351[/C][C]-1.1302[/C][C]0.130603[/C][/ROW]
[ROW][C]45[/C][C]-0.098853[/C][C]-0.9686[/C][C]0.1676[/C][/ROW]
[ROW][C]46[/C][C]-0.097618[/C][C]-0.9565[/C][C]0.170621[/C][/ROW]
[ROW][C]47[/C][C]-0.212346[/C][C]-2.0806[/C][C]0.020069[/C][/ROW]
[ROW][C]48[/C][C]-0.123454[/C][C]-1.2096[/C][C]0.114703[/C][/ROW]
[/TABLE]
Source: https://freestatistics.org/blog/index.php?pk=113938&T=1

Globally Unique Identifier (entire table): ba.freestatistics.org/blog/index.php?pk=113938&T=1

As an alternative you can also use a QR Code:  

The GUIDs for individual cells are displayed in the table below:

Autocorrelation Function
Time lag kACF(k)T-STATP-value
10.2201022.15660.016769
20.2980882.92060.002177
30.302582.96470.001911
40.0092030.09020.464168
50.1868531.83080.035118
60.2469592.41970.008708
70.044780.43880.330912
80.3232033.16670.001033
90.1831021.7940.037979
100.022410.21960.413335
110.2191762.14750.017137
12-0.150688-1.47640.07155
13-0.039245-0.38450.350723
140.0940350.92140.179588
150.1432181.40320.081885
160.0138280.13550.446256
170.1747261.7120.045066
180.0282210.27650.391376
190.0180120.17650.430146
200.0543350.53240.29785
21-0.013283-0.13010.448361
22-0.056077-0.54940.291989
230.0351780.34470.365545
24-0.137102-1.34330.091168
25-0.037979-0.37210.355315
260.0326620.320.374822
27-0.267305-2.6190.005124
28-0.027206-0.26660.395188
29-0.087305-0.85540.197228
30-0.20639-2.02220.022969
31-0.070815-0.69380.244728
32-0.151813-1.48750.070086
33-0.245923-2.40950.008939
34-0.071327-0.69890.243165
35-0.153525-1.50420.067902
36-0.169496-1.66070.050017
37-0.049335-0.48340.314963
38-0.225043-2.2050.014922
39-0.087937-0.86160.195526
40-0.090597-0.88770.188469
41-0.161647-1.58380.058262
42-0.156021-1.52870.064815
43-0.066339-0.650.258627
44-0.115351-1.13020.130603
45-0.098853-0.96860.1676
46-0.097618-0.95650.170621
47-0.212346-2.08060.020069
48-0.123454-1.20960.114703


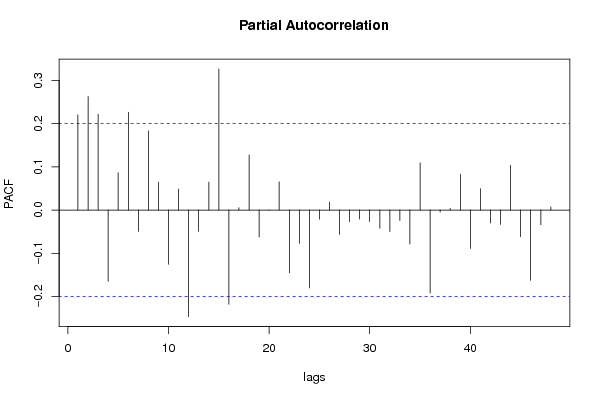
Partial Autocorrelation Function
Time lag kPACF(k)T-STATP-value
10.2201022.15660.016769
20.2623522.57050.005846
30.2216982.17220.016152
4-0.164502-1.61180.055146
50.0863880.84640.199711
60.2262192.21650.01451
7-0.049305-0.48310.315065
80.1827971.7910.038219
90.0644610.63160.264579
10-0.125236-1.22710.1114
110.0487240.47740.317081
12-0.246457-2.41480.008819
13-0.049205-0.48210.315414
140.0646140.63310.264092
150.3262823.19690.000941
16-0.218009-2.1360.01761
170.0055740.05460.478281
180.1270381.24470.108134
19-0.062105-0.60850.272145
20-0.000357-0.00350.498608
210.0651760.63860.262303
22-0.144918-1.41990.079437
23-0.076694-0.75140.227111
24-0.180026-1.76390.040466
25-0.020962-0.20540.418853
260.0183660.17990.428786
27-0.056312-0.55170.291202
28-0.026971-0.26430.396074
29-0.020724-0.20310.419762
30-0.026708-0.26170.397064
31-0.042058-0.41210.340599
32-0.049784-0.48780.313407
33-0.024366-0.23870.405908
34-0.07839-0.76810.222168
350.1091571.06950.143759
36-0.192058-1.88180.031448
37-0.004416-0.04330.482788
380.0043380.04250.483092
390.0827430.81070.209769
40-0.088826-0.87030.193149
410.049260.48260.315224
42-0.030007-0.2940.384695
43-0.033134-0.32460.373079
440.1036231.01530.15626
45-0.061468-0.60230.274209
46-0.162404-1.59120.057423
47-0.033691-0.33010.37102
480.0072020.07060.471947

\begin{tabular}{lllllllll}
\hline
Partial Autocorrelation Function \tabularnewline
Time lag k & PACF(k) & T-STAT & P-value \tabularnewline
1 & 0.220102 & 2.1566 & 0.016769 \tabularnewline
2 & 0.262352 & 2.5705 & 0.005846 \tabularnewline
3 & 0.221698 & 2.1722 & 0.016152 \tabularnewline
4 & -0.164502 & -1.6118 & 0.055146 \tabularnewline
5 & 0.086388 & 0.8464 & 0.199711 \tabularnewline
6 & 0.226219 & 2.2165 & 0.01451 \tabularnewline
7 & -0.049305 & -0.4831 & 0.315065 \tabularnewline
8 & 0.182797 & 1.791 & 0.038219 \tabularnewline
9 & 0.064461 & 0.6316 & 0.264579 \tabularnewline
10 & -0.125236 & -1.2271 & 0.1114 \tabularnewline
11 & 0.048724 & 0.4774 & 0.317081 \tabularnewline
12 & -0.246457 & -2.4148 & 0.008819 \tabularnewline
13 & -0.049205 & -0.4821 & 0.315414 \tabularnewline
14 & 0.064614 & 0.6331 & 0.264092 \tabularnewline
15 & 0.326282 & 3.1969 & 0.000941 \tabularnewline
16 & -0.218009 & -2.136 & 0.01761 \tabularnewline
17 & 0.005574 & 0.0546 & 0.478281 \tabularnewline
18 & 0.127038 & 1.2447 & 0.108134 \tabularnewline
19 & -0.062105 & -0.6085 & 0.272145 \tabularnewline
20 & -0.000357 & -0.0035 & 0.498608 \tabularnewline
21 & 0.065176 & 0.6386 & 0.262303 \tabularnewline
22 & -0.144918 & -1.4199 & 0.079437 \tabularnewline
23 & -0.076694 & -0.7514 & 0.227111 \tabularnewline
24 & -0.180026 & -1.7639 & 0.040466 \tabularnewline
25 & -0.020962 & -0.2054 & 0.418853 \tabularnewline
26 & 0.018366 & 0.1799 & 0.428786 \tabularnewline
27 & -0.056312 & -0.5517 & 0.291202 \tabularnewline
28 & -0.026971 & -0.2643 & 0.396074 \tabularnewline
29 & -0.020724 & -0.2031 & 0.419762 \tabularnewline
30 & -0.026708 & -0.2617 & 0.397064 \tabularnewline
31 & -0.042058 & -0.4121 & 0.340599 \tabularnewline
32 & -0.049784 & -0.4878 & 0.313407 \tabularnewline
33 & -0.024366 & -0.2387 & 0.405908 \tabularnewline
34 & -0.07839 & -0.7681 & 0.222168 \tabularnewline
35 & 0.109157 & 1.0695 & 0.143759 \tabularnewline
36 & -0.192058 & -1.8818 & 0.031448 \tabularnewline
37 & -0.004416 & -0.0433 & 0.482788 \tabularnewline
38 & 0.004338 & 0.0425 & 0.483092 \tabularnewline
39 & 0.082743 & 0.8107 & 0.209769 \tabularnewline
40 & -0.088826 & -0.8703 & 0.193149 \tabularnewline
41 & 0.04926 & 0.4826 & 0.315224 \tabularnewline
42 & -0.030007 & -0.294 & 0.384695 \tabularnewline
43 & -0.033134 & -0.3246 & 0.373079 \tabularnewline
44 & 0.103623 & 1.0153 & 0.15626 \tabularnewline
45 & -0.061468 & -0.6023 & 0.274209 \tabularnewline
46 & -0.162404 & -1.5912 & 0.057423 \tabularnewline
47 & -0.033691 & -0.3301 & 0.37102 \tabularnewline
48 & 0.007202 & 0.0706 & 0.471947 \tabularnewline
\hline
\end{tabular}
%Source: https://freestatistics.org/blog/index.php?pk=113938&T=2

[TABLE]
[ROW][C]Partial Autocorrelation Function[/C][/ROW]
[ROW][C]Time lag k[/C][C]PACF(k)[/C][C]T-STAT[/C][C]P-value[/C][/ROW]
[ROW][C]1[/C][C]0.220102[/C][C]2.1566[/C][C]0.016769[/C][/ROW]
[ROW][C]2[/C][C]0.262352[/C][C]2.5705[/C][C]0.005846[/C][/ROW]
[ROW][C]3[/C][C]0.221698[/C][C]2.1722[/C][C]0.016152[/C][/ROW]
[ROW][C]4[/C][C]-0.164502[/C][C]-1.6118[/C][C]0.055146[/C][/ROW]
[ROW][C]5[/C][C]0.086388[/C][C]0.8464[/C][C]0.199711[/C][/ROW]
[ROW][C]6[/C][C]0.226219[/C][C]2.2165[/C][C]0.01451[/C][/ROW]
[ROW][C]7[/C][C]-0.049305[/C][C]-0.4831[/C][C]0.315065[/C][/ROW]
[ROW][C]8[/C][C]0.182797[/C][C]1.791[/C][C]0.038219[/C][/ROW]
[ROW][C]9[/C][C]0.064461[/C][C]0.6316[/C][C]0.264579[/C][/ROW]
[ROW][C]10[/C][C]-0.125236[/C][C]-1.2271[/C][C]0.1114[/C][/ROW]
[ROW][C]11[/C][C]0.048724[/C][C]0.4774[/C][C]0.317081[/C][/ROW]
[ROW][C]12[/C][C]-0.246457[/C][C]-2.4148[/C][C]0.008819[/C][/ROW]
[ROW][C]13[/C][C]-0.049205[/C][C]-0.4821[/C][C]0.315414[/C][/ROW]
[ROW][C]14[/C][C]0.064614[/C][C]0.6331[/C][C]0.264092[/C][/ROW]
[ROW][C]15[/C][C]0.326282[/C][C]3.1969[/C][C]0.000941[/C][/ROW]
[ROW][C]16[/C][C]-0.218009[/C][C]-2.136[/C][C]0.01761[/C][/ROW]
[ROW][C]17[/C][C]0.005574[/C][C]0.0546[/C][C]0.478281[/C][/ROW]
[ROW][C]18[/C][C]0.127038[/C][C]1.2447[/C][C]0.108134[/C][/ROW]
[ROW][C]19[/C][C]-0.062105[/C][C]-0.6085[/C][C]0.272145[/C][/ROW]
[ROW][C]20[/C][C]-0.000357[/C][C]-0.0035[/C][C]0.498608[/C][/ROW]
[ROW][C]21[/C][C]0.065176[/C][C]0.6386[/C][C]0.262303[/C][/ROW]
[ROW][C]22[/C][C]-0.144918[/C][C]-1.4199[/C][C]0.079437[/C][/ROW]
[ROW][C]23[/C][C]-0.076694[/C][C]-0.7514[/C][C]0.227111[/C][/ROW]
[ROW][C]24[/C][C]-0.180026[/C][C]-1.7639[/C][C]0.040466[/C][/ROW]
[ROW][C]25[/C][C]-0.020962[/C][C]-0.2054[/C][C]0.418853[/C][/ROW]
[ROW][C]26[/C][C]0.018366[/C][C]0.1799[/C][C]0.428786[/C][/ROW]
[ROW][C]27[/C][C]-0.056312[/C][C]-0.5517[/C][C]0.291202[/C][/ROW]
[ROW][C]28[/C][C]-0.026971[/C][C]-0.2643[/C][C]0.396074[/C][/ROW]
[ROW][C]29[/C][C]-0.020724[/C][C]-0.2031[/C][C]0.419762[/C][/ROW]
[ROW][C]30[/C][C]-0.026708[/C][C]-0.2617[/C][C]0.397064[/C][/ROW]
[ROW][C]31[/C][C]-0.042058[/C][C]-0.4121[/C][C]0.340599[/C][/ROW]
[ROW][C]32[/C][C]-0.049784[/C][C]-0.4878[/C][C]0.313407[/C][/ROW]
[ROW][C]33[/C][C]-0.024366[/C][C]-0.2387[/C][C]0.405908[/C][/ROW]
[ROW][C]34[/C][C]-0.07839[/C][C]-0.7681[/C][C]0.222168[/C][/ROW]
[ROW][C]35[/C][C]0.109157[/C][C]1.0695[/C][C]0.143759[/C][/ROW]
[ROW][C]36[/C][C]-0.192058[/C][C]-1.8818[/C][C]0.031448[/C][/ROW]
[ROW][C]37[/C][C]-0.004416[/C][C]-0.0433[/C][C]0.482788[/C][/ROW]
[ROW][C]38[/C][C]0.004338[/C][C]0.0425[/C][C]0.483092[/C][/ROW]
[ROW][C]39[/C][C]0.082743[/C][C]0.8107[/C][C]0.209769[/C][/ROW]
[ROW][C]40[/C][C]-0.088826[/C][C]-0.8703[/C][C]0.193149[/C][/ROW]
[ROW][C]41[/C][C]0.04926[/C][C]0.4826[/C][C]0.315224[/C][/ROW]
[ROW][C]42[/C][C]-0.030007[/C][C]-0.294[/C][C]0.384695[/C][/ROW]
[ROW][C]43[/C][C]-0.033134[/C][C]-0.3246[/C][C]0.373079[/C][/ROW]
[ROW][C]44[/C][C]0.103623[/C][C]1.0153[/C][C]0.15626[/C][/ROW]
[ROW][C]45[/C][C]-0.061468[/C][C]-0.6023[/C][C]0.274209[/C][/ROW]
[ROW][C]46[/C][C]-0.162404[/C][C]-1.5912[/C][C]0.057423[/C][/ROW]
[ROW][C]47[/C][C]-0.033691[/C][C]-0.3301[/C][C]0.37102[/C][/ROW]
[ROW][C]48[/C][C]0.007202[/C][C]0.0706[/C][C]0.471947[/C][/ROW]
[/TABLE]
Source: https://freestatistics.org/blog/index.php?pk=113938&T=2

Globally Unique Identifier (entire table): ba.freestatistics.org/blog/index.php?pk=113938&T=2

As an alternative you can also use a QR Code:  

The GUIDs for individual cells are displayed in the table below:

Partial Autocorrelation Function
Time lag kPACF(k)T-STATP-value
10.2201022.15660.016769
20.2623522.57050.005846
30.2216982.17220.016152
4-0.164502-1.61180.055146
50.0863880.84640.199711
60.2262192.21650.01451
7-0.049305-0.48310.315065
80.1827971.7910.038219
90.0644610.63160.264579
10-0.125236-1.22710.1114
110.0487240.47740.317081
12-0.246457-2.41480.008819
13-0.049205-0.48210.315414
140.0646140.63310.264092
150.3262823.19690.000941
16-0.218009-2.1360.01761
170.0055740.05460.478281
180.1270381.24470.108134
19-0.062105-0.60850.272145
20-0.000357-0.00350.498608
210.0651760.63860.262303
22-0.144918-1.41990.079437
23-0.076694-0.75140.227111
24-0.180026-1.76390.040466
25-0.020962-0.20540.418853
260.0183660.17990.428786
27-0.056312-0.55170.291202
28-0.026971-0.26430.396074
29-0.020724-0.20310.419762
30-0.026708-0.26170.397064
31-0.042058-0.41210.340599
32-0.049784-0.48780.313407
33-0.024366-0.23870.405908
34-0.07839-0.76810.222168
350.1091571.06950.143759
36-0.192058-1.88180.031448
37-0.004416-0.04330.482788
380.0043380.04250.483092
390.0827430.81070.209769
40-0.088826-0.87030.193149
410.049260.48260.315224
42-0.030007-0.2940.384695
43-0.033134-0.32460.373079
440.1036231.01530.15626
45-0.061468-0.60230.274209
46-0.162404-1.59120.057423
47-0.033691-0.33010.37102
480.0072020.07060.471947


Parameters (Session):
par1 = 48 ; par2 = 1 ; par3 = 0 ; par4 = 1 ; par5 = 12 ; par6 = White Noise ; par7 = 0.95 ;
Parameters (R input):
par1 = 48 ; par2 = 1 ; par3 = 0 ; par4 = 1 ; par5 = 12 ; par6 = White Noise ; par7 = 0.95 ; par8 = ;
R code (references can be found in the software module):
if (par1 == 'Default') {
par1 = 10*log10(length(x))
} else {
par1 <- as.numeric(par1)
}
par2 <- as.numeric(par2)
par3 <- as.numeric(par3)
par4 <- as.numeric(par4)
par5 <- as.numeric(par5)
if (par6 == 'White Noise') par6 <- 'white' else par6 <- 'ma'
par7 <- as.numeric(par7)
if (par2 == 0) {
x <- log(x)
} else {
x <- (x ^ par2 - 1) / par2
}
if (par3 > 0) x <- diff(x,lag=1,difference=par3)
if (par4 > 0) x <- diff(x,lag=par5,difference=par4)
bitmap(file='pic1.png')
racf <- acf(x, par1, main='Autocorrelation', xlab='time lag', ylab='ACF', ci.type=par6, ci=par7, sub=paste('(lambda=',par2,', d=',par3,', D=',par4,', CI=', par7, ', CI type=',par6,')',sep=''))
dev.off()
bitmap(file='pic2.png')
rpacf <- pacf(x,par1,main='Partial Autocorrelation',xlab='lags',ylab='PACF')
dev.off()
(myacf <- c(racf$acf))
(mypacf <- c(rpacf$acf))
lengthx <- length(x)
sqrtn <- sqrt(lengthx)
load(file='createtable')
a<-table.start()
a<-table.row.start(a)
a<-table.element(a,'Autocorrelation Function',4,TRUE)
a<-table.row.end(a)
a<-table.row.start(a)
a<-table.element(a,'Time lag k',header=TRUE)
a<-table.element(a,hyperlink('basics.htm','ACF(k)','click here for more information about the Autocorrelation Function'),header=TRUE)
a<-table.element(a,'T-STAT',header=TRUE)
a<-table.element(a,'P-value',header=TRUE)
a<-table.row.end(a)
for (i in 2:(par1+1)) {
a<-table.row.start(a)
a<-table.element(a,i-1,header=TRUE)
a<-table.element(a,round(myacf[i],6))
mytstat <- myacf[i]*sqrtn
a<-table.element(a,round(mytstat,4))
a<-table.element(a,round(1-pt(abs(mytstat),lengthx),6))
a<-table.row.end(a)
}
a<-table.end(a)
table.save(a,file='mytable.tab')
a<-table.start()
a<-table.row.start(a)
a<-table.element(a,'Partial Autocorrelation Function',4,TRUE)
a<-table.row.end(a)
a<-table.row.start(a)
a<-table.element(a,'Time lag k',header=TRUE)
a<-table.element(a,hyperlink('basics.htm','PACF(k)','click here for more information about the Partial Autocorrelation Function'),header=TRUE)
a<-table.element(a,'T-STAT',header=TRUE)
a<-table.element(a,'P-value',header=TRUE)
a<-table.row.end(a)
for (i in 1:par1) {
a<-table.row.start(a)
a<-table.element(a,i,header=TRUE)
a<-table.element(a,round(mypacf[i],6))
mytstat <- mypacf[i]*sqrtn
a<-table.element(a,round(mytstat,4))
a<-table.element(a,round(1-pt(abs(mytstat),lengthx),6))
a<-table.row.end(a)
}
a<-table.end(a)
table.save(a,file='mytable1.tab')