Free Statistics

of Irreproducible Research!

Author's title

Author*The author of this computation has been verified*
R Software Modulerwasp_autocorrelation.wasp
Title produced by software(Partial) Autocorrelation Function
Date of computationTue, 21 Dec 2010 20:16:07 +0000
Cite this page as followsStatistical Computations at FreeStatistics.org, Office for Research Development and Education, URL https://freestatistics.org/blog/index.php?v=date/2010/Dec/21/t12929626175ct92malxh0iyst.htm/, Retrieved Sat, 18 May 2024 01:12:54 +0000
Statistical Computations at FreeStatistics.org, Office for Research Development and Education, URL https://freestatistics.org/blog/index.php?pk=113935, Retrieved Sat, 18 May 2024 01:12:54 +0000
QR Codes:

Original text written by user:
IsPrivate?No (this computation is public)
User-defined keywords
Estimated Impact128
Family? (F = Feedback message, R = changed R code, M = changed R Module, P = changed Parameters, D = changed Data)
-     [Univariate Data Series] [] [2008-12-14 11:54:22] [d2d412c7f4d35ffbf5ee5ee89db327d4]
- RMP   [(Partial) Autocorrelation Function] [] [2010-12-07 13:42:19] [dd4fe494cff2ee46c12b15bdc7b848ca]
-    D      [(Partial) Autocorrelation Function] [] [2010-12-21 20:16:07] [6c31f786e793d35ef3a03978bc5de774] [Current]
-   P         [(Partial) Autocorrelation Function] [] [2010-12-21 20:22:04] [dd4fe494cff2ee46c12b15bdc7b848ca]
Feedback Forum

Post a new message
Dataseries X:
320
324
343
295
301
367
196
182
342
361
333
330
345
323
365
323
316
358
235
169
430
409
407
341
326
374
364
349
300
385
304
196
443
414
325
388
356
386
444
387
327
448
225
182
460
411
342
361
377
331
428
340
352
461
221
198
422
329
320
375
364
351
380
319
322
386
221
187
343
342
365
313
356
337
389
326
343
357
220
218
391
425
332
298
360
336
325
393
301
426
265
210
429
440
357
431
442
422
544
420
396
482
261
211
448
468
464
425


Summary of computational transaction
Raw Inputview raw input (R code)
Raw Outputview raw output of R engine
Computing time1 seconds
R Server'Gwilym Jenkins' @ 72.249.127.135

\begin{tabular}{lllllllll}
\hline
Summary of computational transaction \tabularnewline
Raw Input & view raw input (R code)  \tabularnewline
Raw Output & view raw output of R engine  \tabularnewline
Computing time & 1 seconds \tabularnewline
R Server & 'Gwilym Jenkins' @ 72.249.127.135 \tabularnewline
\hline
\end{tabular}
%Source: https://freestatistics.org/blog/index.php?pk=113935&T=0

[TABLE]
[ROW][C]Summary of computational transaction[/C][/ROW]
[ROW][C]Raw Input[/C][C]view raw input (R code) [/C][/ROW]
[ROW][C]Raw Output[/C][C]view raw output of R engine [/C][/ROW]
[ROW][C]Computing time[/C][C]1 seconds[/C][/ROW]
[ROW][C]R Server[/C][C]'Gwilym Jenkins' @ 72.249.127.135[/C][/ROW]
[/TABLE]
Source: https://freestatistics.org/blog/index.php?pk=113935&T=0

Globally Unique Identifier (entire table): ba.freestatistics.org/blog/index.php?pk=113935&T=0

As an alternative you can also use a QR Code:  

The GUIDs for individual cells are displayed in the table below:

Summary of computational transaction
Raw Inputview raw input (R code)
Raw Outputview raw output of R engine
Computing time1 seconds
R Server'Gwilym Jenkins' @ 72.249.127.135


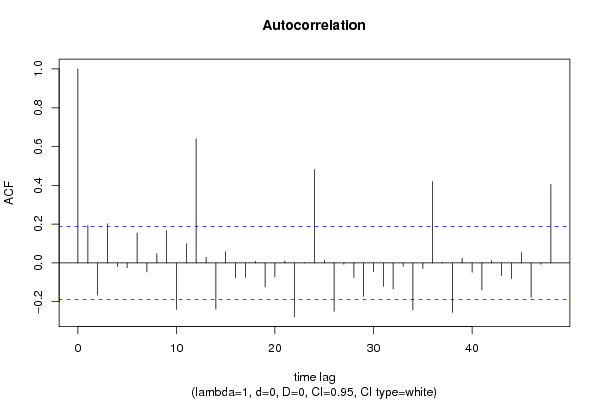
Autocorrelation Function
Time lag kACF(k)T-STATP-value
10.1933112.00890.023519
2-0.165442-1.71930.04421
30.2016362.09550.019234
4-0.018549-0.19280.423751
5-0.024524-0.25490.399659
60.1548741.60950.055213
7-0.046325-0.48140.315595
80.0476280.4950.310815
90.1660331.72550.043652
10-0.239619-2.49020.007145
110.099461.03360.151813
120.6398536.64960
130.0290420.30180.381688
14-0.238687-2.48050.007331
150.0589660.61280.27065
16-0.077482-0.80520.211232
17-0.07474-0.77670.21951
180.008370.0870.465421
19-0.124159-1.29030.099852
20-0.070897-0.73680.231427
210.010380.10790.45715
22-0.276914-2.87780.002414
230.0013240.01380.494523
240.4816945.00591e-06
250.0136910.14230.443561
26-0.249601-2.59390.005402
27-0.006998-0.07270.471079
28-0.074616-0.77540.219889
29-0.172128-1.78880.038225
30-0.045396-0.47180.319023
31-0.121286-1.26040.105114
32-0.134122-1.39380.083114
33-0.017343-0.18020.428654
34-0.242641-2.52160.006571
35-0.028389-0.2950.384271
360.419884.36351.5e-05
370.0024010.0250.490069
38-0.255404-2.65420.004575
390.0248310.25810.398427
40-0.048281-0.50170.308433
41-0.140105-1.4560.074145
420.0129470.13460.446608
43-0.065907-0.68490.247431
44-0.080848-0.84020.201327
450.053150.55240.290923
46-0.175662-1.82550.035342
47-0.006255-0.0650.474146
480.4049234.20812.7e-05

\begin{tabular}{lllllllll}
\hline
Autocorrelation Function \tabularnewline
Time lag k & ACF(k) & T-STAT & P-value \tabularnewline
1 & 0.193311 & 2.0089 & 0.023519 \tabularnewline
2 & -0.165442 & -1.7193 & 0.04421 \tabularnewline
3 & 0.201636 & 2.0955 & 0.019234 \tabularnewline
4 & -0.018549 & -0.1928 & 0.423751 \tabularnewline
5 & -0.024524 & -0.2549 & 0.399659 \tabularnewline
6 & 0.154874 & 1.6095 & 0.055213 \tabularnewline
7 & -0.046325 & -0.4814 & 0.315595 \tabularnewline
8 & 0.047628 & 0.495 & 0.310815 \tabularnewline
9 & 0.166033 & 1.7255 & 0.043652 \tabularnewline
10 & -0.239619 & -2.4902 & 0.007145 \tabularnewline
11 & 0.09946 & 1.0336 & 0.151813 \tabularnewline
12 & 0.639853 & 6.6496 & 0 \tabularnewline
13 & 0.029042 & 0.3018 & 0.381688 \tabularnewline
14 & -0.238687 & -2.4805 & 0.007331 \tabularnewline
15 & 0.058966 & 0.6128 & 0.27065 \tabularnewline
16 & -0.077482 & -0.8052 & 0.211232 \tabularnewline
17 & -0.07474 & -0.7767 & 0.21951 \tabularnewline
18 & 0.00837 & 0.087 & 0.465421 \tabularnewline
19 & -0.124159 & -1.2903 & 0.099852 \tabularnewline
20 & -0.070897 & -0.7368 & 0.231427 \tabularnewline
21 & 0.01038 & 0.1079 & 0.45715 \tabularnewline
22 & -0.276914 & -2.8778 & 0.002414 \tabularnewline
23 & 0.001324 & 0.0138 & 0.494523 \tabularnewline
24 & 0.481694 & 5.0059 & 1e-06 \tabularnewline
25 & 0.013691 & 0.1423 & 0.443561 \tabularnewline
26 & -0.249601 & -2.5939 & 0.005402 \tabularnewline
27 & -0.006998 & -0.0727 & 0.471079 \tabularnewline
28 & -0.074616 & -0.7754 & 0.219889 \tabularnewline
29 & -0.172128 & -1.7888 & 0.038225 \tabularnewline
30 & -0.045396 & -0.4718 & 0.319023 \tabularnewline
31 & -0.121286 & -1.2604 & 0.105114 \tabularnewline
32 & -0.134122 & -1.3938 & 0.083114 \tabularnewline
33 & -0.017343 & -0.1802 & 0.428654 \tabularnewline
34 & -0.242641 & -2.5216 & 0.006571 \tabularnewline
35 & -0.028389 & -0.295 & 0.384271 \tabularnewline
36 & 0.41988 & 4.3635 & 1.5e-05 \tabularnewline
37 & 0.002401 & 0.025 & 0.490069 \tabularnewline
38 & -0.255404 & -2.6542 & 0.004575 \tabularnewline
39 & 0.024831 & 0.2581 & 0.398427 \tabularnewline
40 & -0.048281 & -0.5017 & 0.308433 \tabularnewline
41 & -0.140105 & -1.456 & 0.074145 \tabularnewline
42 & 0.012947 & 0.1346 & 0.446608 \tabularnewline
43 & -0.065907 & -0.6849 & 0.247431 \tabularnewline
44 & -0.080848 & -0.8402 & 0.201327 \tabularnewline
45 & 0.05315 & 0.5524 & 0.290923 \tabularnewline
46 & -0.175662 & -1.8255 & 0.035342 \tabularnewline
47 & -0.006255 & -0.065 & 0.474146 \tabularnewline
48 & 0.404923 & 4.2081 & 2.7e-05 \tabularnewline
\hline
\end{tabular}
%Source: https://freestatistics.org/blog/index.php?pk=113935&T=1

[TABLE]
[ROW][C]Autocorrelation Function[/C][/ROW]
[ROW][C]Time lag k[/C][C]ACF(k)[/C][C]T-STAT[/C][C]P-value[/C][/ROW]
[ROW][C]1[/C][C]0.193311[/C][C]2.0089[/C][C]0.023519[/C][/ROW]
[ROW][C]2[/C][C]-0.165442[/C][C]-1.7193[/C][C]0.04421[/C][/ROW]
[ROW][C]3[/C][C]0.201636[/C][C]2.0955[/C][C]0.019234[/C][/ROW]
[ROW][C]4[/C][C]-0.018549[/C][C]-0.1928[/C][C]0.423751[/C][/ROW]
[ROW][C]5[/C][C]-0.024524[/C][C]-0.2549[/C][C]0.399659[/C][/ROW]
[ROW][C]6[/C][C]0.154874[/C][C]1.6095[/C][C]0.055213[/C][/ROW]
[ROW][C]7[/C][C]-0.046325[/C][C]-0.4814[/C][C]0.315595[/C][/ROW]
[ROW][C]8[/C][C]0.047628[/C][C]0.495[/C][C]0.310815[/C][/ROW]
[ROW][C]9[/C][C]0.166033[/C][C]1.7255[/C][C]0.043652[/C][/ROW]
[ROW][C]10[/C][C]-0.239619[/C][C]-2.4902[/C][C]0.007145[/C][/ROW]
[ROW][C]11[/C][C]0.09946[/C][C]1.0336[/C][C]0.151813[/C][/ROW]
[ROW][C]12[/C][C]0.639853[/C][C]6.6496[/C][C]0[/C][/ROW]
[ROW][C]13[/C][C]0.029042[/C][C]0.3018[/C][C]0.381688[/C][/ROW]
[ROW][C]14[/C][C]-0.238687[/C][C]-2.4805[/C][C]0.007331[/C][/ROW]
[ROW][C]15[/C][C]0.058966[/C][C]0.6128[/C][C]0.27065[/C][/ROW]
[ROW][C]16[/C][C]-0.077482[/C][C]-0.8052[/C][C]0.211232[/C][/ROW]
[ROW][C]17[/C][C]-0.07474[/C][C]-0.7767[/C][C]0.21951[/C][/ROW]
[ROW][C]18[/C][C]0.00837[/C][C]0.087[/C][C]0.465421[/C][/ROW]
[ROW][C]19[/C][C]-0.124159[/C][C]-1.2903[/C][C]0.099852[/C][/ROW]
[ROW][C]20[/C][C]-0.070897[/C][C]-0.7368[/C][C]0.231427[/C][/ROW]
[ROW][C]21[/C][C]0.01038[/C][C]0.1079[/C][C]0.45715[/C][/ROW]
[ROW][C]22[/C][C]-0.276914[/C][C]-2.8778[/C][C]0.002414[/C][/ROW]
[ROW][C]23[/C][C]0.001324[/C][C]0.0138[/C][C]0.494523[/C][/ROW]
[ROW][C]24[/C][C]0.481694[/C][C]5.0059[/C][C]1e-06[/C][/ROW]
[ROW][C]25[/C][C]0.013691[/C][C]0.1423[/C][C]0.443561[/C][/ROW]
[ROW][C]26[/C][C]-0.249601[/C][C]-2.5939[/C][C]0.005402[/C][/ROW]
[ROW][C]27[/C][C]-0.006998[/C][C]-0.0727[/C][C]0.471079[/C][/ROW]
[ROW][C]28[/C][C]-0.074616[/C][C]-0.7754[/C][C]0.219889[/C][/ROW]
[ROW][C]29[/C][C]-0.172128[/C][C]-1.7888[/C][C]0.038225[/C][/ROW]
[ROW][C]30[/C][C]-0.045396[/C][C]-0.4718[/C][C]0.319023[/C][/ROW]
[ROW][C]31[/C][C]-0.121286[/C][C]-1.2604[/C][C]0.105114[/C][/ROW]
[ROW][C]32[/C][C]-0.134122[/C][C]-1.3938[/C][C]0.083114[/C][/ROW]
[ROW][C]33[/C][C]-0.017343[/C][C]-0.1802[/C][C]0.428654[/C][/ROW]
[ROW][C]34[/C][C]-0.242641[/C][C]-2.5216[/C][C]0.006571[/C][/ROW]
[ROW][C]35[/C][C]-0.028389[/C][C]-0.295[/C][C]0.384271[/C][/ROW]
[ROW][C]36[/C][C]0.41988[/C][C]4.3635[/C][C]1.5e-05[/C][/ROW]
[ROW][C]37[/C][C]0.002401[/C][C]0.025[/C][C]0.490069[/C][/ROW]
[ROW][C]38[/C][C]-0.255404[/C][C]-2.6542[/C][C]0.004575[/C][/ROW]
[ROW][C]39[/C][C]0.024831[/C][C]0.2581[/C][C]0.398427[/C][/ROW]
[ROW][C]40[/C][C]-0.048281[/C][C]-0.5017[/C][C]0.308433[/C][/ROW]
[ROW][C]41[/C][C]-0.140105[/C][C]-1.456[/C][C]0.074145[/C][/ROW]
[ROW][C]42[/C][C]0.012947[/C][C]0.1346[/C][C]0.446608[/C][/ROW]
[ROW][C]43[/C][C]-0.065907[/C][C]-0.6849[/C][C]0.247431[/C][/ROW]
[ROW][C]44[/C][C]-0.080848[/C][C]-0.8402[/C][C]0.201327[/C][/ROW]
[ROW][C]45[/C][C]0.05315[/C][C]0.5524[/C][C]0.290923[/C][/ROW]
[ROW][C]46[/C][C]-0.175662[/C][C]-1.8255[/C][C]0.035342[/C][/ROW]
[ROW][C]47[/C][C]-0.006255[/C][C]-0.065[/C][C]0.474146[/C][/ROW]
[ROW][C]48[/C][C]0.404923[/C][C]4.2081[/C][C]2.7e-05[/C][/ROW]
[/TABLE]
Source: https://freestatistics.org/blog/index.php?pk=113935&T=1

Globally Unique Identifier (entire table): ba.freestatistics.org/blog/index.php?pk=113935&T=1

As an alternative you can also use a QR Code:  

The GUIDs for individual cells are displayed in the table below:

Autocorrelation Function
Time lag kACF(k)T-STATP-value
10.1933112.00890.023519
2-0.165442-1.71930.04421
30.2016362.09550.019234
4-0.018549-0.19280.423751
5-0.024524-0.25490.399659
60.1548741.60950.055213
7-0.046325-0.48140.315595
80.0476280.4950.310815
90.1660331.72550.043652
10-0.239619-2.49020.007145
110.099461.03360.151813
120.6398536.64960
130.0290420.30180.381688
14-0.238687-2.48050.007331
150.0589660.61280.27065
16-0.077482-0.80520.211232
17-0.07474-0.77670.21951
180.008370.0870.465421
19-0.124159-1.29030.099852
20-0.070897-0.73680.231427
210.010380.10790.45715
22-0.276914-2.87780.002414
230.0013240.01380.494523
240.4816945.00591e-06
250.0136910.14230.443561
26-0.249601-2.59390.005402
27-0.006998-0.07270.471079
28-0.074616-0.77540.219889
29-0.172128-1.78880.038225
30-0.045396-0.47180.319023
31-0.121286-1.26040.105114
32-0.134122-1.39380.083114
33-0.017343-0.18020.428654
34-0.242641-2.52160.006571
35-0.028389-0.2950.384271
360.419884.36351.5e-05
370.0024010.0250.490069
38-0.255404-2.65420.004575
390.0248310.25810.398427
40-0.048281-0.50170.308433
41-0.140105-1.4560.074145
420.0129470.13460.446608
43-0.065907-0.68490.247431
44-0.080848-0.84020.201327
450.053150.55240.290923
46-0.175662-1.82550.035342
47-0.006255-0.0650.474146
480.4049234.20812.7e-05


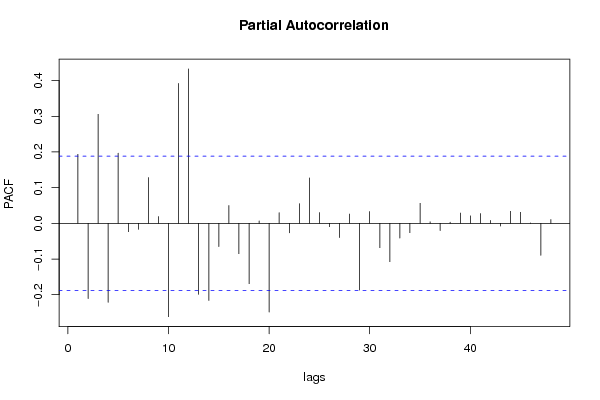
Partial Autocorrelation Function
Time lag kPACF(k)T-STATP-value
10.1933112.00890.023519
2-0.210684-2.18950.015357
30.3055573.17540.000975
4-0.221188-2.29870.011725
50.1966462.04360.021713
6-0.023514-0.24440.403706
7-0.016754-0.17410.43105
80.128331.33360.092562
90.0191120.19860.421468
10-0.261442-2.7170.003837
110.3919374.07314.4e-05
120.4325954.49579e-06
13-0.198944-2.06750.020539
14-0.21588-2.24350.013453
15-0.065165-0.67720.24986
160.0496710.51620.303387
17-0.085201-0.88540.188944
18-0.16891-1.75540.041017
190.0068120.07080.471847
20-0.248549-2.5830.005566
210.0297260.30890.378988
22-0.026646-0.27690.391188
230.0550720.57230.284144
240.127181.32170.094531
250.0303350.31530.376589
26-0.009261-0.09620.461754
27-0.039986-0.41550.339283
280.0258660.26880.394296
29-0.187104-1.94440.027221
300.0329030.34190.366532
31-0.068277-0.70960.239753
32-0.107369-1.11580.13349
33-0.04112-0.42730.334993
34-0.026227-0.27260.392857
350.0562180.58420.28014
360.0042470.04410.482437
37-0.020293-0.21090.416684
380.0033350.03470.486207
390.0289290.30060.382133
400.0209230.21740.414137
410.0273660.28440.388324
420.0079890.0830.466991
43-0.007553-0.07850.468789
440.0336510.34970.363618
450.030870.32080.374487
460.0010760.01120.495549
47-0.089458-0.92970.177308
480.010570.10980.456367

\begin{tabular}{lllllllll}
\hline
Partial Autocorrelation Function \tabularnewline
Time lag k & PACF(k) & T-STAT & P-value \tabularnewline
1 & 0.193311 & 2.0089 & 0.023519 \tabularnewline
2 & -0.210684 & -2.1895 & 0.015357 \tabularnewline
3 & 0.305557 & 3.1754 & 0.000975 \tabularnewline
4 & -0.221188 & -2.2987 & 0.011725 \tabularnewline
5 & 0.196646 & 2.0436 & 0.021713 \tabularnewline
6 & -0.023514 & -0.2444 & 0.403706 \tabularnewline
7 & -0.016754 & -0.1741 & 0.43105 \tabularnewline
8 & 0.12833 & 1.3336 & 0.092562 \tabularnewline
9 & 0.019112 & 0.1986 & 0.421468 \tabularnewline
10 & -0.261442 & -2.717 & 0.003837 \tabularnewline
11 & 0.391937 & 4.0731 & 4.4e-05 \tabularnewline
12 & 0.432595 & 4.4957 & 9e-06 \tabularnewline
13 & -0.198944 & -2.0675 & 0.020539 \tabularnewline
14 & -0.21588 & -2.2435 & 0.013453 \tabularnewline
15 & -0.065165 & -0.6772 & 0.24986 \tabularnewline
16 & 0.049671 & 0.5162 & 0.303387 \tabularnewline
17 & -0.085201 & -0.8854 & 0.188944 \tabularnewline
18 & -0.16891 & -1.7554 & 0.041017 \tabularnewline
19 & 0.006812 & 0.0708 & 0.471847 \tabularnewline
20 & -0.248549 & -2.583 & 0.005566 \tabularnewline
21 & 0.029726 & 0.3089 & 0.378988 \tabularnewline
22 & -0.026646 & -0.2769 & 0.391188 \tabularnewline
23 & 0.055072 & 0.5723 & 0.284144 \tabularnewline
24 & 0.12718 & 1.3217 & 0.094531 \tabularnewline
25 & 0.030335 & 0.3153 & 0.376589 \tabularnewline
26 & -0.009261 & -0.0962 & 0.461754 \tabularnewline
27 & -0.039986 & -0.4155 & 0.339283 \tabularnewline
28 & 0.025866 & 0.2688 & 0.394296 \tabularnewline
29 & -0.187104 & -1.9444 & 0.027221 \tabularnewline
30 & 0.032903 & 0.3419 & 0.366532 \tabularnewline
31 & -0.068277 & -0.7096 & 0.239753 \tabularnewline
32 & -0.107369 & -1.1158 & 0.13349 \tabularnewline
33 & -0.04112 & -0.4273 & 0.334993 \tabularnewline
34 & -0.026227 & -0.2726 & 0.392857 \tabularnewline
35 & 0.056218 & 0.5842 & 0.28014 \tabularnewline
36 & 0.004247 & 0.0441 & 0.482437 \tabularnewline
37 & -0.020293 & -0.2109 & 0.416684 \tabularnewline
38 & 0.003335 & 0.0347 & 0.486207 \tabularnewline
39 & 0.028929 & 0.3006 & 0.382133 \tabularnewline
40 & 0.020923 & 0.2174 & 0.414137 \tabularnewline
41 & 0.027366 & 0.2844 & 0.388324 \tabularnewline
42 & 0.007989 & 0.083 & 0.466991 \tabularnewline
43 & -0.007553 & -0.0785 & 0.468789 \tabularnewline
44 & 0.033651 & 0.3497 & 0.363618 \tabularnewline
45 & 0.03087 & 0.3208 & 0.374487 \tabularnewline
46 & 0.001076 & 0.0112 & 0.495549 \tabularnewline
47 & -0.089458 & -0.9297 & 0.177308 \tabularnewline
48 & 0.01057 & 0.1098 & 0.456367 \tabularnewline
\hline
\end{tabular}
%Source: https://freestatistics.org/blog/index.php?pk=113935&T=2

[TABLE]
[ROW][C]Partial Autocorrelation Function[/C][/ROW]
[ROW][C]Time lag k[/C][C]PACF(k)[/C][C]T-STAT[/C][C]P-value[/C][/ROW]
[ROW][C]1[/C][C]0.193311[/C][C]2.0089[/C][C]0.023519[/C][/ROW]
[ROW][C]2[/C][C]-0.210684[/C][C]-2.1895[/C][C]0.015357[/C][/ROW]
[ROW][C]3[/C][C]0.305557[/C][C]3.1754[/C][C]0.000975[/C][/ROW]
[ROW][C]4[/C][C]-0.221188[/C][C]-2.2987[/C][C]0.011725[/C][/ROW]
[ROW][C]5[/C][C]0.196646[/C][C]2.0436[/C][C]0.021713[/C][/ROW]
[ROW][C]6[/C][C]-0.023514[/C][C]-0.2444[/C][C]0.403706[/C][/ROW]
[ROW][C]7[/C][C]-0.016754[/C][C]-0.1741[/C][C]0.43105[/C][/ROW]
[ROW][C]8[/C][C]0.12833[/C][C]1.3336[/C][C]0.092562[/C][/ROW]
[ROW][C]9[/C][C]0.019112[/C][C]0.1986[/C][C]0.421468[/C][/ROW]
[ROW][C]10[/C][C]-0.261442[/C][C]-2.717[/C][C]0.003837[/C][/ROW]
[ROW][C]11[/C][C]0.391937[/C][C]4.0731[/C][C]4.4e-05[/C][/ROW]
[ROW][C]12[/C][C]0.432595[/C][C]4.4957[/C][C]9e-06[/C][/ROW]
[ROW][C]13[/C][C]-0.198944[/C][C]-2.0675[/C][C]0.020539[/C][/ROW]
[ROW][C]14[/C][C]-0.21588[/C][C]-2.2435[/C][C]0.013453[/C][/ROW]
[ROW][C]15[/C][C]-0.065165[/C][C]-0.6772[/C][C]0.24986[/C][/ROW]
[ROW][C]16[/C][C]0.049671[/C][C]0.5162[/C][C]0.303387[/C][/ROW]
[ROW][C]17[/C][C]-0.085201[/C][C]-0.8854[/C][C]0.188944[/C][/ROW]
[ROW][C]18[/C][C]-0.16891[/C][C]-1.7554[/C][C]0.041017[/C][/ROW]
[ROW][C]19[/C][C]0.006812[/C][C]0.0708[/C][C]0.471847[/C][/ROW]
[ROW][C]20[/C][C]-0.248549[/C][C]-2.583[/C][C]0.005566[/C][/ROW]
[ROW][C]21[/C][C]0.029726[/C][C]0.3089[/C][C]0.378988[/C][/ROW]
[ROW][C]22[/C][C]-0.026646[/C][C]-0.2769[/C][C]0.391188[/C][/ROW]
[ROW][C]23[/C][C]0.055072[/C][C]0.5723[/C][C]0.284144[/C][/ROW]
[ROW][C]24[/C][C]0.12718[/C][C]1.3217[/C][C]0.094531[/C][/ROW]
[ROW][C]25[/C][C]0.030335[/C][C]0.3153[/C][C]0.376589[/C][/ROW]
[ROW][C]26[/C][C]-0.009261[/C][C]-0.0962[/C][C]0.461754[/C][/ROW]
[ROW][C]27[/C][C]-0.039986[/C][C]-0.4155[/C][C]0.339283[/C][/ROW]
[ROW][C]28[/C][C]0.025866[/C][C]0.2688[/C][C]0.394296[/C][/ROW]
[ROW][C]29[/C][C]-0.187104[/C][C]-1.9444[/C][C]0.027221[/C][/ROW]
[ROW][C]30[/C][C]0.032903[/C][C]0.3419[/C][C]0.366532[/C][/ROW]
[ROW][C]31[/C][C]-0.068277[/C][C]-0.7096[/C][C]0.239753[/C][/ROW]
[ROW][C]32[/C][C]-0.107369[/C][C]-1.1158[/C][C]0.13349[/C][/ROW]
[ROW][C]33[/C][C]-0.04112[/C][C]-0.4273[/C][C]0.334993[/C][/ROW]
[ROW][C]34[/C][C]-0.026227[/C][C]-0.2726[/C][C]0.392857[/C][/ROW]
[ROW][C]35[/C][C]0.056218[/C][C]0.5842[/C][C]0.28014[/C][/ROW]
[ROW][C]36[/C][C]0.004247[/C][C]0.0441[/C][C]0.482437[/C][/ROW]
[ROW][C]37[/C][C]-0.020293[/C][C]-0.2109[/C][C]0.416684[/C][/ROW]
[ROW][C]38[/C][C]0.003335[/C][C]0.0347[/C][C]0.486207[/C][/ROW]
[ROW][C]39[/C][C]0.028929[/C][C]0.3006[/C][C]0.382133[/C][/ROW]
[ROW][C]40[/C][C]0.020923[/C][C]0.2174[/C][C]0.414137[/C][/ROW]
[ROW][C]41[/C][C]0.027366[/C][C]0.2844[/C][C]0.388324[/C][/ROW]
[ROW][C]42[/C][C]0.007989[/C][C]0.083[/C][C]0.466991[/C][/ROW]
[ROW][C]43[/C][C]-0.007553[/C][C]-0.0785[/C][C]0.468789[/C][/ROW]
[ROW][C]44[/C][C]0.033651[/C][C]0.3497[/C][C]0.363618[/C][/ROW]
[ROW][C]45[/C][C]0.03087[/C][C]0.3208[/C][C]0.374487[/C][/ROW]
[ROW][C]46[/C][C]0.001076[/C][C]0.0112[/C][C]0.495549[/C][/ROW]
[ROW][C]47[/C][C]-0.089458[/C][C]-0.9297[/C][C]0.177308[/C][/ROW]
[ROW][C]48[/C][C]0.01057[/C][C]0.1098[/C][C]0.456367[/C][/ROW]
[/TABLE]
Source: https://freestatistics.org/blog/index.php?pk=113935&T=2

Globally Unique Identifier (entire table): ba.freestatistics.org/blog/index.php?pk=113935&T=2

As an alternative you can also use a QR Code:  

The GUIDs for individual cells are displayed in the table below:

Partial Autocorrelation Function
Time lag kPACF(k)T-STATP-value
10.1933112.00890.023519
2-0.210684-2.18950.015357
30.3055573.17540.000975
4-0.221188-2.29870.011725
50.1966462.04360.021713
6-0.023514-0.24440.403706
7-0.016754-0.17410.43105
80.128331.33360.092562
90.0191120.19860.421468
10-0.261442-2.7170.003837
110.3919374.07314.4e-05
120.4325954.49579e-06
13-0.198944-2.06750.020539
14-0.21588-2.24350.013453
15-0.065165-0.67720.24986
160.0496710.51620.303387
17-0.085201-0.88540.188944
18-0.16891-1.75540.041017
190.0068120.07080.471847
20-0.248549-2.5830.005566
210.0297260.30890.378988
22-0.026646-0.27690.391188
230.0550720.57230.284144
240.127181.32170.094531
250.0303350.31530.376589
26-0.009261-0.09620.461754
27-0.039986-0.41550.339283
280.0258660.26880.394296
29-0.187104-1.94440.027221
300.0329030.34190.366532
31-0.068277-0.70960.239753
32-0.107369-1.11580.13349
33-0.04112-0.42730.334993
34-0.026227-0.27260.392857
350.0562180.58420.28014
360.0042470.04410.482437
37-0.020293-0.21090.416684
380.0033350.03470.486207
390.0289290.30060.382133
400.0209230.21740.414137
410.0273660.28440.388324
420.0079890.0830.466991
43-0.007553-0.07850.468789
440.0336510.34970.363618
450.030870.32080.374487
460.0010760.01120.495549
47-0.089458-0.92970.177308
480.010570.10980.456367


Parameters (Session):
par1 = 48 ; par2 = 1 ; par3 = 0 ; par4 = 0 ; par5 = 12 ; par6 = White Noise ; par7 = 0.95 ;
Parameters (R input):
par1 = 48 ; par2 = 1 ; par3 = 0 ; par4 = 0 ; par5 = 12 ; par6 = White Noise ; par7 = 0.95 ; par8 = ;
R code (references can be found in the software module):
if (par1 == 'Default') {
par1 = 10*log10(length(x))
} else {
par1 <- as.numeric(par1)
}
par2 <- as.numeric(par2)
par3 <- as.numeric(par3)
par4 <- as.numeric(par4)
par5 <- as.numeric(par5)
if (par6 == 'White Noise') par6 <- 'white' else par6 <- 'ma'
par7 <- as.numeric(par7)
if (par2 == 0) {
x <- log(x)
} else {
x <- (x ^ par2 - 1) / par2
}
if (par3 > 0) x <- diff(x,lag=1,difference=par3)
if (par4 > 0) x <- diff(x,lag=par5,difference=par4)
bitmap(file='pic1.png')
racf <- acf(x, par1, main='Autocorrelation', xlab='time lag', ylab='ACF', ci.type=par6, ci=par7, sub=paste('(lambda=',par2,', d=',par3,', D=',par4,', CI=', par7, ', CI type=',par6,')',sep=''))
dev.off()
bitmap(file='pic2.png')
rpacf <- pacf(x,par1,main='Partial Autocorrelation',xlab='lags',ylab='PACF')
dev.off()
(myacf <- c(racf$acf))
(mypacf <- c(rpacf$acf))
lengthx <- length(x)
sqrtn <- sqrt(lengthx)
load(file='createtable')
a<-table.start()
a<-table.row.start(a)
a<-table.element(a,'Autocorrelation Function',4,TRUE)
a<-table.row.end(a)
a<-table.row.start(a)
a<-table.element(a,'Time lag k',header=TRUE)
a<-table.element(a,hyperlink('basics.htm','ACF(k)','click here for more information about the Autocorrelation Function'),header=TRUE)
a<-table.element(a,'T-STAT',header=TRUE)
a<-table.element(a,'P-value',header=TRUE)
a<-table.row.end(a)
for (i in 2:(par1+1)) {
a<-table.row.start(a)
a<-table.element(a,i-1,header=TRUE)
a<-table.element(a,round(myacf[i],6))
mytstat <- myacf[i]*sqrtn
a<-table.element(a,round(mytstat,4))
a<-table.element(a,round(1-pt(abs(mytstat),lengthx),6))
a<-table.row.end(a)
}
a<-table.end(a)
table.save(a,file='mytable.tab')
a<-table.start()
a<-table.row.start(a)
a<-table.element(a,'Partial Autocorrelation Function',4,TRUE)
a<-table.row.end(a)
a<-table.row.start(a)
a<-table.element(a,'Time lag k',header=TRUE)
a<-table.element(a,hyperlink('basics.htm','PACF(k)','click here for more information about the Partial Autocorrelation Function'),header=TRUE)
a<-table.element(a,'T-STAT',header=TRUE)
a<-table.element(a,'P-value',header=TRUE)
a<-table.row.end(a)
for (i in 1:par1) {
a<-table.row.start(a)
a<-table.element(a,i,header=TRUE)
a<-table.element(a,round(mypacf[i],6))
mytstat <- mypacf[i]*sqrtn
a<-table.element(a,round(mytstat,4))
a<-table.element(a,round(1-pt(abs(mytstat),lengthx),6))
a<-table.row.end(a)
}
a<-table.end(a)
table.save(a,file='mytable1.tab')