Free Statistics

of Irreproducible Research!

Author's title

Author*The author of this computation has been verified*
R Software Modulerwasp_arimabackwardselection.wasp
Title produced by softwareARIMA Backward Selection
Date of computationTue, 21 Dec 2010 12:35:49 +0000
Cite this page as followsStatistical Computations at FreeStatistics.org, Office for Research Development and Education, URL https://freestatistics.org/blog/index.php?v=date/2010/Dec/21/t129293495091fgwvt7qfo3l4x.htm/, Retrieved Sat, 18 May 2024 08:16:28 +0000
Statistical Computations at FreeStatistics.org, Office for Research Development and Education, URL https://freestatistics.org/blog/index.php?pk=113409, Retrieved Sat, 18 May 2024 08:16:28 +0000
QR Codes:

Original text written by user:
IsPrivate?No (this computation is public)
User-defined keywords
Estimated Impact182
Family? (F = Feedback message, R = changed R code, M = changed R Module, P = changed Parameters, D = changed Data)
-     [Univariate Data Series] [] [2008-12-08 19:22:39] [d2d412c7f4d35ffbf5ee5ee89db327d4]
F RMP   [(Partial) Autocorrelation Function] [WS 9] [2010-12-07 20:24:41] [9b13650c94c5192ca5135ec8a1fa39f7]
-    D    [(Partial) Autocorrelation Function] [ACF Paper] [2010-12-19 13:35:17] [9b13650c94c5192ca5135ec8a1fa39f7]
-   P       [(Partial) Autocorrelation Function] [] [2010-12-21 10:32:09] [9b13650c94c5192ca5135ec8a1fa39f7]
-             [(Partial) Autocorrelation Function] [] [2010-12-21 10:39:04] [9b13650c94c5192ca5135ec8a1fa39f7]
-   P           [(Partial) Autocorrelation Function] [] [2010-12-21 10:40:43] [9b13650c94c5192ca5135ec8a1fa39f7]
-   P             [(Partial) Autocorrelation Function] [] [2010-12-21 10:50:06] [9b13650c94c5192ca5135ec8a1fa39f7]
- RMP               [Spectral Analysis] [] [2010-12-21 11:01:31] [9b13650c94c5192ca5135ec8a1fa39f7]
-   P                 [Spectral Analysis] [] [2010-12-21 11:12:16] [9b13650c94c5192ca5135ec8a1fa39f7]
-   P                   [Spectral Analysis] [] [2010-12-21 11:21:27] [9b13650c94c5192ca5135ec8a1fa39f7]
- RMP                     [Variance Reduction Matrix] [] [2010-12-21 11:45:42] [9b13650c94c5192ca5135ec8a1fa39f7]
- RM                          [ARIMA Backward Selection] [] [2010-12-21 12:35:49] [5fd8c857995b7937a45335fd5ccccdde] [Current]
- RMP                           [ARIMA Forecasting] [] [2010-12-22 19:05:16] [9b13650c94c5192ca5135ec8a1fa39f7]
-   P                             [ARIMA Forecasting] [] [2010-12-22 19:15:24] [9b13650c94c5192ca5135ec8a1fa39f7]
Feedback Forum

Post a new message
Dataseries X:
11514
31514
27071
29462
26105
22397
23843
21705
18089
20764
25316
17704
15548
28029
29383
36438
32034
22679
24319
18004
17537
20366
22782
19169
13807
29743
25591
29096
26482
22405
27044
17970
18730
19684
19785
18479
10698
31956
29506
34506
27165
26736
23691
18157
17328
18205
20995
17382
9367
31124
26551
30651
25859
25100
25778
20418
18688
20424
24776
19814
12738
31566
30111
30019
31934
25826
26835
20205
17789
20520
22518
15572
11509
25447
24090
27786
26195
20516
22759
19028
16971
20036
22485
18730
14538
27561
25985
34670
32066
27186
29586
21359
21553
19573
24256
22380


Summary of computational transaction
Raw Inputview raw input (R code)
Raw Outputview raw output of R engine
Computing time7 seconds
R Server'RServer@AstonUniversity' @ vre.aston.ac.uk

\begin{tabular}{lllllllll}
\hline
Summary of computational transaction \tabularnewline
Raw Input & view raw input (R code)  \tabularnewline
Raw Output & view raw output of R engine  \tabularnewline
Computing time & 7 seconds \tabularnewline
R Server & 'RServer@AstonUniversity' @ vre.aston.ac.uk \tabularnewline
\hline
\end{tabular}
%Source: https://freestatistics.org/blog/index.php?pk=113409&T=0

[TABLE]
[ROW][C]Summary of computational transaction[/C][/ROW]
[ROW][C]Raw Input[/C][C]view raw input (R code) [/C][/ROW]
[ROW][C]Raw Output[/C][C]view raw output of R engine [/C][/ROW]
[ROW][C]Computing time[/C][C]7 seconds[/C][/ROW]
[ROW][C]R Server[/C][C]'RServer@AstonUniversity' @ vre.aston.ac.uk[/C][/ROW]
[/TABLE]
Source: https://freestatistics.org/blog/index.php?pk=113409&T=0

Globally Unique Identifier (entire table): ba.freestatistics.org/blog/index.php?pk=113409&T=0

As an alternative you can also use a QR Code:  

The GUIDs for individual cells are displayed in the table below:

Summary of computational transaction
Raw Inputview raw input (R code)
Raw Outputview raw output of R engine
Computing time7 seconds
R Server'RServer@AstonUniversity' @ vre.aston.ac.uk


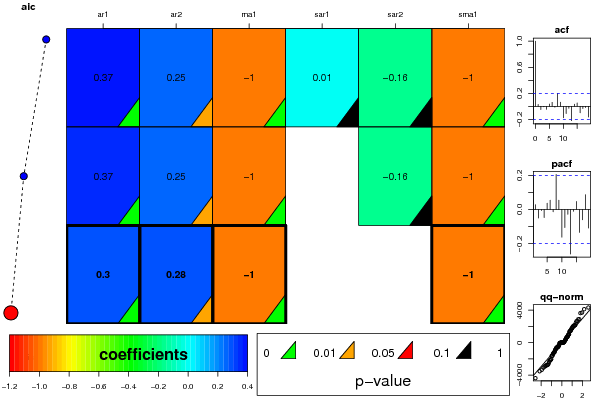
ARIMA Parameter Estimation and Backward Selection
Iterationar1ar2ma1sar1sar2sma1
Estimates ( 1 )0.370.2538-10.0127-0.1594-1
(p-val)(0.0064 )(0.03 )(0 )(0.9274 )(0.3452 )(0 )
Estimates ( 2 )0.36660.2544-10-0.1602-1.0001
(p-val)(0.005 )(0.029 )(0 )(NA )(0.3392 )(0 )
Estimates ( 3 )0.30350.2835-1.000200-0.9997
(p-val)(0.0061 )(0.0108 )(0 )(NA )(NA )(0 )
Estimates ( 4 )NANANANANANA
(p-val)(NA )(NA )(NA )(NA )(NA )(NA )
Estimates ( 5 )NANANANANANA
(p-val)(NA )(NA )(NA )(NA )(NA )(NA )
Estimates ( 6 )NANANANANANA
(p-val)(NA )(NA )(NA )(NA )(NA )(NA )
Estimates ( 7 )NANANANANANA
(p-val)(NA )(NA )(NA )(NA )(NA )(NA )
Estimates ( 8 )NANANANANANA
(p-val)(NA )(NA )(NA )(NA )(NA )(NA )
Estimates ( 9 )NANANANANANA
(p-val)(NA )(NA )(NA )(NA )(NA )(NA )
Estimates ( 10 )NANANANANANA
(p-val)(NA )(NA )(NA )(NA )(NA )(NA )
Estimates ( 11 )NANANANANANA
(p-val)(NA )(NA )(NA )(NA )(NA )(NA )

\begin{tabular}{lllllllll}
\hline
ARIMA Parameter Estimation and Backward Selection \tabularnewline
Iteration & ar1 & ar2 & ma1 & sar1 & sar2 & sma1 \tabularnewline
Estimates ( 1 ) & 0.37 & 0.2538 & -1 & 0.0127 & -0.1594 & -1 \tabularnewline
(p-val) & (0.0064 ) & (0.03 ) & (0 ) & (0.9274 ) & (0.3452 ) & (0 ) \tabularnewline
Estimates ( 2 ) & 0.3666 & 0.2544 & -1 & 0 & -0.1602 & -1.0001 \tabularnewline
(p-val) & (0.005 ) & (0.029 ) & (0 ) & (NA ) & (0.3392 ) & (0 ) \tabularnewline
Estimates ( 3 ) & 0.3035 & 0.2835 & -1.0002 & 0 & 0 & -0.9997 \tabularnewline
(p-val) & (0.0061 ) & (0.0108 ) & (0 ) & (NA ) & (NA ) & (0 ) \tabularnewline
Estimates ( 4 ) & NA & NA & NA & NA & NA & NA \tabularnewline
(p-val) & (NA ) & (NA ) & (NA ) & (NA ) & (NA ) & (NA ) \tabularnewline
Estimates ( 5 ) & NA & NA & NA & NA & NA & NA \tabularnewline
(p-val) & (NA ) & (NA ) & (NA ) & (NA ) & (NA ) & (NA ) \tabularnewline
Estimates ( 6 ) & NA & NA & NA & NA & NA & NA \tabularnewline
(p-val) & (NA ) & (NA ) & (NA ) & (NA ) & (NA ) & (NA ) \tabularnewline
Estimates ( 7 ) & NA & NA & NA & NA & NA & NA \tabularnewline
(p-val) & (NA ) & (NA ) & (NA ) & (NA ) & (NA ) & (NA ) \tabularnewline
Estimates ( 8 ) & NA & NA & NA & NA & NA & NA \tabularnewline
(p-val) & (NA ) & (NA ) & (NA ) & (NA ) & (NA ) & (NA ) \tabularnewline
Estimates ( 9 ) & NA & NA & NA & NA & NA & NA \tabularnewline
(p-val) & (NA ) & (NA ) & (NA ) & (NA ) & (NA ) & (NA ) \tabularnewline
Estimates ( 10 ) & NA & NA & NA & NA & NA & NA \tabularnewline
(p-val) & (NA ) & (NA ) & (NA ) & (NA ) & (NA ) & (NA ) \tabularnewline
Estimates ( 11 ) & NA & NA & NA & NA & NA & NA \tabularnewline
(p-val) & (NA ) & (NA ) & (NA ) & (NA ) & (NA ) & (NA ) \tabularnewline
\hline
\end{tabular}
%Source: https://freestatistics.org/blog/index.php?pk=113409&T=1

[TABLE]
[ROW][C]ARIMA Parameter Estimation and Backward Selection[/C][/ROW]
[ROW][C]Iteration[/C][C]ar1[/C][C]ar2[/C][C]ma1[/C][C]sar1[/C][C]sar2[/C][C]sma1[/C][/ROW]
[ROW][C]Estimates ( 1 )[/C][C]0.37[/C][C]0.2538[/C][C]-1[/C][C]0.0127[/C][C]-0.1594[/C][C]-1[/C][/ROW]
[ROW][C](p-val)[/C][C](0.0064 )[/C][C](0.03 )[/C][C](0 )[/C][C](0.9274 )[/C][C](0.3452 )[/C][C](0 )[/C][/ROW]
[ROW][C]Estimates ( 2 )[/C][C]0.3666[/C][C]0.2544[/C][C]-1[/C][C]0[/C][C]-0.1602[/C][C]-1.0001[/C][/ROW]
[ROW][C](p-val)[/C][C](0.005 )[/C][C](0.029 )[/C][C](0 )[/C][C](NA )[/C][C](0.3392 )[/C][C](0 )[/C][/ROW]
[ROW][C]Estimates ( 3 )[/C][C]0.3035[/C][C]0.2835[/C][C]-1.0002[/C][C]0[/C][C]0[/C][C]-0.9997[/C][/ROW]
[ROW][C](p-val)[/C][C](0.0061 )[/C][C](0.0108 )[/C][C](0 )[/C][C](NA )[/C][C](NA )[/C][C](0 )[/C][/ROW]
[ROW][C]Estimates ( 4 )[/C][C]NA[/C][C]NA[/C][C]NA[/C][C]NA[/C][C]NA[/C][C]NA[/C][/ROW]
[ROW][C](p-val)[/C][C](NA )[/C][C](NA )[/C][C](NA )[/C][C](NA )[/C][C](NA )[/C][C](NA )[/C][/ROW]
[ROW][C]Estimates ( 5 )[/C][C]NA[/C][C]NA[/C][C]NA[/C][C]NA[/C][C]NA[/C][C]NA[/C][/ROW]
[ROW][C](p-val)[/C][C](NA )[/C][C](NA )[/C][C](NA )[/C][C](NA )[/C][C](NA )[/C][C](NA )[/C][/ROW]
[ROW][C]Estimates ( 6 )[/C][C]NA[/C][C]NA[/C][C]NA[/C][C]NA[/C][C]NA[/C][C]NA[/C][/ROW]
[ROW][C](p-val)[/C][C](NA )[/C][C](NA )[/C][C](NA )[/C][C](NA )[/C][C](NA )[/C][C](NA )[/C][/ROW]
[ROW][C]Estimates ( 7 )[/C][C]NA[/C][C]NA[/C][C]NA[/C][C]NA[/C][C]NA[/C][C]NA[/C][/ROW]
[ROW][C](p-val)[/C][C](NA )[/C][C](NA )[/C][C](NA )[/C][C](NA )[/C][C](NA )[/C][C](NA )[/C][/ROW]
[ROW][C]Estimates ( 8 )[/C][C]NA[/C][C]NA[/C][C]NA[/C][C]NA[/C][C]NA[/C][C]NA[/C][/ROW]
[ROW][C](p-val)[/C][C](NA )[/C][C](NA )[/C][C](NA )[/C][C](NA )[/C][C](NA )[/C][C](NA )[/C][/ROW]
[ROW][C]Estimates ( 9 )[/C][C]NA[/C][C]NA[/C][C]NA[/C][C]NA[/C][C]NA[/C][C]NA[/C][/ROW]
[ROW][C](p-val)[/C][C](NA )[/C][C](NA )[/C][C](NA )[/C][C](NA )[/C][C](NA )[/C][C](NA )[/C][/ROW]
[ROW][C]Estimates ( 10 )[/C][C]NA[/C][C]NA[/C][C]NA[/C][C]NA[/C][C]NA[/C][C]NA[/C][/ROW]
[ROW][C](p-val)[/C][C](NA )[/C][C](NA )[/C][C](NA )[/C][C](NA )[/C][C](NA )[/C][C](NA )[/C][/ROW]
[ROW][C]Estimates ( 11 )[/C][C]NA[/C][C]NA[/C][C]NA[/C][C]NA[/C][C]NA[/C][C]NA[/C][/ROW]
[ROW][C](p-val)[/C][C](NA )[/C][C](NA )[/C][C](NA )[/C][C](NA )[/C][C](NA )[/C][C](NA )[/C][/ROW]
[/TABLE]
Source: https://freestatistics.org/blog/index.php?pk=113409&T=1

Globally Unique Identifier (entire table): ba.freestatistics.org/blog/index.php?pk=113409&T=1

As an alternative you can also use a QR Code:  

The GUIDs for individual cells are displayed in the table below:

ARIMA Parameter Estimation and Backward Selection
Iterationar1ar2ma1sar1sar2sma1
Estimates ( 1 )0.370.2538-10.0127-0.1594-1
(p-val)(0.0064 )(0.03 )(0 )(0.9274 )(0.3452 )(0 )
Estimates ( 2 )0.36660.2544-10-0.1602-1.0001
(p-val)(0.005 )(0.029 )(0 )(NA )(0.3392 )(0 )
Estimates ( 3 )0.30350.2835-1.000200-0.9997
(p-val)(0.0061 )(0.0108 )(0 )(NA )(NA )(0 )
Estimates ( 4 )NANANANANANA
(p-val)(NA )(NA )(NA )(NA )(NA )(NA )
Estimates ( 5 )NANANANANANA
(p-val)(NA )(NA )(NA )(NA )(NA )(NA )
Estimates ( 6 )NANANANANANA
(p-val)(NA )(NA )(NA )(NA )(NA )(NA )
Estimates ( 7 )NANANANANANA
(p-val)(NA )(NA )(NA )(NA )(NA )(NA )
Estimates ( 8 )NANANANANANA
(p-val)(NA )(NA )(NA )(NA )(NA )(NA )
Estimates ( 9 )NANANANANANA
(p-val)(NA )(NA )(NA )(NA )(NA )(NA )
Estimates ( 10 )NANANANANANA
(p-val)(NA )(NA )(NA )(NA )(NA )(NA )
Estimates ( 11 )NANANANANANA
(p-val)(NA )(NA )(NA )(NA )(NA )(NA )


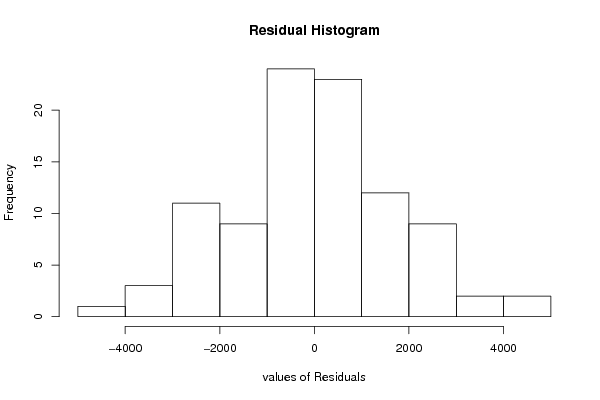
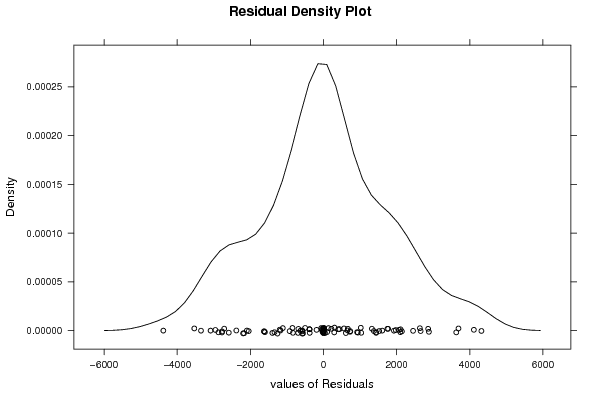
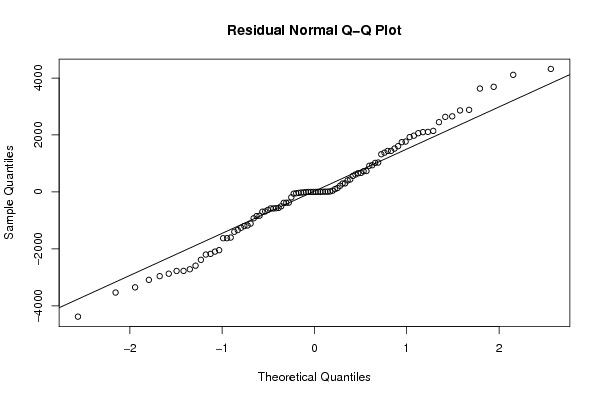
Estimated ARIMA Residuals
Value
-61.5854068680149
-4380.19829167651
1606.88010234529
4318.4520135954
1032.15243514712
-3350.51954264967
-1340.5571412591
-3088.35238605954
300.580374776596
293.54619674322
-1602.08246820113
1439.49507814654
-580.816368857058
-383.536598257972
-2384.4464041482
-2590.46774356446
-377.941597339913
1747.93589869771
2882.1139042039
-2045.57576297071
664.785089980978
-572.935775582083
-2775.3871279486
1377.34773803354
-1177.09924556024
2449.23534368347
2142.72583371508
1925.6037593775
-2096.74851904773
2635.060137886
-2773.15313339022
-1626.61095690437
-22.199354681843
-1113.67679526615
-379.38573890747
214.921504317647
-2198.64612159674
2107.24686564597
-848.930729125202
-1399.70438207406
-685.450951113662
2655.00427853763
1437.88304121967
437.659977682341
99.9357179962184
41.538276800582
1522.92178325679
560.821647770856
-835.154089988334
733.30218772744
1974.66860999601
-2715.44632305829
3691.22987495263
918.44344922326
-580.854268099377
-561.294491318362
-1198.15006024829
137.186118854002
-503.499944475407
-2872.68279709216
-46.4832527181729
-3533.44767792199
-1624.18056493991
-926.448432957393
404.454088361092
-1260.08513536335
-189.886699916158
1767.58167331388
-33.5786338525624
725.122384046292
611.922342208331
938.16057705886
2100.19454221938
-2957.86050816053
-631.946586252947
4111.6739416117
3630.08993834845
1019.46984867979
2061.79736878511
-695.097665127584
1322.63952324839
-2174.85176952603
655.518360811491
2861.67894332422

\begin{tabular}{lllllllll}
\hline
Estimated ARIMA Residuals \tabularnewline
Value \tabularnewline
-61.5854068680149 \tabularnewline
-4380.19829167651 \tabularnewline
1606.88010234529 \tabularnewline
4318.4520135954 \tabularnewline
1032.15243514712 \tabularnewline
-3350.51954264967 \tabularnewline
-1340.5571412591 \tabularnewline
-3088.35238605954 \tabularnewline
300.580374776596 \tabularnewline
293.54619674322 \tabularnewline
-1602.08246820113 \tabularnewline
1439.49507814654 \tabularnewline
-580.816368857058 \tabularnewline
-383.536598257972 \tabularnewline
-2384.4464041482 \tabularnewline
-2590.46774356446 \tabularnewline
-377.941597339913 \tabularnewline
1747.93589869771 \tabularnewline
2882.1139042039 \tabularnewline
-2045.57576297071 \tabularnewline
664.785089980978 \tabularnewline
-572.935775582083 \tabularnewline
-2775.3871279486 \tabularnewline
1377.34773803354 \tabularnewline
-1177.09924556024 \tabularnewline
2449.23534368347 \tabularnewline
2142.72583371508 \tabularnewline
1925.6037593775 \tabularnewline
-2096.74851904773 \tabularnewline
2635.060137886 \tabularnewline
-2773.15313339022 \tabularnewline
-1626.61095690437 \tabularnewline
-22.199354681843 \tabularnewline
-1113.67679526615 \tabularnewline
-379.38573890747 \tabularnewline
214.921504317647 \tabularnewline
-2198.64612159674 \tabularnewline
2107.24686564597 \tabularnewline
-848.930729125202 \tabularnewline
-1399.70438207406 \tabularnewline
-685.450951113662 \tabularnewline
2655.00427853763 \tabularnewline
1437.88304121967 \tabularnewline
437.659977682341 \tabularnewline
99.9357179962184 \tabularnewline
41.538276800582 \tabularnewline
1522.92178325679 \tabularnewline
560.821647770856 \tabularnewline
-835.154089988334 \tabularnewline
733.30218772744 \tabularnewline
1974.66860999601 \tabularnewline
-2715.44632305829 \tabularnewline
3691.22987495263 \tabularnewline
918.44344922326 \tabularnewline
-580.854268099377 \tabularnewline
-561.294491318362 \tabularnewline
-1198.15006024829 \tabularnewline
137.186118854002 \tabularnewline
-503.499944475407 \tabularnewline
-2872.68279709216 \tabularnewline
-46.4832527181729 \tabularnewline
-3533.44767792199 \tabularnewline
-1624.18056493991 \tabularnewline
-926.448432957393 \tabularnewline
404.454088361092 \tabularnewline
-1260.08513536335 \tabularnewline
-189.886699916158 \tabularnewline
1767.58167331388 \tabularnewline
-33.5786338525624 \tabularnewline
725.122384046292 \tabularnewline
611.922342208331 \tabularnewline
938.16057705886 \tabularnewline
2100.19454221938 \tabularnewline
-2957.86050816053 \tabularnewline
-631.946586252947 \tabularnewline
4111.6739416117 \tabularnewline
3630.08993834845 \tabularnewline
1019.46984867979 \tabularnewline
2061.79736878511 \tabularnewline
-695.097665127584 \tabularnewline
1322.63952324839 \tabularnewline
-2174.85176952603 \tabularnewline
655.518360811491 \tabularnewline
2861.67894332422 \tabularnewline
\hline
\end{tabular}
%Source: https://freestatistics.org/blog/index.php?pk=113409&T=2

[TABLE]
[ROW][C]Estimated ARIMA Residuals[/C][/ROW]
[ROW][C]Value[/C][/ROW]
[ROW][C]-61.5854068680149[/C][/ROW]
[ROW][C]-4380.19829167651[/C][/ROW]
[ROW][C]1606.88010234529[/C][/ROW]
[ROW][C]4318.4520135954[/C][/ROW]
[ROW][C]1032.15243514712[/C][/ROW]
[ROW][C]-3350.51954264967[/C][/ROW]
[ROW][C]-1340.5571412591[/C][/ROW]
[ROW][C]-3088.35238605954[/C][/ROW]
[ROW][C]300.580374776596[/C][/ROW]
[ROW][C]293.54619674322[/C][/ROW]
[ROW][C]-1602.08246820113[/C][/ROW]
[ROW][C]1439.49507814654[/C][/ROW]
[ROW][C]-580.816368857058[/C][/ROW]
[ROW][C]-383.536598257972[/C][/ROW]
[ROW][C]-2384.4464041482[/C][/ROW]
[ROW][C]-2590.46774356446[/C][/ROW]
[ROW][C]-377.941597339913[/C][/ROW]
[ROW][C]1747.93589869771[/C][/ROW]
[ROW][C]2882.1139042039[/C][/ROW]
[ROW][C]-2045.57576297071[/C][/ROW]
[ROW][C]664.785089980978[/C][/ROW]
[ROW][C]-572.935775582083[/C][/ROW]
[ROW][C]-2775.3871279486[/C][/ROW]
[ROW][C]1377.34773803354[/C][/ROW]
[ROW][C]-1177.09924556024[/C][/ROW]
[ROW][C]2449.23534368347[/C][/ROW]
[ROW][C]2142.72583371508[/C][/ROW]
[ROW][C]1925.6037593775[/C][/ROW]
[ROW][C]-2096.74851904773[/C][/ROW]
[ROW][C]2635.060137886[/C][/ROW]
[ROW][C]-2773.15313339022[/C][/ROW]
[ROW][C]-1626.61095690437[/C][/ROW]
[ROW][C]-22.199354681843[/C][/ROW]
[ROW][C]-1113.67679526615[/C][/ROW]
[ROW][C]-379.38573890747[/C][/ROW]
[ROW][C]214.921504317647[/C][/ROW]
[ROW][C]-2198.64612159674[/C][/ROW]
[ROW][C]2107.24686564597[/C][/ROW]
[ROW][C]-848.930729125202[/C][/ROW]
[ROW][C]-1399.70438207406[/C][/ROW]
[ROW][C]-685.450951113662[/C][/ROW]
[ROW][C]2655.00427853763[/C][/ROW]
[ROW][C]1437.88304121967[/C][/ROW]
[ROW][C]437.659977682341[/C][/ROW]
[ROW][C]99.9357179962184[/C][/ROW]
[ROW][C]41.538276800582[/C][/ROW]
[ROW][C]1522.92178325679[/C][/ROW]
[ROW][C]560.821647770856[/C][/ROW]
[ROW][C]-835.154089988334[/C][/ROW]
[ROW][C]733.30218772744[/C][/ROW]
[ROW][C]1974.66860999601[/C][/ROW]
[ROW][C]-2715.44632305829[/C][/ROW]
[ROW][C]3691.22987495263[/C][/ROW]
[ROW][C]918.44344922326[/C][/ROW]
[ROW][C]-580.854268099377[/C][/ROW]
[ROW][C]-561.294491318362[/C][/ROW]
[ROW][C]-1198.15006024829[/C][/ROW]
[ROW][C]137.186118854002[/C][/ROW]
[ROW][C]-503.499944475407[/C][/ROW]
[ROW][C]-2872.68279709216[/C][/ROW]
[ROW][C]-46.4832527181729[/C][/ROW]
[ROW][C]-3533.44767792199[/C][/ROW]
[ROW][C]-1624.18056493991[/C][/ROW]
[ROW][C]-926.448432957393[/C][/ROW]
[ROW][C]404.454088361092[/C][/ROW]
[ROW][C]-1260.08513536335[/C][/ROW]
[ROW][C]-189.886699916158[/C][/ROW]
[ROW][C]1767.58167331388[/C][/ROW]
[ROW][C]-33.5786338525624[/C][/ROW]
[ROW][C]725.122384046292[/C][/ROW]
[ROW][C]611.922342208331[/C][/ROW]
[ROW][C]938.16057705886[/C][/ROW]
[ROW][C]2100.19454221938[/C][/ROW]
[ROW][C]-2957.86050816053[/C][/ROW]
[ROW][C]-631.946586252947[/C][/ROW]
[ROW][C]4111.6739416117[/C][/ROW]
[ROW][C]3630.08993834845[/C][/ROW]
[ROW][C]1019.46984867979[/C][/ROW]
[ROW][C]2061.79736878511[/C][/ROW]
[ROW][C]-695.097665127584[/C][/ROW]
[ROW][C]1322.63952324839[/C][/ROW]
[ROW][C]-2174.85176952603[/C][/ROW]
[ROW][C]655.518360811491[/C][/ROW]
[ROW][C]2861.67894332422[/C][/ROW]
[/TABLE]
Source: https://freestatistics.org/blog/index.php?pk=113409&T=2

Globally Unique Identifier (entire table): ba.freestatistics.org/blog/index.php?pk=113409&T=2

As an alternative you can also use a QR Code:  

The GUIDs for individual cells are displayed in the table below:

Estimated ARIMA Residuals
Value
-61.5854068680149
-4380.19829167651
1606.88010234529
4318.4520135954
1032.15243514712
-3350.51954264967
-1340.5571412591
-3088.35238605954
300.580374776596
293.54619674322
-1602.08246820113
1439.49507814654
-580.816368857058
-383.536598257972
-2384.4464041482
-2590.46774356446
-377.941597339913
1747.93589869771
2882.1139042039
-2045.57576297071
664.785089980978
-572.935775582083
-2775.3871279486
1377.34773803354
-1177.09924556024
2449.23534368347
2142.72583371508
1925.6037593775
-2096.74851904773
2635.060137886
-2773.15313339022
-1626.61095690437
-22.199354681843
-1113.67679526615
-379.38573890747
214.921504317647
-2198.64612159674
2107.24686564597
-848.930729125202
-1399.70438207406
-685.450951113662
2655.00427853763
1437.88304121967
437.659977682341
99.9357179962184
41.538276800582
1522.92178325679
560.821647770856
-835.154089988334
733.30218772744
1974.66860999601
-2715.44632305829
3691.22987495263
918.44344922326
-580.854268099377
-561.294491318362
-1198.15006024829
137.186118854002
-503.499944475407
-2872.68279709216
-46.4832527181729
-3533.44767792199
-1624.18056493991
-926.448432957393
404.454088361092
-1260.08513536335
-189.886699916158
1767.58167331388
-33.5786338525624
725.122384046292
611.922342208331
938.16057705886
2100.19454221938
-2957.86050816053
-631.946586252947
4111.6739416117
3630.08993834845
1019.46984867979
2061.79736878511
-695.097665127584
1322.63952324839
-2174.85176952603
655.518360811491
2861.67894332422


Parameters (Session):
par1 = 12 ;
Parameters (R input):
par1 = FALSE ; par2 = 1 ; par3 = 1 ; par4 = 1 ; par5 = 12 ; par6 = 2 ; par7 = 1 ; par8 = 2 ; par9 = 1 ;
R code (references can be found in the software module):
library(lattice)
if (par1 == 'TRUE') par1 <- TRUE
if (par1 == 'FALSE') par1 <- FALSE
par2 <- as.numeric(par2) #Box-Cox lambda transformation parameter
par3 <- as.numeric(par3) #degree of non-seasonal differencing
par4 <- as.numeric(par4) #degree of seasonal differencing
par5 <- as.numeric(par5) #seasonal period
par6 <- as.numeric(par6) #degree (p) of the non-seasonal AR(p) polynomial
par7 <- as.numeric(par7) #degree (q) of the non-seasonal MA(q) polynomial
par8 <- as.numeric(par8) #degree (P) of the seasonal AR(P) polynomial
par9 <- as.numeric(par9) #degree (Q) of the seasonal MA(Q) polynomial
armaGR <- function(arima.out, names, n){
try1 <- arima.out$coef
try2 <- sqrt(diag(arima.out$var.coef))
try.data.frame <- data.frame(matrix(NA,ncol=4,nrow=length(names)))
dimnames(try.data.frame) <- list(names,c('coef','std','tstat','pv'))
try.data.frame[,1] <- try1
for(i in 1:length(try2)) try.data.frame[which(rownames(try.data.frame)==names(try2)[i]),2] <- try2[i]
try.data.frame[,3] <- try.data.frame[,1] / try.data.frame[,2]
try.data.frame[,4] <- round((1-pt(abs(try.data.frame[,3]),df=n-(length(try2)+1)))*2,5)
vector <- rep(NA,length(names))
vector[is.na(try.data.frame[,4])] <- 0
maxi <- which.max(try.data.frame[,4])
continue <- max(try.data.frame[,4],na.rm=TRUE) > .05
vector[maxi] <- 0
list(summary=try.data.frame,next.vector=vector,continue=continue)
}
arimaSelect <- function(series, order=c(13,0,0), seasonal=list(order=c(2,0,0),period=12), include.mean=F){
nrc <- order[1]+order[3]+seasonal$order[1]+seasonal$order[3]
coeff <- matrix(NA, nrow=nrc*2, ncol=nrc)
pval <- matrix(NA, nrow=nrc*2, ncol=nrc)
mylist <- rep(list(NULL), nrc)
names <- NULL
if(order[1] > 0) names <- paste('ar',1:order[1],sep='')
if(order[3] > 0) names <- c( names , paste('ma',1:order[3],sep='') )
if(seasonal$order[1] > 0) names <- c(names, paste('sar',1:seasonal$order[1],sep=''))
if(seasonal$order[3] > 0) names <- c(names, paste('sma',1:seasonal$order[3],sep=''))
arima.out <- arima(series, order=order, seasonal=seasonal, include.mean=include.mean, method='ML')
mylist[[1]] <- arima.out
last.arma <- armaGR(arima.out, names, length(series))
mystop <- FALSE
i <- 1
coeff[i,] <- last.arma[[1]][,1]
pval [i,] <- last.arma[[1]][,4]
i <- 2
aic <- arima.out$aic
while(!mystop){
mylist[[i]] <- arima.out
arima.out <- arima(series, order=order, seasonal=seasonal, include.mean=include.mean, method='ML', fixed=last.arma$next.vector)
aic <- c(aic, arima.out$aic)
last.arma <- armaGR(arima.out, names, length(series))
mystop <- !last.arma$continue
coeff[i,] <- last.arma[[1]][,1]
pval [i,] <- last.arma[[1]][,4]
i <- i+1
}
list(coeff, pval, mylist, aic=aic)
}
arimaSelectplot <- function(arimaSelect.out,noms,choix){
noms <- names(arimaSelect.out[[3]][[1]]$coef)
coeff <- arimaSelect.out[[1]]
k <- min(which(is.na(coeff[,1])))-1
coeff <- coeff[1:k,]
pval <- arimaSelect.out[[2]][1:k,]
aic <- arimaSelect.out$aic[1:k]
coeff[coeff==0] <- NA
n <- ncol(coeff)
if(missing(choix)) choix <- k
layout(matrix(c(1,1,1,2,
3,3,3,2,
3,3,3,4,
5,6,7,7),nr=4),
widths=c(10,35,45,15),
heights=c(30,30,15,15))
couleurs <- rainbow(75)[1:50]#(50)
ticks <- pretty(coeff)
par(mar=c(1,1,3,1))
plot(aic,k:1-.5,type='o',pch=21,bg='blue',cex=2,axes=F,lty=2,xpd=NA)
points(aic[choix],k-choix+.5,pch=21,cex=4,bg=2,xpd=NA)
title('aic',line=2)
par(mar=c(3,0,0,0))
plot(0,axes=F,xlab='',ylab='',xlim=range(ticks),ylim=c(.1,1))
rect(xleft = min(ticks) + (0:49)/50*(max(ticks)-min(ticks)),
xright = min(ticks) + (1:50)/50*(max(ticks)-min(ticks)),
ytop = rep(1,50),
ybottom= rep(0,50),col=couleurs,border=NA)
axis(1,ticks)
rect(xleft=min(ticks),xright=max(ticks),ytop=1,ybottom=0)
text(mean(coeff,na.rm=T),.5,'coefficients',cex=2,font=2)
par(mar=c(1,1,3,1))
image(1:n,1:k,t(coeff[k:1,]),axes=F,col=couleurs,zlim=range(ticks))
for(i in 1:n) for(j in 1:k) if(!is.na(coeff[j,i])) {
if(pval[j,i]<.01) symb = 'green'
else if( (pval[j,i]<.05) & (pval[j,i]>=.01)) symb = 'orange'
else if( (pval[j,i]<.1) & (pval[j,i]>=.05)) symb = 'red'
else symb = 'black'
polygon(c(i+.5 ,i+.2 ,i+.5 ,i+.5),
c(k-j+0.5,k-j+0.5,k-j+0.8,k-j+0.5),
col=symb)
if(j==choix) {
rect(xleft=i-.5,
xright=i+.5,
ybottom=k-j+1.5,
ytop=k-j+.5,
lwd=4)
text(i,
k-j+1,
round(coeff[j,i],2),
cex=1.2,
font=2)
}
else{
rect(xleft=i-.5,xright=i+.5,ybottom=k-j+1.5,ytop=k-j+.5)
text(i,k-j+1,round(coeff[j,i],2),cex=1.2,font=1)
}
}
axis(3,1:n,noms)
par(mar=c(0.5,0,0,0.5))
plot(0,axes=F,xlab='',ylab='',type='n',xlim=c(0,8),ylim=c(-.2,.8))
cols <- c('green','orange','red','black')
niv <- c('0','0.01','0.05','0.1')
for(i in 0:3){
polygon(c(1+2*i ,1+2*i ,1+2*i-.5 ,1+2*i),
c(.4 ,.7 , .4 , .4),
col=cols[i+1])
text(2*i,0.5,niv[i+1],cex=1.5)
}
text(8,.5,1,cex=1.5)
text(4,0,'p-value',cex=2)
box()
residus <- arimaSelect.out[[3]][[choix]]$res
par(mar=c(1,2,4,1))
acf(residus,main='')
title('acf',line=.5)
par(mar=c(1,2,4,1))
pacf(residus,main='')
title('pacf',line=.5)
par(mar=c(2,2,4,1))
qqnorm(residus,main='')
title('qq-norm',line=.5)
qqline(residus)
residus
}
if (par2 == 0) x <- log(x)
if (par2 != 0) x <- x^par2
(selection <- arimaSelect(x, order=c(par6,par3,par7), seasonal=list(order=c(par8,par4,par9), period=par5)))
bitmap(file='test1.png')
resid <- arimaSelectplot(selection)
dev.off()
resid
bitmap(file='test2.png')
acf(resid,length(resid)/2, main='Residual Autocorrelation Function')
dev.off()
bitmap(file='test3.png')
pacf(resid,length(resid)/2, main='Residual Partial Autocorrelation Function')
dev.off()
bitmap(file='test4.png')
cpgram(resid, main='Residual Cumulative Periodogram')
dev.off()
bitmap(file='test5.png')
hist(resid, main='Residual Histogram', xlab='values of Residuals')
dev.off()
bitmap(file='test6.png')
densityplot(~resid,col='black',main='Residual Density Plot', xlab='values of Residuals')
dev.off()
bitmap(file='test7.png')
qqnorm(resid, main='Residual Normal Q-Q Plot')
qqline(resid)
dev.off()
ncols <- length(selection[[1]][1,])
nrows <- length(selection[[2]][,1])-1
load(file='createtable')
a<-table.start()
a<-table.row.start(a)
a<-table.element(a,'ARIMA Parameter Estimation and Backward Selection', ncols+1,TRUE)
a<-table.row.end(a)
a<-table.row.start(a)
a<-table.element(a,'Iteration', header=TRUE)
for (i in 1:ncols) {
a<-table.element(a,names(selection[[3]][[1]]$coef)[i],header=TRUE)
}
a<-table.row.end(a)
for (j in 1:nrows) {
a<-table.row.start(a)
mydum <- 'Estimates ('
mydum <- paste(mydum,j)
mydum <- paste(mydum,')')
a<-table.element(a,mydum, header=TRUE)
for (i in 1:ncols) {
a<-table.element(a,round(selection[[1]][j,i],4))
}
a<-table.row.end(a)
a<-table.row.start(a)
a<-table.element(a,'(p-val)', header=TRUE)
for (i in 1:ncols) {
mydum <- '('
mydum <- paste(mydum,round(selection[[2]][j,i],4),sep='')
mydum <- paste(mydum,')')
a<-table.element(a,mydum)
}
a<-table.row.end(a)
}
a<-table.end(a)
table.save(a,file='mytable.tab')
a<-table.start()
a<-table.row.start(a)
a<-table.element(a,'Estimated ARIMA Residuals', 1,TRUE)
a<-table.row.end(a)
a<-table.row.start(a)
a<-table.element(a,'Value', 1,TRUE)
a<-table.row.end(a)
for (i in (par4*par5+par3):length(resid)) {
a<-table.row.start(a)
a<-table.element(a,resid[i])
a<-table.row.end(a)
}
a<-table.end(a)
table.save(a,file='mytable1.tab')