Free Statistics

of Irreproducible Research!

Author's title

Author*Unverified author*
R Software Modulerwasp_notchedbox1.wasp
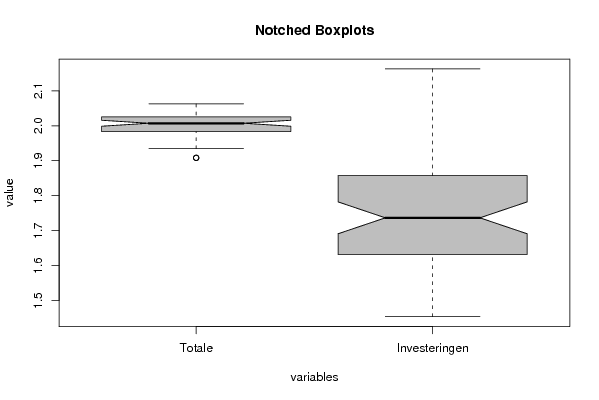
Title produced by softwareNotched Boxplots
Date of computationWed, 29 Oct 2008 10:49:14 -0600
Cite this page as followsStatistical Computations at FreeStatistics.org, Office for Research Development and Education, URL https://freestatistics.org/blog/index.php?v=date/2008/Oct/29/t1225299108h1x1n74ilwjwqyu.htm/, Retrieved Tue, 14 May 2024 21:19:45 +0000
Statistical Computations at FreeStatistics.org, Office for Research Development and Education, URL https://freestatistics.org/blog/index.php?pk=19910, Retrieved Tue, 14 May 2024 21:19:45 +0000
QR Codes:

Original text written by user:
IsPrivate?No (this computation is public)
User-defined keywords
Estimated Impact208
Family? (F = Feedback message, R = changed R code, M = changed R Module, P = changed Parameters, D = changed Data)
F     [Notched Boxplots] [workshop 3] [2007-10-26 13:31:48] [e9ffc5de6f8a7be62f22b142b5b6b1a8]
F    D  [Notched Boxplots] [Mediaan kledij < ...] [2008-10-29 13:57:22] [495cd80c1a9baafb03c09cd9ab8d8fb5]
F   PD    [Notched Boxplots] [Mediaan investeri...] [2008-10-29 15:49:49] [495cd80c1a9baafb03c09cd9ab8d8fb5]
F    D        [Notched Boxplots] [Logaritmen mediaa...] [2008-10-29 16:49:14] [46e0445318a71ab85f6f82e54c656dac] [Current]
Feedback Forum
2008-11-06 16:51:41 [Bas van Keken] [reply
'unverified author'

Hier had u de vier kolommen opnieuw moeten invoeren. Vervolgens had u de R-code moeten aanpassen door z te vervangen door log(z). Zie hieronder een link voor een voorbeeld:
https://automated.biganalytics.eu/rwasp_notchedbox1.wasp
2008-11-08 10:48:51 [Gert De la Haye] [reply
gewoon ineens in de r-code z vervangen door log(z) en dan krijg je een afgevlakte grafiek te zien!
2008-11-08 15:48:02 [Kim Huysmans] [reply
Door de logaritme in te vullen in de R-code worden grote getallen kleiner, ouliers komen dichter naar het gemiddelde, grote en kleine schommelingen worden aangepast en de spreiding wordt kleiner
2008-11-09 16:22:48 [8e2cc0b2ef568da46d009b2f601285b2] [reply
Foutief geblogged -> mogelijk pass niet ingevuld?

Zoals vorige oefening niet alle 4 de reeksen ingevuld.

De reeksen moesten niet aangepast worden in excel zoals u in uw document vermeld maar er moest een aanpassing gebeuren in de R-code. namelijk:

z <- as.data.frame(t(y)) (orginele 1ste regel)
log(z) <- as.data.frame(t(y)) (vervangen door dit)

ofwel log() rond de z plaatsen.
Door het logaritme van een getal te nemen vlak je de hoge outliers.
2008-11-10 21:25:31 [Chi-Kwong Man] [reply
Zoals de vorige studenten reeds hebben vermeld R-code aanpassen. Logaritme zorgt ervoor dat grote getallen kleiner worden, dus m.a.w. dataset wordt afgevlakt en spreiding wordt verkleint.
2008-11-11 19:57:53 [An De Koninck] [reply
Ik had inderdaad de R-code moeten aanpassen (naar log(z) <- as.data.frame(t(y)))

Ik had dan volgende conclusies kunnen trekken:
- voor elke spreiding gaat men een waarde bepalen en deze dan optellen of aftrekken van de mediaan waardoor de getallen kleiner worden.
- de extreme waarden worden afgevlakt (dus zal de seizonaliteit afnemen en zullen de outliers niet meer zo extreem zijn).

Post a new message
Dataseries X:
2.042969	1.860338
1.984077	1.773786
2.008174	1.932981
2.026125	1.945469
1.908485	1.79796
1.97635	1.939519
2.004321	1.898725
2.039017	2.049218
2.009876	1.898725
1.957607	2.120903
1.983175	1.603144
1.982723	1.838849
2.025306	1.773786
2.013259	1.868056
2.0086	1.758912
2.019947	1.909021
1.934498	1.668386
1.96426	1.617
2.028978	1.85248
2.051538	1.83187
2.007321	1.857332
1.963788	2.162863
1.988559	1.598791
1.986772	1.715167
2.022841	1.867467
2.01157	1.850646
1.991669	1.783904
2.019116	1.78533
1.941511	1.736397
1.95376	1.592177
2.040602	1.823474
2.048053	1.767156
1.993877	1.776701
1.986324	1.907949
1.978181	1.571709
1.986772	1.649335
2.051924	1.687529
2.012415	1.732394
1.988559	1.694605
2.046885	1.789581
1.941511	1.544068
1.985875	1.552668
2.057286	1.710117
2.042576	1.690196
2.016616	1.618048
2.006894	1.860338
1.975891	1.624282
1.981819	1.644439
2.019947	1.654177
2.011993	1.701568
1.991669	1.611723
2.056524	1.673942
1.907949	1.567026
1.980912	1.611723
2.053846	1.583199
2.024896	1.665581
2.036629	1.453318
2.009876	1.894316
1.995635	1.565848
2.003029	1.705008
2.062582	1.631444


Summary of computational transaction
Raw Inputview raw input (R code)
Raw Outputview raw output of R engine
Computing time2 seconds
R Server'Sir Ronald Aylmer Fisher' @ 193.190.124.24

\begin{tabular}{lllllllll}
\hline
Summary of computational transaction \tabularnewline
Raw Input & view raw input (R code)  \tabularnewline
Raw Output & view raw output of R engine  \tabularnewline
Computing time & 2 seconds \tabularnewline
R Server & 'Sir Ronald Aylmer Fisher' @ 193.190.124.24 \tabularnewline
\hline
\end{tabular}
%Source: https://freestatistics.org/blog/index.php?pk=19910&T=0

[TABLE]
[ROW][C]Summary of computational transaction[/C][/ROW]
[ROW][C]Raw Input[/C][C]view raw input (R code) [/C][/ROW]
[ROW][C]Raw Output[/C][C]view raw output of R engine [/C][/ROW]
[ROW][C]Computing time[/C][C]2 seconds[/C][/ROW]
[ROW][C]R Server[/C][C]'Sir Ronald Aylmer Fisher' @ 193.190.124.24[/C][/ROW]
[/TABLE]
Source: https://freestatistics.org/blog/index.php?pk=19910&T=0

Globally Unique Identifier (entire table): ba.freestatistics.org/blog/index.php?pk=19910&T=0

As an alternative you can also use a QR Code:  

The GUIDs for individual cells are displayed in the table below:

Summary of computational transaction
Raw Inputview raw input (R code)
Raw Outputview raw output of R engine
Computing time2 seconds
R Server'Sir Ronald Aylmer Fisher' @ 193.190.124.24


Boxplot statistics
Variablelower whiskerlower hingemedianupper hingeupper whisker
Totale1.9344981.9831752.0073212.0253062.062582
Investeringen1.4533181.6314441.7363971.8573322.162863

\begin{tabular}{lllllllll}
\hline
Boxplot statistics \tabularnewline
Variable & lower whisker & lower hinge & median & upper hinge & upper whisker \tabularnewline
Totale & 1.934498 & 1.983175 & 2.007321 & 2.025306 & 2.062582 \tabularnewline
Investeringen & 1.453318 & 1.631444 & 1.736397 & 1.857332 & 2.162863 \tabularnewline
\hline
\end{tabular}
%Source: https://freestatistics.org/blog/index.php?pk=19910&T=1

[TABLE]
[ROW][C]Boxplot statistics[/C][/ROW]
[ROW][C]Variable[/C][C]lower whisker[/C][C]lower hinge[/C][C]median[/C][C]upper hinge[/C][C]upper whisker[/C][/ROW]
[ROW][C]Totale[/C][C]1.934498[/C][C]1.983175[/C][C]2.007321[/C][C]2.025306[/C][C]2.062582[/C][/ROW]
[ROW][C]Investeringen[/C][C]1.453318[/C][C]1.631444[/C][C]1.736397[/C][C]1.857332[/C][C]2.162863[/C][/ROW]
[/TABLE]
Source: https://freestatistics.org/blog/index.php?pk=19910&T=1

Globally Unique Identifier (entire table): ba.freestatistics.org/blog/index.php?pk=19910&T=1

As an alternative you can also use a QR Code:  

The GUIDs for individual cells are displayed in the table below:

Boxplot statistics
Variablelower whiskerlower hingemedianupper hingeupper whisker
Totale1.9344981.9831752.0073212.0253062.062582
Investeringen1.4533181.6314441.7363971.8573322.162863


Boxplot Notches
Variablelower boundmedianupper bound
Totale1.998797971574242.0073212.01584402842576
Investeringen1.690700248319831.7363971.78209375168017

\begin{tabular}{lllllllll}
\hline
Boxplot Notches \tabularnewline
Variable & lower bound & median & upper bound \tabularnewline
Totale & 1.99879797157424 & 2.007321 & 2.01584402842576 \tabularnewline
Investeringen & 1.69070024831983 & 1.736397 & 1.78209375168017 \tabularnewline
\hline
\end{tabular}
%Source: https://freestatistics.org/blog/index.php?pk=19910&T=2

[TABLE]
[ROW][C]Boxplot Notches[/C][/ROW]
[ROW][C]Variable[/C][C]lower bound[/C][C]median[/C][C]upper bound[/C][/ROW]
[ROW][C]Totale[/C][C]1.99879797157424[/C][C]2.007321[/C][C]2.01584402842576[/C][/ROW]
[ROW][C]Investeringen[/C][C]1.69070024831983[/C][C]1.736397[/C][C]1.78209375168017[/C][/ROW]
[/TABLE]
Source: https://freestatistics.org/blog/index.php?pk=19910&T=2

Globally Unique Identifier (entire table): ba.freestatistics.org/blog/index.php?pk=19910&T=2

As an alternative you can also use a QR Code:  

The GUIDs for individual cells are displayed in the table below:

Boxplot Notches
Variablelower boundmedianupper bound
Totale1.998797971574242.0073212.01584402842576
Investeringen1.690700248319831.7363971.78209375168017


Parameters (Session):
par1 = 500 ; par2 = 12 ;
Parameters (R input):
par1 = grey ;
R code (references can be found in the software module):
z <- as.data.frame(t(y))
bitmap(file='test1.png')
(r<-boxplot(z ,xlab=xlab,ylab=ylab,main=main,notch=TRUE,col=par1))
dev.off()
load(file='createtable')
a<-table.start()
a<-table.row.start(a)
a<-table.element(a,hyperlink('overview.htm','Boxplot statistics','Boxplot overview'),6,TRUE)
a<-table.row.end(a)
a<-table.row.start(a)
a<-table.element(a,'Variable',1,TRUE)
a<-table.element(a,hyperlink('lower_whisker.htm','lower whisker','definition of lower whisker'),1,TRUE)
a<-table.element(a,hyperlink('lower_hinge.htm','lower hinge','definition of lower hinge'),1,TRUE)
a<-table.element(a,hyperlink('central_tendency.htm','median','definitions about measures of central tendency'),1,TRUE)
a<-table.element(a,hyperlink('upper_hinge.htm','upper hinge','definition of upper hinge'),1,TRUE)
a<-table.element(a,hyperlink('upper_whisker.htm','upper whisker','definition of upper whisker'),1,TRUE)
a<-table.row.end(a)
for (i in 1:length(y[,1]))
{
a<-table.row.start(a)
a<-table.element(a,dimnames(t(x))[[2]][i],1,TRUE)
for (j in 1:5)
{
a<-table.element(a,r$stats[j,i])
}
a<-table.row.end(a)
}
a<-table.end(a)
table.save(a,file='mytable.tab')
a<-table.start()
a<-table.row.start(a)
a<-table.element(a,'Boxplot Notches',4,TRUE)
a<-table.row.end(a)
a<-table.row.start(a)
a<-table.element(a,'Variable',1,TRUE)
a<-table.element(a,'lower bound',1,TRUE)
a<-table.element(a,'median',1,TRUE)
a<-table.element(a,'upper bound',1,TRUE)
a<-table.row.end(a)
for (i in 1:length(y[,1]))
{
a<-table.row.start(a)
a<-table.element(a,dimnames(t(x))[[2]][i],1,TRUE)
a<-table.element(a,r$conf[1,i])
a<-table.element(a,r$stats[3,i])
a<-table.element(a,r$conf[2,i])
a<-table.row.end(a)
}
a<-table.end(a)
table.save(a,file='mytable1.tab')