Free Statistics

of Irreproducible Research!

Author's title

Author*The author of this computation has been verified*
R Software Modulerwasp_hierarchicalclustering.wasp
Title produced by softwareHierarchical Clustering
Date of computationWed, 12 Nov 2008 04:21:49 -0700
Cite this page as followsStatistical Computations at FreeStatistics.org, Office for Research Development and Education, URL https://freestatistics.org/blog/index.php?v=date/2008/Nov/12/t1226489016bhqo7c0fckz6i7r.htm/, Retrieved Sat, 18 May 2024 00:45:41 +0000
Statistical Computations at FreeStatistics.org, Office for Research Development and Education, URL https://freestatistics.org/blog/index.php?pk=24133, Retrieved Sat, 18 May 2024 00:45:41 +0000
QR Codes:

Original text written by user:
IsPrivate?No (this computation is public)
User-defined keywordsopdracht 6
Estimated Impact213
Family? (F = Feedback message, R = changed R code, M = changed R Module, P = changed Parameters, D = changed Data)
-     [(Partial) Autocorrelation Function] [omzet] [2007-12-03 11:20:48] [8eeeb1b102d3219870922ae6f80f1f57]
F   PD  [(Partial) Autocorrelation Function] [Various EDA topic...] [2008-11-12 10:44:14] [c29178f7f550574a75dc881e636e0923]
F RMPD      [Hierarchical Clustering] [hierarchial clust...] [2008-11-12 11:21:49] [3efbb18563b4564408d69b3c9a8e9a6e] [Current]
Feedback Forum
2008-11-15 08:58:08 [Tamara Witters] [reply
Juist!
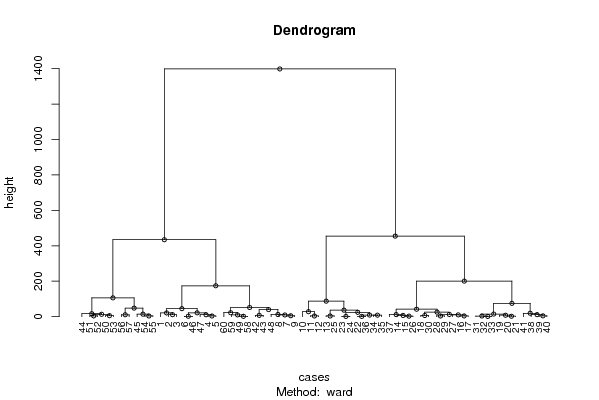
Met deze clusteringtechniek gaat men zien welke observaties als gemeenschappelijk kunnen gezien worden in een bepaalde periode. In dit geval vallen de observaties in 2 groepen en deze groepen zijn telkens nog eens onderverdeeld in verschillende categorieën tot men op 1 observatie komt. Meestal gebruikt men deze techniek voor niet-tijdreeksen vb: hulpmiddel voor de marketing (vb marktsegmentatie).
2008-11-16 16:53:57 [Kevin Truyts] [reply
De student heeft een juiste conclusie genomen. Hier kunnen we namelijk nagaan welke gegevens gelijkaardig zijn en welke niet of minder gelijkenissen vertonen. Hoe dichter tegen nul, hoe meer gelijkenissen de gegevens vertonen.
2008-11-24 14:34:29 [Bernard Femont] [reply
Met deze clusteringtechniek gaat men zien welke observaties als gemeenschappelijk kunnen gezien worden in een bepaalde periode. In dit geval vallen de observaties in 2 groepen en deze groepen zijn telkens nog eens onderverdeeld in verschillende categorieën tot men op 1 observatie komt. Meestal gebruikt men deze techniek voor niet-tijdreeksen vb: hulpmiddel voor de marketing (vb marktsegmentatie).Hier kunnen we namelijk nagaan welke gegevens gelijkaardig zijn en welke niet of minder gelijkenissen vertonen. Hoe dichter tegen nul, hoe meer gelijkenissen de gegevens vertonen.

Post a new message
Dataseries X:
565	148	418
547	138	410
555	137	418
562	136	426
561	133	428
555	126	430
544	120	424
537	114	423
543	116	427
594	153	441
611	162	449
613	161	452
611	149	462
594	139	455
595	135	461
591	130	461
589	127	463
584	122	462
573	117	456
567	112	455
569	113	456
621	149	472
629	157	472
628	157	471
612	147	465
595	137	459
597	132	465
593	125	468
590	123	467
580	117	463
574	114	460
573	111	462
573	112	461
620	144	476
626	150	476
620	149	471
588	134	453
566	123	443
557	116	442
561	117	444
549	111	438
532	105	427
526	102	424
511	95	416
499	93	406
555	124	431
565	130	434
542	124	418
527	115	412
510	106	404
514	105	409
517	105	412
508	101	406
493	95	398
490	93	397
469	84	385
478	87	390
528	116	413
534	120	413
518	117	401


Summary of computational transaction
Raw Inputview raw input (R code)
Raw Outputview raw output of R engine
Computing time2 seconds
R Server'George Udny Yule' @ 72.249.76.132

\begin{tabular}{lllllllll}
\hline
Summary of computational transaction \tabularnewline
Raw Input & view raw input (R code)  \tabularnewline
Raw Output & view raw output of R engine  \tabularnewline
Computing time & 2 seconds \tabularnewline
R Server & 'George Udny Yule' @ 72.249.76.132 \tabularnewline
\hline
\end{tabular}
%Source: https://freestatistics.org/blog/index.php?pk=24133&T=0

[TABLE]
[ROW][C]Summary of computational transaction[/C][/ROW]
[ROW][C]Raw Input[/C][C]view raw input (R code) [/C][/ROW]
[ROW][C]Raw Output[/C][C]view raw output of R engine [/C][/ROW]
[ROW][C]Computing time[/C][C]2 seconds[/C][/ROW]
[ROW][C]R Server[/C][C]'George Udny Yule' @ 72.249.76.132[/C][/ROW]
[/TABLE]
Source: https://freestatistics.org/blog/index.php?pk=24133&T=0

Globally Unique Identifier (entire table): ba.freestatistics.org/blog/index.php?pk=24133&T=0

As an alternative you can also use a QR Code:  

The GUIDs for individual cells are displayed in the table below:

Summary of computational transaction
Raw Inputview raw input (R code)
Raw Outputview raw output of R engine
Computing time2 seconds
R Server'George Udny Yule' @ 72.249.76.132


Summary of Dendrogram
LabelHeight
11.41421356237310
21.41421356237310
31.41421356237310
41.73205080756888
52.23606797749979
62.44948974278318
72.82842712474619
83.65602689891371
93.74165738677394
103.74165738677394
113.74165738677394
123.74165738677394
133.74165738677394
144.12310562561766
154.24264068711928
164.58257569495584
175.09901951359278
185.74456264653803
196.48074069840786
206.96564801457551
217.34846922834953
228.20407816807507
238.48528137423857
249.00353107304067
259.47161567483146
2610.0035541233253
2710.0436084811547
2810.7238052947636
2910.9198183276202
3011.352162112529
3111.3578166916005
3211.7688290727508
3312.2642459334231
3412.3828431695042
3513.2567139436797
3614.0367549301043
3714.7017043493017
3816.6511101865354
3919.1887274389745
4020.8519216239285
4121.5136604490006
4222.1805609438077
4324.4873530190255
4425.3853212333016
4528.2189872358057
4636.5424602768386
4739.8804146839637
4841.9742545325414
4945.1334941821552
5048.030064668399
5151.7193297232399
5275.0674625012845
5387.5786186610769
54106.054115926471
55174.291562089309
56200.629311269414
57434.364360278614
58454.702779456106
591398.25140240886

\begin{tabular}{lllllllll}
\hline
Summary of Dendrogram \tabularnewline
Label & Height \tabularnewline
1 & 1.41421356237310 \tabularnewline
2 & 1.41421356237310 \tabularnewline
3 & 1.41421356237310 \tabularnewline
4 & 1.73205080756888 \tabularnewline
5 & 2.23606797749979 \tabularnewline
6 & 2.44948974278318 \tabularnewline
7 & 2.82842712474619 \tabularnewline
8 & 3.65602689891371 \tabularnewline
9 & 3.74165738677394 \tabularnewline
10 & 3.74165738677394 \tabularnewline
11 & 3.74165738677394 \tabularnewline
12 & 3.74165738677394 \tabularnewline
13 & 3.74165738677394 \tabularnewline
14 & 4.12310562561766 \tabularnewline
15 & 4.24264068711928 \tabularnewline
16 & 4.58257569495584 \tabularnewline
17 & 5.09901951359278 \tabularnewline
18 & 5.74456264653803 \tabularnewline
19 & 6.48074069840786 \tabularnewline
20 & 6.96564801457551 \tabularnewline
21 & 7.34846922834953 \tabularnewline
22 & 8.20407816807507 \tabularnewline
23 & 8.48528137423857 \tabularnewline
24 & 9.00353107304067 \tabularnewline
25 & 9.47161567483146 \tabularnewline
26 & 10.0035541233253 \tabularnewline
27 & 10.0436084811547 \tabularnewline
28 & 10.7238052947636 \tabularnewline
29 & 10.9198183276202 \tabularnewline
30 & 11.352162112529 \tabularnewline
31 & 11.3578166916005 \tabularnewline
32 & 11.7688290727508 \tabularnewline
33 & 12.2642459334231 \tabularnewline
34 & 12.3828431695042 \tabularnewline
35 & 13.2567139436797 \tabularnewline
36 & 14.0367549301043 \tabularnewline
37 & 14.7017043493017 \tabularnewline
38 & 16.6511101865354 \tabularnewline
39 & 19.1887274389745 \tabularnewline
40 & 20.8519216239285 \tabularnewline
41 & 21.5136604490006 \tabularnewline
42 & 22.1805609438077 \tabularnewline
43 & 24.4873530190255 \tabularnewline
44 & 25.3853212333016 \tabularnewline
45 & 28.2189872358057 \tabularnewline
46 & 36.5424602768386 \tabularnewline
47 & 39.8804146839637 \tabularnewline
48 & 41.9742545325414 \tabularnewline
49 & 45.1334941821552 \tabularnewline
50 & 48.030064668399 \tabularnewline
51 & 51.7193297232399 \tabularnewline
52 & 75.0674625012845 \tabularnewline
53 & 87.5786186610769 \tabularnewline
54 & 106.054115926471 \tabularnewline
55 & 174.291562089309 \tabularnewline
56 & 200.629311269414 \tabularnewline
57 & 434.364360278614 \tabularnewline
58 & 454.702779456106 \tabularnewline
59 & 1398.25140240886 \tabularnewline
\hline
\end{tabular}
%Source: https://freestatistics.org/blog/index.php?pk=24133&T=1

[TABLE]
[ROW][C]Summary of Dendrogram[/C][/ROW]
[ROW][C]Label[/C][C]Height[/C][/ROW]
[ROW][C]1[/C][C]1.41421356237310[/C][/ROW]
[ROW][C]2[/C][C]1.41421356237310[/C][/ROW]
[ROW][C]3[/C][C]1.41421356237310[/C][/ROW]
[ROW][C]4[/C][C]1.73205080756888[/C][/ROW]
[ROW][C]5[/C][C]2.23606797749979[/C][/ROW]
[ROW][C]6[/C][C]2.44948974278318[/C][/ROW]
[ROW][C]7[/C][C]2.82842712474619[/C][/ROW]
[ROW][C]8[/C][C]3.65602689891371[/C][/ROW]
[ROW][C]9[/C][C]3.74165738677394[/C][/ROW]
[ROW][C]10[/C][C]3.74165738677394[/C][/ROW]
[ROW][C]11[/C][C]3.74165738677394[/C][/ROW]
[ROW][C]12[/C][C]3.74165738677394[/C][/ROW]
[ROW][C]13[/C][C]3.74165738677394[/C][/ROW]
[ROW][C]14[/C][C]4.12310562561766[/C][/ROW]
[ROW][C]15[/C][C]4.24264068711928[/C][/ROW]
[ROW][C]16[/C][C]4.58257569495584[/C][/ROW]
[ROW][C]17[/C][C]5.09901951359278[/C][/ROW]
[ROW][C]18[/C][C]5.74456264653803[/C][/ROW]
[ROW][C]19[/C][C]6.48074069840786[/C][/ROW]
[ROW][C]20[/C][C]6.96564801457551[/C][/ROW]
[ROW][C]21[/C][C]7.34846922834953[/C][/ROW]
[ROW][C]22[/C][C]8.20407816807507[/C][/ROW]
[ROW][C]23[/C][C]8.48528137423857[/C][/ROW]
[ROW][C]24[/C][C]9.00353107304067[/C][/ROW]
[ROW][C]25[/C][C]9.47161567483146[/C][/ROW]
[ROW][C]26[/C][C]10.0035541233253[/C][/ROW]
[ROW][C]27[/C][C]10.0436084811547[/C][/ROW]
[ROW][C]28[/C][C]10.7238052947636[/C][/ROW]
[ROW][C]29[/C][C]10.9198183276202[/C][/ROW]
[ROW][C]30[/C][C]11.352162112529[/C][/ROW]
[ROW][C]31[/C][C]11.3578166916005[/C][/ROW]
[ROW][C]32[/C][C]11.7688290727508[/C][/ROW]
[ROW][C]33[/C][C]12.2642459334231[/C][/ROW]
[ROW][C]34[/C][C]12.3828431695042[/C][/ROW]
[ROW][C]35[/C][C]13.2567139436797[/C][/ROW]
[ROW][C]36[/C][C]14.0367549301043[/C][/ROW]
[ROW][C]37[/C][C]14.7017043493017[/C][/ROW]
[ROW][C]38[/C][C]16.6511101865354[/C][/ROW]
[ROW][C]39[/C][C]19.1887274389745[/C][/ROW]
[ROW][C]40[/C][C]20.8519216239285[/C][/ROW]
[ROW][C]41[/C][C]21.5136604490006[/C][/ROW]
[ROW][C]42[/C][C]22.1805609438077[/C][/ROW]
[ROW][C]43[/C][C]24.4873530190255[/C][/ROW]
[ROW][C]44[/C][C]25.3853212333016[/C][/ROW]
[ROW][C]45[/C][C]28.2189872358057[/C][/ROW]
[ROW][C]46[/C][C]36.5424602768386[/C][/ROW]
[ROW][C]47[/C][C]39.8804146839637[/C][/ROW]
[ROW][C]48[/C][C]41.9742545325414[/C][/ROW]
[ROW][C]49[/C][C]45.1334941821552[/C][/ROW]
[ROW][C]50[/C][C]48.030064668399[/C][/ROW]
[ROW][C]51[/C][C]51.7193297232399[/C][/ROW]
[ROW][C]52[/C][C]75.0674625012845[/C][/ROW]
[ROW][C]53[/C][C]87.5786186610769[/C][/ROW]
[ROW][C]54[/C][C]106.054115926471[/C][/ROW]
[ROW][C]55[/C][C]174.291562089309[/C][/ROW]
[ROW][C]56[/C][C]200.629311269414[/C][/ROW]
[ROW][C]57[/C][C]434.364360278614[/C][/ROW]
[ROW][C]58[/C][C]454.702779456106[/C][/ROW]
[ROW][C]59[/C][C]1398.25140240886[/C][/ROW]
[/TABLE]
Source: https://freestatistics.org/blog/index.php?pk=24133&T=1

Globally Unique Identifier (entire table): ba.freestatistics.org/blog/index.php?pk=24133&T=1

As an alternative you can also use a QR Code:  

The GUIDs for individual cells are displayed in the table below:

Summary of Dendrogram
LabelHeight
11.41421356237310
21.41421356237310
31.41421356237310
41.73205080756888
52.23606797749979
62.44948974278318
72.82842712474619
83.65602689891371
93.74165738677394
103.74165738677394
113.74165738677394
123.74165738677394
133.74165738677394
144.12310562561766
154.24264068711928
164.58257569495584
175.09901951359278
185.74456264653803
196.48074069840786
206.96564801457551
217.34846922834953
228.20407816807507
238.48528137423857
249.00353107304067
259.47161567483146
2610.0035541233253
2710.0436084811547
2810.7238052947636
2910.9198183276202
3011.352162112529
3111.3578166916005
3211.7688290727508
3312.2642459334231
3412.3828431695042
3513.2567139436797
3614.0367549301043
3714.7017043493017
3816.6511101865354
3919.1887274389745
4020.8519216239285
4121.5136604490006
4222.1805609438077
4324.4873530190255
4425.3853212333016
4528.2189872358057
4636.5424602768386
4739.8804146839637
4841.9742545325414
4945.1334941821552
5048.030064668399
5151.7193297232399
5275.0674625012845
5387.5786186610769
54106.054115926471
55174.291562089309
56200.629311269414
57434.364360278614
58454.702779456106
591398.25140240886


Parameters (Session):
par1 = ward ; par2 = ALL ; par3 = FALSE ; par4 = FALSE ;
Parameters (R input):
par1 = ward ; par2 = ALL ; par3 = FALSE ; par4 = FALSE ;
R code (references can be found in the software module):
par3 <- as.logical(par3)
par4 <- as.logical(par4)
if (par3 == 'TRUE'){
dum = xlab
xlab = ylab
ylab = dum
}
x <- t(y)
hc <- hclust(dist(x),method=par1)
d <- as.dendrogram(hc)
str(d)
mysub <- paste('Method: ',par1)
bitmap(file='test1.png')
if (par4 == 'TRUE'){
plot(d,main=main,ylab=ylab,xlab=xlab,horiz=par3, nodePar=list(pch = c(1,NA), cex=0.8, lab.cex = 0.8),type='t',center=T, sub=mysub)
} else {
plot(d,main=main,ylab=ylab,xlab=xlab,horiz=par3, nodePar=list(pch = c(1,NA), cex=0.8, lab.cex = 0.8), sub=mysub)
}
dev.off()
if (par2 != 'ALL'){
if (par3 == 'TRUE'){
ylab = 'cluster'
} else {
xlab = 'cluster'
}
par2 <- as.numeric(par2)
memb <- cutree(hc, k = par2)
cent <- NULL
for(k in 1:par2){
cent <- rbind(cent, colMeans(x[memb == k, , drop = FALSE]))
}
hc1 <- hclust(dist(cent),method=par1, members = table(memb))
de <- as.dendrogram(hc1)
bitmap(file='test2.png')
if (par4 == 'TRUE'){
plot(de,main=main,ylab=ylab,xlab=xlab,horiz=par3, nodePar=list(pch = c(1,NA), cex=0.8, lab.cex = 0.8),type='t',center=T, sub=mysub)
} else {
plot(de,main=main,ylab=ylab,xlab=xlab,horiz=par3, nodePar=list(pch = c(1,NA), cex=0.8, lab.cex = 0.8), sub=mysub)
}
dev.off()
str(de)
}
load(file='createtable')
a<-table.start()
a<-table.row.start(a)
a<-table.element(a,'Summary of Dendrogram',2,TRUE)
a<-table.row.end(a)
a<-table.row.start(a)
a<-table.element(a,'Label',header=TRUE)
a<-table.element(a,'Height',header=TRUE)
a<-table.row.end(a)
num <- length(x[,1])-1
for (i in 1:num)
{
a<-table.row.start(a)
a<-table.element(a,hc$labels[i])
a<-table.element(a,hc$height[i])
a<-table.row.end(a)
}
a<-table.end(a)
table.save(a,file='mytable1.tab')
if (par2 != 'ALL'){
a<-table.start()
a<-table.row.start(a)
a<-table.element(a,'Summary of Cut Dendrogram',2,TRUE)
a<-table.row.end(a)
a<-table.row.start(a)
a<-table.element(a,'Label',header=TRUE)
a<-table.element(a,'Height',header=TRUE)
a<-table.row.end(a)
num <- par2-1
for (i in 1:num)
{
a<-table.row.start(a)
a<-table.element(a,i)
a<-table.element(a,hc1$height[i])
a<-table.row.end(a)
}
a<-table.end(a)
table.save(a,file='mytable2.tab')
}