Free Statistics

of Irreproducible Research!

Author's title

Author*The author of this computation has been verified*
R Software Modulerwasp_autocorrelation.wasp
Title produced by software(Partial) Autocorrelation Function
Date of computationWed, 12 Nov 2008 03:44:14 -0700
Cite this page as followsStatistical Computations at FreeStatistics.org, Office for Research Development and Education, URL https://freestatistics.org/blog/index.php?v=date/2008/Nov/12/t122648673212a9d7n730u3tto.htm/, Retrieved Sat, 18 May 2024 01:42:54 +0000
Statistical Computations at FreeStatistics.org, Office for Research Development and Education, URL https://freestatistics.org/blog/index.php?pk=24078, Retrieved Sat, 18 May 2024 01:42:54 +0000
QR Codes:

Original text written by user:
IsPrivate?No (this computation is public)
User-defined keywordsVarious EDA topics
Estimated Impact277
Family? (F = Feedback message, R = changed R code, M = changed R Module, P = changed Parameters, D = changed Data)
-     [(Partial) Autocorrelation Function] [omzet] [2007-12-03 11:20:48] [8eeeb1b102d3219870922ae6f80f1f57]
F   PD    [(Partial) Autocorrelation Function] [Various EDA topic...] [2008-11-12 10:44:14] [3efbb18563b4564408d69b3c9a8e9a6e] [Current]
F RMPD      [Trivariate Scatterplots] [Various EDA topic...] [2008-11-12 11:00:11] [c29178f7f550574a75dc881e636e0923]
- RMP         [Partial Correlation] [Q1 partial correl...] [2008-11-15 13:11:00] [ed2ba3b6182103c15c0ab511ae4e6284]
F RMPD      [Hierarchical Clustering] [hierarchial clust...] [2008-11-12 11:21:49] [c29178f7f550574a75dc881e636e0923]
F RMPD      [Box-Cox Linearity Plot] [Various topics ab...] [2008-11-12 11:30:21] [c29178f7f550574a75dc881e636e0923]
Feedback Forum
2008-11-15 08:42:58 [Tamara Witters] [reply
Je hebt hierbij de verkeerde R-code gekozen.
Je moest de partial correlation gebruiken en niet the partial autocorrelation.
Zo moet je de partial correlation interpreteren:

Hierbij hebben we 3 variabelen nodig: X, Y en Z.
We gaan hierbij niet de correlatie tussen de 3 variabelen tegelijkertijd onderzoeken, maar wel 2 aan 2 correlaties en de partiële correlatie. De partiële correlatie houdt in dat we de correlatie tussen 2 variabelen gaan onderzoeken onder invloed van de 3e variabele.
Dikwijls krijg je een vertekend beeld bij een correlatie tussen 2 variabelen. Het voordeel van deze methode is dat je door het toevoegen van de 3e variabele dit effect weggezuiverd wordt.
2008-11-16 16:21:24 [Kevin Truyts] [reply
Zoals de vorige studente reeds heeft vermeld, was het d ebedoeling om de partial correlation te berekenen en niet de autocorrelation.
Hier zou dan de correlatie tussen 3 variablelen berekend worden. Dit gebeurt door elke variabele te vergelijken met elke andere variabele (2 aan 2) en niet alle 3 te samen.
2008-11-22 15:43:46 [Stéphanie Van Dyck] [reply
Je moet hier de partial correlation berekenen. Je moet er op letten van deze 2 aan 2 te berekenen.
2008-11-23 15:02:35 [Annelies Michiels] [reply
Aangezien de student zijn tijdreeksen niet in het document heeft bijgevoegd was het moeilijker om de partial correlation voor hem te berekenen.

Ik heb mij gebasseerd op volgende gegevens:
http://www.nbb.be/belgostat/PresentationLinker?TableId=410000092&Lang=N
Deze tijdreeks bevat wel geen 60 observaties maar het is maar om een idee te geven hoe de partial correlatie moet worden opgesteld.

We maken gebruik van de seizoensgezuiverde resultaten.
Nl.
- totaal werklzoekende onder de 25 jaar
- totaal werkzoekende boven de 25 jaar
- totaal van alle werkzoekende

resultaat:
http://www.freestatistics.org/blog/index.php?v=date/2008/Nov/23/t1227452292q94qcm5qku88q4s.htm

Er bestaat een positieve partial correlation van xy. z van 70,42%
Er bestaat een positieve partial correlation van xz. y van 68,34%
Er betaat bijna geen correlatie tussen yz.x namelijk -0,47%, dit resultaat is dus bijna verwaarloosbaar.

2008-11-24 14:33:03 [Bernard Femont] [reply
Zoals de vorige studente reeds heeft vermeld, was het de bedoeling om de partial correlation te berekenen en niet de autocorrelation.
Hier zou dan de correlatie tussen 3 variablelen berekend worden. Dit gebeurt door elke variabele te vergelijken met elke andere variabele (2 aan 2) en niet alle 3 te samen.

Post a new message
Dataseries X:
565
547
555
562
561
555
544
537
543
594
611
613
611
594
595
591
589
584
573
567
569
621
629
628
612
595
597
593
590
580
574
573
573
620
626
620
588
566
557
561
549
532
526
511
499
555
565
542
527
510
514
517
508
493
490
469
478
528
534
518


Summary of computational transaction
Raw Inputview raw input (R code)
Raw Outputview raw output of R engine
Computing time1 seconds
R Server'George Udny Yule' @ 72.249.76.132

\begin{tabular}{lllllllll}
\hline
Summary of computational transaction \tabularnewline
Raw Input & view raw input (R code)  \tabularnewline
Raw Output & view raw output of R engine  \tabularnewline
Computing time & 1 seconds \tabularnewline
R Server & 'George Udny Yule' @ 72.249.76.132 \tabularnewline
\hline
\end{tabular}
%Source: https://freestatistics.org/blog/index.php?pk=24078&T=0

[TABLE]
[ROW][C]Summary of computational transaction[/C][/ROW]
[ROW][C]Raw Input[/C][C]view raw input (R code) [/C][/ROW]
[ROW][C]Raw Output[/C][C]view raw output of R engine [/C][/ROW]
[ROW][C]Computing time[/C][C]1 seconds[/C][/ROW]
[ROW][C]R Server[/C][C]'George Udny Yule' @ 72.249.76.132[/C][/ROW]
[/TABLE]
Source: https://freestatistics.org/blog/index.php?pk=24078&T=0

Globally Unique Identifier (entire table): ba.freestatistics.org/blog/index.php?pk=24078&T=0

As an alternative you can also use a QR Code:  

The GUIDs for individual cells are displayed in the table below:

Summary of computational transaction
Raw Inputview raw input (R code)
Raw Outputview raw output of R engine
Computing time1 seconds
R Server'George Udny Yule' @ 72.249.76.132


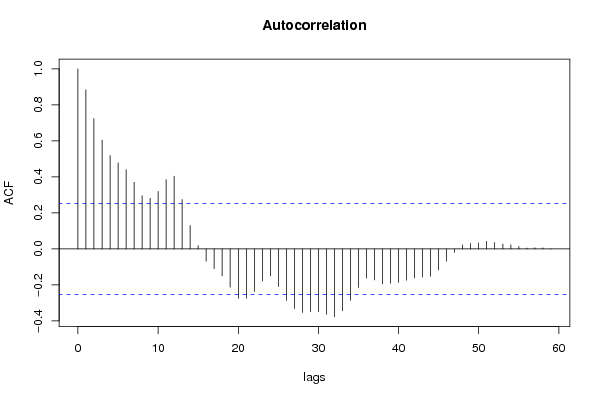
Autocorrelation Function
Time lag kACF(k)T-STATP-value
017.7460
10.8841386.84850
20.7245985.61270
30.6047744.68468e-06
40.518544.01668.3e-05
50.4775663.69920.000236
60.4405763.41270.000579
70.3699032.86530.002868
80.2950292.28530.012923
90.2816532.18170.016531
100.3195352.47510.008081
110.3850222.98240.002065
120.4038093.12790.001358
130.2745592.12670.018782
140.1295011.00310.159917
150.0178720.13840.445179
16-0.068261-0.52870.700534
17-0.10944-0.84770.800017
18-0.149842-1.16070.874813
19-0.212611-1.64690.947594
20-0.274382-2.12540.981158
21-0.274112-2.12330.981067
22-0.235986-1.82790.963734
23-0.178894-1.38570.914518
24-0.15051-1.16580.875855
25-0.209423-1.62220.944996
26-0.286247-2.21730.984797
27-0.331434-2.56730.99362
28-0.353433-2.73770.995935
29-0.349667-2.70850.995603
30-0.34949-2.70710.995587
31-0.363717-2.81730.996727
32-0.376375-2.91540.997506
33-0.344078-2.66520.995065
34-0.285649-2.21260.98463
35-0.215056-1.66580.949519
36-0.162262-1.25690.893165
37-0.172106-1.33310.906236
38-0.194922-1.50990.931836
39-0.190122-1.47270.926968
40-0.186204-1.44230.922795
41-0.173577-1.34450.908079
42-0.161342-1.24970.891877
43-0.156521-1.21240.884946
44-0.151568-1.1740.877492
45-0.116617-0.90330.815014
46-0.068474-0.53040.701103
47-0.018802-0.14560.557654
480.0224040.17350.431405
490.0303610.23520.407438
500.0334710.25930.398158
510.0425330.32950.371478
520.0352930.27340.392749
530.027270.21120.416711
540.0225170.17440.431062
550.0136260.10550.458147
560.0050380.0390.4845
570.0067190.0520.479334
580.0061390.04760.481116
59-0.001323-0.01020.50407

\begin{tabular}{lllllllll}
\hline
Autocorrelation Function \tabularnewline
Time lag k & ACF(k) & T-STAT & P-value \tabularnewline
0 & 1 & 7.746 & 0 \tabularnewline
1 & 0.884138 & 6.8485 & 0 \tabularnewline
2 & 0.724598 & 5.6127 & 0 \tabularnewline
3 & 0.604774 & 4.6846 & 8e-06 \tabularnewline
4 & 0.51854 & 4.0166 & 8.3e-05 \tabularnewline
5 & 0.477566 & 3.6992 & 0.000236 \tabularnewline
6 & 0.440576 & 3.4127 & 0.000579 \tabularnewline
7 & 0.369903 & 2.8653 & 0.002868 \tabularnewline
8 & 0.295029 & 2.2853 & 0.012923 \tabularnewline
9 & 0.281653 & 2.1817 & 0.016531 \tabularnewline
10 & 0.319535 & 2.4751 & 0.008081 \tabularnewline
11 & 0.385022 & 2.9824 & 0.002065 \tabularnewline
12 & 0.403809 & 3.1279 & 0.001358 \tabularnewline
13 & 0.274559 & 2.1267 & 0.018782 \tabularnewline
14 & 0.129501 & 1.0031 & 0.159917 \tabularnewline
15 & 0.017872 & 0.1384 & 0.445179 \tabularnewline
16 & -0.068261 & -0.5287 & 0.700534 \tabularnewline
17 & -0.10944 & -0.8477 & 0.800017 \tabularnewline
18 & -0.149842 & -1.1607 & 0.874813 \tabularnewline
19 & -0.212611 & -1.6469 & 0.947594 \tabularnewline
20 & -0.274382 & -2.1254 & 0.981158 \tabularnewline
21 & -0.274112 & -2.1233 & 0.981067 \tabularnewline
22 & -0.235986 & -1.8279 & 0.963734 \tabularnewline
23 & -0.178894 & -1.3857 & 0.914518 \tabularnewline
24 & -0.15051 & -1.1658 & 0.875855 \tabularnewline
25 & -0.209423 & -1.6222 & 0.944996 \tabularnewline
26 & -0.286247 & -2.2173 & 0.984797 \tabularnewline
27 & -0.331434 & -2.5673 & 0.99362 \tabularnewline
28 & -0.353433 & -2.7377 & 0.995935 \tabularnewline
29 & -0.349667 & -2.7085 & 0.995603 \tabularnewline
30 & -0.34949 & -2.7071 & 0.995587 \tabularnewline
31 & -0.363717 & -2.8173 & 0.996727 \tabularnewline
32 & -0.376375 & -2.9154 & 0.997506 \tabularnewline
33 & -0.344078 & -2.6652 & 0.995065 \tabularnewline
34 & -0.285649 & -2.2126 & 0.98463 \tabularnewline
35 & -0.215056 & -1.6658 & 0.949519 \tabularnewline
36 & -0.162262 & -1.2569 & 0.893165 \tabularnewline
37 & -0.172106 & -1.3331 & 0.906236 \tabularnewline
38 & -0.194922 & -1.5099 & 0.931836 \tabularnewline
39 & -0.190122 & -1.4727 & 0.926968 \tabularnewline
40 & -0.186204 & -1.4423 & 0.922795 \tabularnewline
41 & -0.173577 & -1.3445 & 0.908079 \tabularnewline
42 & -0.161342 & -1.2497 & 0.891877 \tabularnewline
43 & -0.156521 & -1.2124 & 0.884946 \tabularnewline
44 & -0.151568 & -1.174 & 0.877492 \tabularnewline
45 & -0.116617 & -0.9033 & 0.815014 \tabularnewline
46 & -0.068474 & -0.5304 & 0.701103 \tabularnewline
47 & -0.018802 & -0.1456 & 0.557654 \tabularnewline
48 & 0.022404 & 0.1735 & 0.431405 \tabularnewline
49 & 0.030361 & 0.2352 & 0.407438 \tabularnewline
50 & 0.033471 & 0.2593 & 0.398158 \tabularnewline
51 & 0.042533 & 0.3295 & 0.371478 \tabularnewline
52 & 0.035293 & 0.2734 & 0.392749 \tabularnewline
53 & 0.02727 & 0.2112 & 0.416711 \tabularnewline
54 & 0.022517 & 0.1744 & 0.431062 \tabularnewline
55 & 0.013626 & 0.1055 & 0.458147 \tabularnewline
56 & 0.005038 & 0.039 & 0.4845 \tabularnewline
57 & 0.006719 & 0.052 & 0.479334 \tabularnewline
58 & 0.006139 & 0.0476 & 0.481116 \tabularnewline
59 & -0.001323 & -0.0102 & 0.50407 \tabularnewline
\hline
\end{tabular}
%Source: https://freestatistics.org/blog/index.php?pk=24078&T=1

[TABLE]
[ROW][C]Autocorrelation Function[/C][/ROW]
[ROW][C]Time lag k[/C][C]ACF(k)[/C][C]T-STAT[/C][C]P-value[/C][/ROW]
[ROW][C]0[/C][C]1[/C][C]7.746[/C][C]0[/C][/ROW]
[ROW][C]1[/C][C]0.884138[/C][C]6.8485[/C][C]0[/C][/ROW]
[ROW][C]2[/C][C]0.724598[/C][C]5.6127[/C][C]0[/C][/ROW]
[ROW][C]3[/C][C]0.604774[/C][C]4.6846[/C][C]8e-06[/C][/ROW]
[ROW][C]4[/C][C]0.51854[/C][C]4.0166[/C][C]8.3e-05[/C][/ROW]
[ROW][C]5[/C][C]0.477566[/C][C]3.6992[/C][C]0.000236[/C][/ROW]
[ROW][C]6[/C][C]0.440576[/C][C]3.4127[/C][C]0.000579[/C][/ROW]
[ROW][C]7[/C][C]0.369903[/C][C]2.8653[/C][C]0.002868[/C][/ROW]
[ROW][C]8[/C][C]0.295029[/C][C]2.2853[/C][C]0.012923[/C][/ROW]
[ROW][C]9[/C][C]0.281653[/C][C]2.1817[/C][C]0.016531[/C][/ROW]
[ROW][C]10[/C][C]0.319535[/C][C]2.4751[/C][C]0.008081[/C][/ROW]
[ROW][C]11[/C][C]0.385022[/C][C]2.9824[/C][C]0.002065[/C][/ROW]
[ROW][C]12[/C][C]0.403809[/C][C]3.1279[/C][C]0.001358[/C][/ROW]
[ROW][C]13[/C][C]0.274559[/C][C]2.1267[/C][C]0.018782[/C][/ROW]
[ROW][C]14[/C][C]0.129501[/C][C]1.0031[/C][C]0.159917[/C][/ROW]
[ROW][C]15[/C][C]0.017872[/C][C]0.1384[/C][C]0.445179[/C][/ROW]
[ROW][C]16[/C][C]-0.068261[/C][C]-0.5287[/C][C]0.700534[/C][/ROW]
[ROW][C]17[/C][C]-0.10944[/C][C]-0.8477[/C][C]0.800017[/C][/ROW]
[ROW][C]18[/C][C]-0.149842[/C][C]-1.1607[/C][C]0.874813[/C][/ROW]
[ROW][C]19[/C][C]-0.212611[/C][C]-1.6469[/C][C]0.947594[/C][/ROW]
[ROW][C]20[/C][C]-0.274382[/C][C]-2.1254[/C][C]0.981158[/C][/ROW]
[ROW][C]21[/C][C]-0.274112[/C][C]-2.1233[/C][C]0.981067[/C][/ROW]
[ROW][C]22[/C][C]-0.235986[/C][C]-1.8279[/C][C]0.963734[/C][/ROW]
[ROW][C]23[/C][C]-0.178894[/C][C]-1.3857[/C][C]0.914518[/C][/ROW]
[ROW][C]24[/C][C]-0.15051[/C][C]-1.1658[/C][C]0.875855[/C][/ROW]
[ROW][C]25[/C][C]-0.209423[/C][C]-1.6222[/C][C]0.944996[/C][/ROW]
[ROW][C]26[/C][C]-0.286247[/C][C]-2.2173[/C][C]0.984797[/C][/ROW]
[ROW][C]27[/C][C]-0.331434[/C][C]-2.5673[/C][C]0.99362[/C][/ROW]
[ROW][C]28[/C][C]-0.353433[/C][C]-2.7377[/C][C]0.995935[/C][/ROW]
[ROW][C]29[/C][C]-0.349667[/C][C]-2.7085[/C][C]0.995603[/C][/ROW]
[ROW][C]30[/C][C]-0.34949[/C][C]-2.7071[/C][C]0.995587[/C][/ROW]
[ROW][C]31[/C][C]-0.363717[/C][C]-2.8173[/C][C]0.996727[/C][/ROW]
[ROW][C]32[/C][C]-0.376375[/C][C]-2.9154[/C][C]0.997506[/C][/ROW]
[ROW][C]33[/C][C]-0.344078[/C][C]-2.6652[/C][C]0.995065[/C][/ROW]
[ROW][C]34[/C][C]-0.285649[/C][C]-2.2126[/C][C]0.98463[/C][/ROW]
[ROW][C]35[/C][C]-0.215056[/C][C]-1.6658[/C][C]0.949519[/C][/ROW]
[ROW][C]36[/C][C]-0.162262[/C][C]-1.2569[/C][C]0.893165[/C][/ROW]
[ROW][C]37[/C][C]-0.172106[/C][C]-1.3331[/C][C]0.906236[/C][/ROW]
[ROW][C]38[/C][C]-0.194922[/C][C]-1.5099[/C][C]0.931836[/C][/ROW]
[ROW][C]39[/C][C]-0.190122[/C][C]-1.4727[/C][C]0.926968[/C][/ROW]
[ROW][C]40[/C][C]-0.186204[/C][C]-1.4423[/C][C]0.922795[/C][/ROW]
[ROW][C]41[/C][C]-0.173577[/C][C]-1.3445[/C][C]0.908079[/C][/ROW]
[ROW][C]42[/C][C]-0.161342[/C][C]-1.2497[/C][C]0.891877[/C][/ROW]
[ROW][C]43[/C][C]-0.156521[/C][C]-1.2124[/C][C]0.884946[/C][/ROW]
[ROW][C]44[/C][C]-0.151568[/C][C]-1.174[/C][C]0.877492[/C][/ROW]
[ROW][C]45[/C][C]-0.116617[/C][C]-0.9033[/C][C]0.815014[/C][/ROW]
[ROW][C]46[/C][C]-0.068474[/C][C]-0.5304[/C][C]0.701103[/C][/ROW]
[ROW][C]47[/C][C]-0.018802[/C][C]-0.1456[/C][C]0.557654[/C][/ROW]
[ROW][C]48[/C][C]0.022404[/C][C]0.1735[/C][C]0.431405[/C][/ROW]
[ROW][C]49[/C][C]0.030361[/C][C]0.2352[/C][C]0.407438[/C][/ROW]
[ROW][C]50[/C][C]0.033471[/C][C]0.2593[/C][C]0.398158[/C][/ROW]
[ROW][C]51[/C][C]0.042533[/C][C]0.3295[/C][C]0.371478[/C][/ROW]
[ROW][C]52[/C][C]0.035293[/C][C]0.2734[/C][C]0.392749[/C][/ROW]
[ROW][C]53[/C][C]0.02727[/C][C]0.2112[/C][C]0.416711[/C][/ROW]
[ROW][C]54[/C][C]0.022517[/C][C]0.1744[/C][C]0.431062[/C][/ROW]
[ROW][C]55[/C][C]0.013626[/C][C]0.1055[/C][C]0.458147[/C][/ROW]
[ROW][C]56[/C][C]0.005038[/C][C]0.039[/C][C]0.4845[/C][/ROW]
[ROW][C]57[/C][C]0.006719[/C][C]0.052[/C][C]0.479334[/C][/ROW]
[ROW][C]58[/C][C]0.006139[/C][C]0.0476[/C][C]0.481116[/C][/ROW]
[ROW][C]59[/C][C]-0.001323[/C][C]-0.0102[/C][C]0.50407[/C][/ROW]
[/TABLE]
Source: https://freestatistics.org/blog/index.php?pk=24078&T=1

Globally Unique Identifier (entire table): ba.freestatistics.org/blog/index.php?pk=24078&T=1

As an alternative you can also use a QR Code:  

The GUIDs for individual cells are displayed in the table below:

Autocorrelation Function
Time lag kACF(k)T-STATP-value
017.7460
10.8841386.84850
20.7245985.61270
30.6047744.68468e-06
40.518544.01668.3e-05
50.4775663.69920.000236
60.4405763.41270.000579
70.3699032.86530.002868
80.2950292.28530.012923
90.2816532.18170.016531
100.3195352.47510.008081
110.3850222.98240.002065
120.4038093.12790.001358
130.2745592.12670.018782
140.1295011.00310.159917
150.0178720.13840.445179
16-0.068261-0.52870.700534
17-0.10944-0.84770.800017
18-0.149842-1.16070.874813
19-0.212611-1.64690.947594
20-0.274382-2.12540.981158
21-0.274112-2.12330.981067
22-0.235986-1.82790.963734
23-0.178894-1.38570.914518
24-0.15051-1.16580.875855
25-0.209423-1.62220.944996
26-0.286247-2.21730.984797
27-0.331434-2.56730.99362
28-0.353433-2.73770.995935
29-0.349667-2.70850.995603
30-0.34949-2.70710.995587
31-0.363717-2.81730.996727
32-0.376375-2.91540.997506
33-0.344078-2.66520.995065
34-0.285649-2.21260.98463
35-0.215056-1.66580.949519
36-0.162262-1.25690.893165
37-0.172106-1.33310.906236
38-0.194922-1.50990.931836
39-0.190122-1.47270.926968
40-0.186204-1.44230.922795
41-0.173577-1.34450.908079
42-0.161342-1.24970.891877
43-0.156521-1.21240.884946
44-0.151568-1.1740.877492
45-0.116617-0.90330.815014
46-0.068474-0.53040.701103
47-0.018802-0.14560.557654
480.0224040.17350.431405
490.0303610.23520.407438
500.0334710.25930.398158
510.0425330.32950.371478
520.0352930.27340.392749
530.027270.21120.416711
540.0225170.17440.431062
550.0136260.10550.458147
560.0050380.0390.4845
570.0067190.0520.479334
580.0061390.04760.481116
59-0.001323-0.01020.50407


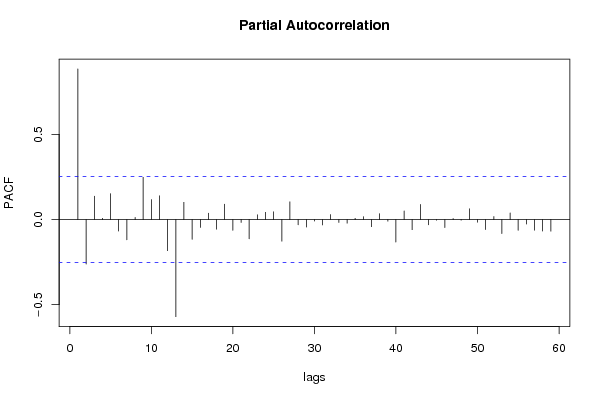
Partial Autocorrelation Function
Time lag kPACF(k)T-STATP-value
00.8841386.84850
1-0.261575-2.02620.976399
20.1368051.05970.146767
30.0074190.05750.477181
40.1517171.17520.12228
5-0.068088-0.52740.700072
6-0.118891-0.92090.819611
70.0120380.09320.463008
80.2482011.92260.029643
90.1171210.90720.18396
100.1391231.07760.142753
11-0.183273-1.41960.919554
12-0.570407-4.41840.999979
130.1008990.78160.218773
14-0.116273-0.90060.814312
15-0.04638-0.35930.639669
160.0369710.28640.387789
17-0.056719-0.43930.669003
180.0897620.69530.244777
19-0.063633-0.49290.688059
20-0.017315-0.13410.553124
21-0.113123-0.87620.807805
220.0279280.21630.414734
230.0420220.32550.372968
240.0454320.35190.363068
25-0.126983-0.98360.83537
260.1041930.80710.211406
27-0.030961-0.23980.594358
28-0.04453-0.34490.634321
29-0.008779-0.0680.526995
30-0.032011-0.2480.597493
310.0289180.2240.41176
32-0.017437-0.13510.553493
33-0.021504-0.16660.565867
340.007130.05520.478071
350.0167740.12990.448527
36-0.042162-0.32660.627441
370.0340890.26410.396323
38-0.009707-0.07520.529843
39-0.132244-1.02440.845111
400.0503770.39020.348879
41-0.059738-0.46270.677384
420.0888510.68820.246977
43-0.031207-0.24170.595094
44-0.003736-0.02890.511494
45-0.047552-0.36830.64304
460.0055490.0430.482931
47-0.004344-0.03360.513365
480.0628930.48720.313956
49-0.016091-0.12460.549388
50-0.059255-0.4590.67605
510.0172860.13390.446965
52-0.082647-0.64020.737753
530.0383570.29710.383704
54-0.063106-0.48880.686622
55-0.026722-0.2070.581639
56-0.063009-0.48810.686358
57-0.067694-0.52440.699019
58-0.068352-0.52950.700778
59NANANA

\begin{tabular}{lllllllll}
\hline
Partial Autocorrelation Function \tabularnewline
Time lag k & PACF(k) & T-STAT & P-value \tabularnewline
0 & 0.884138 & 6.8485 & 0 \tabularnewline
1 & -0.261575 & -2.0262 & 0.976399 \tabularnewline
2 & 0.136805 & 1.0597 & 0.146767 \tabularnewline
3 & 0.007419 & 0.0575 & 0.477181 \tabularnewline
4 & 0.151717 & 1.1752 & 0.12228 \tabularnewline
5 & -0.068088 & -0.5274 & 0.700072 \tabularnewline
6 & -0.118891 & -0.9209 & 0.819611 \tabularnewline
7 & 0.012038 & 0.0932 & 0.463008 \tabularnewline
8 & 0.248201 & 1.9226 & 0.029643 \tabularnewline
9 & 0.117121 & 0.9072 & 0.18396 \tabularnewline
10 & 0.139123 & 1.0776 & 0.142753 \tabularnewline
11 & -0.183273 & -1.4196 & 0.919554 \tabularnewline
12 & -0.570407 & -4.4184 & 0.999979 \tabularnewline
13 & 0.100899 & 0.7816 & 0.218773 \tabularnewline
14 & -0.116273 & -0.9006 & 0.814312 \tabularnewline
15 & -0.04638 & -0.3593 & 0.639669 \tabularnewline
16 & 0.036971 & 0.2864 & 0.387789 \tabularnewline
17 & -0.056719 & -0.4393 & 0.669003 \tabularnewline
18 & 0.089762 & 0.6953 & 0.244777 \tabularnewline
19 & -0.063633 & -0.4929 & 0.688059 \tabularnewline
20 & -0.017315 & -0.1341 & 0.553124 \tabularnewline
21 & -0.113123 & -0.8762 & 0.807805 \tabularnewline
22 & 0.027928 & 0.2163 & 0.414734 \tabularnewline
23 & 0.042022 & 0.3255 & 0.372968 \tabularnewline
24 & 0.045432 & 0.3519 & 0.363068 \tabularnewline
25 & -0.126983 & -0.9836 & 0.83537 \tabularnewline
26 & 0.104193 & 0.8071 & 0.211406 \tabularnewline
27 & -0.030961 & -0.2398 & 0.594358 \tabularnewline
28 & -0.04453 & -0.3449 & 0.634321 \tabularnewline
29 & -0.008779 & -0.068 & 0.526995 \tabularnewline
30 & -0.032011 & -0.248 & 0.597493 \tabularnewline
31 & 0.028918 & 0.224 & 0.41176 \tabularnewline
32 & -0.017437 & -0.1351 & 0.553493 \tabularnewline
33 & -0.021504 & -0.1666 & 0.565867 \tabularnewline
34 & 0.00713 & 0.0552 & 0.478071 \tabularnewline
35 & 0.016774 & 0.1299 & 0.448527 \tabularnewline
36 & -0.042162 & -0.3266 & 0.627441 \tabularnewline
37 & 0.034089 & 0.2641 & 0.396323 \tabularnewline
38 & -0.009707 & -0.0752 & 0.529843 \tabularnewline
39 & -0.132244 & -1.0244 & 0.845111 \tabularnewline
40 & 0.050377 & 0.3902 & 0.348879 \tabularnewline
41 & -0.059738 & -0.4627 & 0.677384 \tabularnewline
42 & 0.088851 & 0.6882 & 0.246977 \tabularnewline
43 & -0.031207 & -0.2417 & 0.595094 \tabularnewline
44 & -0.003736 & -0.0289 & 0.511494 \tabularnewline
45 & -0.047552 & -0.3683 & 0.64304 \tabularnewline
46 & 0.005549 & 0.043 & 0.482931 \tabularnewline
47 & -0.004344 & -0.0336 & 0.513365 \tabularnewline
48 & 0.062893 & 0.4872 & 0.313956 \tabularnewline
49 & -0.016091 & -0.1246 & 0.549388 \tabularnewline
50 & -0.059255 & -0.459 & 0.67605 \tabularnewline
51 & 0.017286 & 0.1339 & 0.446965 \tabularnewline
52 & -0.082647 & -0.6402 & 0.737753 \tabularnewline
53 & 0.038357 & 0.2971 & 0.383704 \tabularnewline
54 & -0.063106 & -0.4888 & 0.686622 \tabularnewline
55 & -0.026722 & -0.207 & 0.581639 \tabularnewline
56 & -0.063009 & -0.4881 & 0.686358 \tabularnewline
57 & -0.067694 & -0.5244 & 0.699019 \tabularnewline
58 & -0.068352 & -0.5295 & 0.700778 \tabularnewline
59 & NA & NA & NA \tabularnewline
\hline
\end{tabular}
%Source: https://freestatistics.org/blog/index.php?pk=24078&T=2

[TABLE]
[ROW][C]Partial Autocorrelation Function[/C][/ROW]
[ROW][C]Time lag k[/C][C]PACF(k)[/C][C]T-STAT[/C][C]P-value[/C][/ROW]
[ROW][C]0[/C][C]0.884138[/C][C]6.8485[/C][C]0[/C][/ROW]
[ROW][C]1[/C][C]-0.261575[/C][C]-2.0262[/C][C]0.976399[/C][/ROW]
[ROW][C]2[/C][C]0.136805[/C][C]1.0597[/C][C]0.146767[/C][/ROW]
[ROW][C]3[/C][C]0.007419[/C][C]0.0575[/C][C]0.477181[/C][/ROW]
[ROW][C]4[/C][C]0.151717[/C][C]1.1752[/C][C]0.12228[/C][/ROW]
[ROW][C]5[/C][C]-0.068088[/C][C]-0.5274[/C][C]0.700072[/C][/ROW]
[ROW][C]6[/C][C]-0.118891[/C][C]-0.9209[/C][C]0.819611[/C][/ROW]
[ROW][C]7[/C][C]0.012038[/C][C]0.0932[/C][C]0.463008[/C][/ROW]
[ROW][C]8[/C][C]0.248201[/C][C]1.9226[/C][C]0.029643[/C][/ROW]
[ROW][C]9[/C][C]0.117121[/C][C]0.9072[/C][C]0.18396[/C][/ROW]
[ROW][C]10[/C][C]0.139123[/C][C]1.0776[/C][C]0.142753[/C][/ROW]
[ROW][C]11[/C][C]-0.183273[/C][C]-1.4196[/C][C]0.919554[/C][/ROW]
[ROW][C]12[/C][C]-0.570407[/C][C]-4.4184[/C][C]0.999979[/C][/ROW]
[ROW][C]13[/C][C]0.100899[/C][C]0.7816[/C][C]0.218773[/C][/ROW]
[ROW][C]14[/C][C]-0.116273[/C][C]-0.9006[/C][C]0.814312[/C][/ROW]
[ROW][C]15[/C][C]-0.04638[/C][C]-0.3593[/C][C]0.639669[/C][/ROW]
[ROW][C]16[/C][C]0.036971[/C][C]0.2864[/C][C]0.387789[/C][/ROW]
[ROW][C]17[/C][C]-0.056719[/C][C]-0.4393[/C][C]0.669003[/C][/ROW]
[ROW][C]18[/C][C]0.089762[/C][C]0.6953[/C][C]0.244777[/C][/ROW]
[ROW][C]19[/C][C]-0.063633[/C][C]-0.4929[/C][C]0.688059[/C][/ROW]
[ROW][C]20[/C][C]-0.017315[/C][C]-0.1341[/C][C]0.553124[/C][/ROW]
[ROW][C]21[/C][C]-0.113123[/C][C]-0.8762[/C][C]0.807805[/C][/ROW]
[ROW][C]22[/C][C]0.027928[/C][C]0.2163[/C][C]0.414734[/C][/ROW]
[ROW][C]23[/C][C]0.042022[/C][C]0.3255[/C][C]0.372968[/C][/ROW]
[ROW][C]24[/C][C]0.045432[/C][C]0.3519[/C][C]0.363068[/C][/ROW]
[ROW][C]25[/C][C]-0.126983[/C][C]-0.9836[/C][C]0.83537[/C][/ROW]
[ROW][C]26[/C][C]0.104193[/C][C]0.8071[/C][C]0.211406[/C][/ROW]
[ROW][C]27[/C][C]-0.030961[/C][C]-0.2398[/C][C]0.594358[/C][/ROW]
[ROW][C]28[/C][C]-0.04453[/C][C]-0.3449[/C][C]0.634321[/C][/ROW]
[ROW][C]29[/C][C]-0.008779[/C][C]-0.068[/C][C]0.526995[/C][/ROW]
[ROW][C]30[/C][C]-0.032011[/C][C]-0.248[/C][C]0.597493[/C][/ROW]
[ROW][C]31[/C][C]0.028918[/C][C]0.224[/C][C]0.41176[/C][/ROW]
[ROW][C]32[/C][C]-0.017437[/C][C]-0.1351[/C][C]0.553493[/C][/ROW]
[ROW][C]33[/C][C]-0.021504[/C][C]-0.1666[/C][C]0.565867[/C][/ROW]
[ROW][C]34[/C][C]0.00713[/C][C]0.0552[/C][C]0.478071[/C][/ROW]
[ROW][C]35[/C][C]0.016774[/C][C]0.1299[/C][C]0.448527[/C][/ROW]
[ROW][C]36[/C][C]-0.042162[/C][C]-0.3266[/C][C]0.627441[/C][/ROW]
[ROW][C]37[/C][C]0.034089[/C][C]0.2641[/C][C]0.396323[/C][/ROW]
[ROW][C]38[/C][C]-0.009707[/C][C]-0.0752[/C][C]0.529843[/C][/ROW]
[ROW][C]39[/C][C]-0.132244[/C][C]-1.0244[/C][C]0.845111[/C][/ROW]
[ROW][C]40[/C][C]0.050377[/C][C]0.3902[/C][C]0.348879[/C][/ROW]
[ROW][C]41[/C][C]-0.059738[/C][C]-0.4627[/C][C]0.677384[/C][/ROW]
[ROW][C]42[/C][C]0.088851[/C][C]0.6882[/C][C]0.246977[/C][/ROW]
[ROW][C]43[/C][C]-0.031207[/C][C]-0.2417[/C][C]0.595094[/C][/ROW]
[ROW][C]44[/C][C]-0.003736[/C][C]-0.0289[/C][C]0.511494[/C][/ROW]
[ROW][C]45[/C][C]-0.047552[/C][C]-0.3683[/C][C]0.64304[/C][/ROW]
[ROW][C]46[/C][C]0.005549[/C][C]0.043[/C][C]0.482931[/C][/ROW]
[ROW][C]47[/C][C]-0.004344[/C][C]-0.0336[/C][C]0.513365[/C][/ROW]
[ROW][C]48[/C][C]0.062893[/C][C]0.4872[/C][C]0.313956[/C][/ROW]
[ROW][C]49[/C][C]-0.016091[/C][C]-0.1246[/C][C]0.549388[/C][/ROW]
[ROW][C]50[/C][C]-0.059255[/C][C]-0.459[/C][C]0.67605[/C][/ROW]
[ROW][C]51[/C][C]0.017286[/C][C]0.1339[/C][C]0.446965[/C][/ROW]
[ROW][C]52[/C][C]-0.082647[/C][C]-0.6402[/C][C]0.737753[/C][/ROW]
[ROW][C]53[/C][C]0.038357[/C][C]0.2971[/C][C]0.383704[/C][/ROW]
[ROW][C]54[/C][C]-0.063106[/C][C]-0.4888[/C][C]0.686622[/C][/ROW]
[ROW][C]55[/C][C]-0.026722[/C][C]-0.207[/C][C]0.581639[/C][/ROW]
[ROW][C]56[/C][C]-0.063009[/C][C]-0.4881[/C][C]0.686358[/C][/ROW]
[ROW][C]57[/C][C]-0.067694[/C][C]-0.5244[/C][C]0.699019[/C][/ROW]
[ROW][C]58[/C][C]-0.068352[/C][C]-0.5295[/C][C]0.700778[/C][/ROW]
[ROW][C]59[/C][C]NA[/C][C]NA[/C][C]NA[/C][/ROW]
[/TABLE]
Source: https://freestatistics.org/blog/index.php?pk=24078&T=2

Globally Unique Identifier (entire table): ba.freestatistics.org/blog/index.php?pk=24078&T=2

As an alternative you can also use a QR Code:  

The GUIDs for individual cells are displayed in the table below:

Partial Autocorrelation Function
Time lag kPACF(k)T-STATP-value
00.8841386.84850
1-0.261575-2.02620.976399
20.1368051.05970.146767
30.0074190.05750.477181
40.1517171.17520.12228
5-0.068088-0.52740.700072
6-0.118891-0.92090.819611
70.0120380.09320.463008
80.2482011.92260.029643
90.1171210.90720.18396
100.1391231.07760.142753
11-0.183273-1.41960.919554
12-0.570407-4.41840.999979
130.1008990.78160.218773
14-0.116273-0.90060.814312
15-0.04638-0.35930.639669
160.0369710.28640.387789
17-0.056719-0.43930.669003
180.0897620.69530.244777
19-0.063633-0.49290.688059
20-0.017315-0.13410.553124
21-0.113123-0.87620.807805
220.0279280.21630.414734
230.0420220.32550.372968
240.0454320.35190.363068
25-0.126983-0.98360.83537
260.1041930.80710.211406
27-0.030961-0.23980.594358
28-0.04453-0.34490.634321
29-0.008779-0.0680.526995
30-0.032011-0.2480.597493
310.0289180.2240.41176
32-0.017437-0.13510.553493
33-0.021504-0.16660.565867
340.007130.05520.478071
350.0167740.12990.448527
36-0.042162-0.32660.627441
370.0340890.26410.396323
38-0.009707-0.07520.529843
39-0.132244-1.02440.845111
400.0503770.39020.348879
41-0.059738-0.46270.677384
420.0888510.68820.246977
43-0.031207-0.24170.595094
44-0.003736-0.02890.511494
45-0.047552-0.36830.64304
460.0055490.0430.482931
47-0.004344-0.03360.513365
480.0628930.48720.313956
49-0.016091-0.12460.549388
50-0.059255-0.4590.67605
510.0172860.13390.446965
52-0.082647-0.64020.737753
530.0383570.29710.383704
54-0.063106-0.48880.686622
55-0.026722-0.2070.581639
56-0.063009-0.48810.686358
57-0.067694-0.52440.699019
58-0.068352-0.52950.700778
59NANANA


Parameters (Session):
par1 = 60 ; par2 = 1 ; par3 = 0 ; par4 = 0 ; par5 = 12 ;
Parameters (R input):
par1 = 60 ; par2 = 1 ; par3 = 0 ; par4 = 0 ; par5 = 12 ;
R code (references can be found in the software module):
if (par1 == 'Default') {
par1 = 10*log10(length(x))
} else {
par1 <- as.numeric(par1)
}
par2 <- as.numeric(par2)
par3 <- as.numeric(par3)
par4 <- as.numeric(par4)
par5 <- as.numeric(par5)
if (par2 == 0) {
x <- log(x)
} else {
x <- (x ^ par2 - 1) / par2
}
if (par3 > 0) x <- diff(x,lag=1,difference=par3)
if (par4 > 0) x <- diff(x,lag=par5,difference=par4)
bitmap(file='pic1.png')
racf <- acf(x,par1,main='Autocorrelation',xlab='lags',ylab='ACF')
dev.off()
bitmap(file='pic2.png')
rpacf <- pacf(x,par1,main='Partial Autocorrelation',xlab='lags',ylab='PACF')
dev.off()
(myacf <- c(racf$acf))
(mypacf <- c(rpacf$acf))
lengthx <- length(x)
sqrtn <- sqrt(lengthx)
load(file='createtable')
a<-table.start()
a<-table.row.start(a)
a<-table.element(a,'Autocorrelation Function',4,TRUE)
a<-table.row.end(a)
a<-table.row.start(a)
a<-table.element(a,'Time lag k',header=TRUE)
a<-table.element(a,hyperlink('basics.htm','ACF(k)','click here for more information about the Autocorrelation Function'),header=TRUE)
a<-table.element(a,'T-STAT',header=TRUE)
a<-table.element(a,'P-value',header=TRUE)
a<-table.row.end(a)
for (i in 1:par1) {
a<-table.row.start(a)
a<-table.element(a,i-1,header=TRUE)
a<-table.element(a,round(myacf[i],6))
mytstat <- myacf[i]*sqrtn
a<-table.element(a,round(mytstat,4))
a<-table.element(a,round(1-pt(mytstat,lengthx),6))
a<-table.row.end(a)
}
a<-table.end(a)
table.save(a,file='mytable.tab')
a<-table.start()
a<-table.row.start(a)
a<-table.element(a,'Partial Autocorrelation Function',4,TRUE)
a<-table.row.end(a)
a<-table.row.start(a)
a<-table.element(a,'Time lag k',header=TRUE)
a<-table.element(a,hyperlink('basics.htm','PACF(k)','click here for more information about the Partial Autocorrelation Function'),header=TRUE)
a<-table.element(a,'T-STAT',header=TRUE)
a<-table.element(a,'P-value',header=TRUE)
a<-table.row.end(a)
for (i in 1:par1) {
a<-table.row.start(a)
a<-table.element(a,i-1,header=TRUE)
a<-table.element(a,round(mypacf[i],6))
mytstat <- mypacf[i]*sqrtn
a<-table.element(a,round(mytstat,4))
a<-table.element(a,round(1-pt(mytstat,lengthx),6))
a<-table.row.end(a)
}
a<-table.end(a)
table.save(a,file='mytable1.tab')