\begin{tabular}{lllllllll}
\hline
Summary of computational transaction \tabularnewline
Raw Input & view raw input (R code)  \tabularnewline
Raw Output & view raw output of R engine  \tabularnewline
Computing time & 1 seconds \tabularnewline
R Server & 'AstonUniversity' @ aston.wessa.net \tabularnewline
\hline
\end{tabular}
%Source: https://freestatistics.org/blog/index.php?pk=168768&T=0
[TABLE]
[ROW][C]Summary of computational transaction[/C][/ROW]
[ROW][C]Raw Input[/C][C]view raw input (R code) [/C][/ROW]
[ROW][C]Raw Output[/C][C]view raw output of R engine [/C][/ROW]
[ROW][C]Computing time[/C][C]1 seconds[/C][/ROW]
[ROW][C]R Server[/C][C]'AstonUniversity' @ aston.wessa.net[/C][/ROW]
[/TABLE]
Source: https://freestatistics.org/blog/index.php?pk=168768&T=0
If you paste this QR Code into your document, anyone with a smartphone or tablet will be able to scan it and view this table in a browser.
If you paste this QR Code into your document, anyone with a smartphone or tablet will be able to scan it and view this table in a browser.
If you paste this QR Code into your document, anyone with a smartphone or tablet will be able to scan it and view this table in a browser.
If you paste this QR Code into your document, anyone with a smartphone or tablet will be able to scan it and view this table in a browser.
If you paste this QR Code into your document, anyone with a smartphone or tablet will be able to scan it and view this table in a browser.
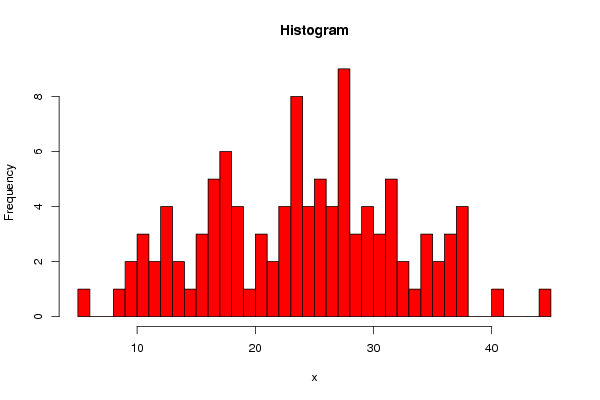
| Frequency Table (Histogram) | | Bins | Midpoint | Abs. Frequency | Rel. Frequency | Cumul. Rel. Freq. | Density | | [5,6[ | 5.5 | 1 | 0.009434 | 0.009434 | 0.009434 | | [6,7[ | 6.5 | 0 | 0 | 0.009434 | 0 | | [7,8[ | 7.5 | 0 | 0 | 0.009434 | 0 | | [8,9[ | 8.5 | 1 | 0.009434 | 0.018868 | 0.009434 | | [9,10[ | 9.5 | 2 | 0.018868 | 0.037736 | 0.018868 | | [10,11[ | 10.5 | 3 | 0.028302 | 0.066038 | 0.028302 | | [11,12[ | 11.5 | 2 | 0.018868 | 0.084906 | 0.018868 | | [12,13[ | 12.5 | 4 | 0.037736 | 0.122642 | 0.037736 | | [13,14[ | 13.5 | 2 | 0.018868 | 0.141509 | 0.018868 | | [14,15[ | 14.5 | 1 | 0.009434 | 0.150943 | 0.009434 | | [15,16[ | 15.5 | 3 | 0.028302 | 0.179245 | 0.028302 | | [16,17[ | 16.5 | 5 | 0.04717 | 0.226415 | 0.04717 | | [17,18[ | 17.5 | 6 | 0.056604 | 0.283019 | 0.056604 | | [18,19[ | 18.5 | 4 | 0.037736 | 0.320755 | 0.037736 | | [19,20[ | 19.5 | 1 | 0.009434 | 0.330189 | 0.009434 | | [20,21[ | 20.5 | 3 | 0.028302 | 0.358491 | 0.028302 | | [21,22[ | 21.5 | 2 | 0.018868 | 0.377358 | 0.018868 | | [22,23[ | 22.5 | 4 | 0.037736 | 0.415094 | 0.037736 | | [23,24[ | 23.5 | 8 | 0.075472 | 0.490566 | 0.075472 | | [24,25[ | 24.5 | 4 | 0.037736 | 0.528302 | 0.037736 | | [25,26[ | 25.5 | 5 | 0.04717 | 0.575472 | 0.04717 | | [26,27[ | 26.5 | 4 | 0.037736 | 0.613208 | 0.037736 | | [27,28[ | 27.5 | 9 | 0.084906 | 0.698113 | 0.084906 | | [28,29[ | 28.5 | 3 | 0.028302 | 0.726415 | 0.028302 | | [29,30[ | 29.5 | 4 | 0.037736 | 0.764151 | 0.037736 | | [30,31[ | 30.5 | 3 | 0.028302 | 0.792453 | 0.028302 | | [31,32[ | 31.5 | 5 | 0.04717 | 0.839623 | 0.04717 | | [32,33[ | 32.5 | 2 | 0.018868 | 0.858491 | 0.018868 | | [33,34[ | 33.5 | 1 | 0.009434 | 0.867925 | 0.009434 | | [34,35[ | 34.5 | 3 | 0.028302 | 0.896226 | 0.028302 | | [35,36[ | 35.5 | 2 | 0.018868 | 0.915094 | 0.018868 | | [36,37[ | 36.5 | 3 | 0.028302 | 0.943396 | 0.028302 | | [37,38[ | 37.5 | 4 | 0.037736 | 0.981132 | 0.037736 | | [38,39[ | 38.5 | 0 | 0 | 0.981132 | 0 | | [39,40[ | 39.5 | 0 | 0 | 0.981132 | 0 | | [40,41[ | 40.5 | 1 | 0.009434 | 0.990566 | 0.009434 | | [41,42[ | 41.5 | 0 | 0 | 0.990566 | 0 | | [42,43[ | 42.5 | 0 | 0 | 0.990566 | 0 | | [43,44[ | 43.5 | 0 | 0 | 0.990566 | 0 | | [44,45] | 44.5 | 1 | 0.009434 | 1 | 0.009434 |
\begin{tabular}{lllllllll}
\hline
Frequency Table (Histogram) \tabularnewline
Bins & Midpoint & Abs. Frequency & Rel. Frequency & Cumul. Rel. Freq. & Density \tabularnewline
[5,6[ & 5.5 & 1 & 0.009434 & 0.009434 & 0.009434 \tabularnewline
[6,7[ & 6.5 & 0 & 0 & 0.009434 & 0 \tabularnewline
[7,8[ & 7.5 & 0 & 0 & 0.009434 & 0 \tabularnewline
[8,9[ & 8.5 & 1 & 0.009434 & 0.018868 & 0.009434 \tabularnewline
[9,10[ & 9.5 & 2 & 0.018868 & 0.037736 & 0.018868 \tabularnewline
[10,11[ & 10.5 & 3 & 0.028302 & 0.066038 & 0.028302 \tabularnewline
[11,12[ & 11.5 & 2 & 0.018868 & 0.084906 & 0.018868 \tabularnewline
[12,13[ & 12.5 & 4 & 0.037736 & 0.122642 & 0.037736 \tabularnewline
[13,14[ & 13.5 & 2 & 0.018868 & 0.141509 & 0.018868 \tabularnewline
[14,15[ & 14.5 & 1 & 0.009434 & 0.150943 & 0.009434 \tabularnewline
[15,16[ & 15.5 & 3 & 0.028302 & 0.179245 & 0.028302 \tabularnewline
[16,17[ & 16.5 & 5 & 0.04717 & 0.226415 & 0.04717 \tabularnewline
[17,18[ & 17.5 & 6 & 0.056604 & 0.283019 & 0.056604 \tabularnewline
[18,19[ & 18.5 & 4 & 0.037736 & 0.320755 & 0.037736 \tabularnewline
[19,20[ & 19.5 & 1 & 0.009434 & 0.330189 & 0.009434 \tabularnewline
[20,21[ & 20.5 & 3 & 0.028302 & 0.358491 & 0.028302 \tabularnewline
[21,22[ & 21.5 & 2 & 0.018868 & 0.377358 & 0.018868 \tabularnewline
[22,23[ & 22.5 & 4 & 0.037736 & 0.415094 & 0.037736 \tabularnewline
[23,24[ & 23.5 & 8 & 0.075472 & 0.490566 & 0.075472 \tabularnewline
[24,25[ & 24.5 & 4 & 0.037736 & 0.528302 & 0.037736 \tabularnewline
[25,26[ & 25.5 & 5 & 0.04717 & 0.575472 & 0.04717 \tabularnewline
[26,27[ & 26.5 & 4 & 0.037736 & 0.613208 & 0.037736 \tabularnewline
[27,28[ & 27.5 & 9 & 0.084906 & 0.698113 & 0.084906 \tabularnewline
[28,29[ & 28.5 & 3 & 0.028302 & 0.726415 & 0.028302 \tabularnewline
[29,30[ & 29.5 & 4 & 0.037736 & 0.764151 & 0.037736 \tabularnewline
[30,31[ & 30.5 & 3 & 0.028302 & 0.792453 & 0.028302 \tabularnewline
[31,32[ & 31.5 & 5 & 0.04717 & 0.839623 & 0.04717 \tabularnewline
[32,33[ & 32.5 & 2 & 0.018868 & 0.858491 & 0.018868 \tabularnewline
[33,34[ & 33.5 & 1 & 0.009434 & 0.867925 & 0.009434 \tabularnewline
[34,35[ & 34.5 & 3 & 0.028302 & 0.896226 & 0.028302 \tabularnewline
[35,36[ & 35.5 & 2 & 0.018868 & 0.915094 & 0.018868 \tabularnewline
[36,37[ & 36.5 & 3 & 0.028302 & 0.943396 & 0.028302 \tabularnewline
[37,38[ & 37.5 & 4 & 0.037736 & 0.981132 & 0.037736 \tabularnewline
[38,39[ & 38.5 & 0 & 0 & 0.981132 & 0 \tabularnewline
[39,40[ & 39.5 & 0 & 0 & 0.981132 & 0 \tabularnewline
[40,41[ & 40.5 & 1 & 0.009434 & 0.990566 & 0.009434 \tabularnewline
[41,42[ & 41.5 & 0 & 0 & 0.990566 & 0 \tabularnewline
[42,43[ & 42.5 & 0 & 0 & 0.990566 & 0 \tabularnewline
[43,44[ & 43.5 & 0 & 0 & 0.990566 & 0 \tabularnewline
[44,45] & 44.5 & 1 & 0.009434 & 1 & 0.009434 \tabularnewline
\hline
\end{tabular}
%Source: https://freestatistics.org/blog/index.php?pk=168768&T=1
[TABLE]
[ROW][C]Frequency Table (Histogram)[/C][/ROW]
[ROW][C]Bins[/C][C]Midpoint[/C][C]Abs. Frequency[/C][C]Rel. Frequency[/C][C]Cumul. Rel. Freq.[/C][C]Density[/C][/ROW]
[ROW][C][5,6[[/C][C]5.5[/C][C]1[/C][C]0.009434[/C][C]0.009434[/C][C]0.009434[/C][/ROW]
[ROW][C][6,7[[/C][C]6.5[/C][C]0[/C][C]0[/C][C]0.009434[/C][C]0[/C][/ROW]
[ROW][C][7,8[[/C][C]7.5[/C][C]0[/C][C]0[/C][C]0.009434[/C][C]0[/C][/ROW]
[ROW][C][8,9[[/C][C]8.5[/C][C]1[/C][C]0.009434[/C][C]0.018868[/C][C]0.009434[/C][/ROW]
[ROW][C][9,10[[/C][C]9.5[/C][C]2[/C][C]0.018868[/C][C]0.037736[/C][C]0.018868[/C][/ROW]
[ROW][C][10,11[[/C][C]10.5[/C][C]3[/C][C]0.028302[/C][C]0.066038[/C][C]0.028302[/C][/ROW]
[ROW][C][11,12[[/C][C]11.5[/C][C]2[/C][C]0.018868[/C][C]0.084906[/C][C]0.018868[/C][/ROW]
[ROW][C][12,13[[/C][C]12.5[/C][C]4[/C][C]0.037736[/C][C]0.122642[/C][C]0.037736[/C][/ROW]
[ROW][C][13,14[[/C][C]13.5[/C][C]2[/C][C]0.018868[/C][C]0.141509[/C][C]0.018868[/C][/ROW]
[ROW][C][14,15[[/C][C]14.5[/C][C]1[/C][C]0.009434[/C][C]0.150943[/C][C]0.009434[/C][/ROW]
[ROW][C][15,16[[/C][C]15.5[/C][C]3[/C][C]0.028302[/C][C]0.179245[/C][C]0.028302[/C][/ROW]
[ROW][C][16,17[[/C][C]16.5[/C][C]5[/C][C]0.04717[/C][C]0.226415[/C][C]0.04717[/C][/ROW]
[ROW][C][17,18[[/C][C]17.5[/C][C]6[/C][C]0.056604[/C][C]0.283019[/C][C]0.056604[/C][/ROW]
[ROW][C][18,19[[/C][C]18.5[/C][C]4[/C][C]0.037736[/C][C]0.320755[/C][C]0.037736[/C][/ROW]
[ROW][C][19,20[[/C][C]19.5[/C][C]1[/C][C]0.009434[/C][C]0.330189[/C][C]0.009434[/C][/ROW]
[ROW][C][20,21[[/C][C]20.5[/C][C]3[/C][C]0.028302[/C][C]0.358491[/C][C]0.028302[/C][/ROW]
[ROW][C][21,22[[/C][C]21.5[/C][C]2[/C][C]0.018868[/C][C]0.377358[/C][C]0.018868[/C][/ROW]
[ROW][C][22,23[[/C][C]22.5[/C][C]4[/C][C]0.037736[/C][C]0.415094[/C][C]0.037736[/C][/ROW]
[ROW][C][23,24[[/C][C]23.5[/C][C]8[/C][C]0.075472[/C][C]0.490566[/C][C]0.075472[/C][/ROW]
[ROW][C][24,25[[/C][C]24.5[/C][C]4[/C][C]0.037736[/C][C]0.528302[/C][C]0.037736[/C][/ROW]
[ROW][C][25,26[[/C][C]25.5[/C][C]5[/C][C]0.04717[/C][C]0.575472[/C][C]0.04717[/C][/ROW]
[ROW][C][26,27[[/C][C]26.5[/C][C]4[/C][C]0.037736[/C][C]0.613208[/C][C]0.037736[/C][/ROW]
[ROW][C][27,28[[/C][C]27.5[/C][C]9[/C][C]0.084906[/C][C]0.698113[/C][C]0.084906[/C][/ROW]
[ROW][C][28,29[[/C][C]28.5[/C][C]3[/C][C]0.028302[/C][C]0.726415[/C][C]0.028302[/C][/ROW]
[ROW][C][29,30[[/C][C]29.5[/C][C]4[/C][C]0.037736[/C][C]0.764151[/C][C]0.037736[/C][/ROW]
[ROW][C][30,31[[/C][C]30.5[/C][C]3[/C][C]0.028302[/C][C]0.792453[/C][C]0.028302[/C][/ROW]
[ROW][C][31,32[[/C][C]31.5[/C][C]5[/C][C]0.04717[/C][C]0.839623[/C][C]0.04717[/C][/ROW]
[ROW][C][32,33[[/C][C]32.5[/C][C]2[/C][C]0.018868[/C][C]0.858491[/C][C]0.018868[/C][/ROW]
[ROW][C][33,34[[/C][C]33.5[/C][C]1[/C][C]0.009434[/C][C]0.867925[/C][C]0.009434[/C][/ROW]
[ROW][C][34,35[[/C][C]34.5[/C][C]3[/C][C]0.028302[/C][C]0.896226[/C][C]0.028302[/C][/ROW]
[ROW][C][35,36[[/C][C]35.5[/C][C]2[/C][C]0.018868[/C][C]0.915094[/C][C]0.018868[/C][/ROW]
[ROW][C][36,37[[/C][C]36.5[/C][C]3[/C][C]0.028302[/C][C]0.943396[/C][C]0.028302[/C][/ROW]
[ROW][C][37,38[[/C][C]37.5[/C][C]4[/C][C]0.037736[/C][C]0.981132[/C][C]0.037736[/C][/ROW]
[ROW][C][38,39[[/C][C]38.5[/C][C]0[/C][C]0[/C][C]0.981132[/C][C]0[/C][/ROW]
[ROW][C][39,40[[/C][C]39.5[/C][C]0[/C][C]0[/C][C]0.981132[/C][C]0[/C][/ROW]
[ROW][C][40,41[[/C][C]40.5[/C][C]1[/C][C]0.009434[/C][C]0.990566[/C][C]0.009434[/C][/ROW]
[ROW][C][41,42[[/C][C]41.5[/C][C]0[/C][C]0[/C][C]0.990566[/C][C]0[/C][/ROW]
[ROW][C][42,43[[/C][C]42.5[/C][C]0[/C][C]0[/C][C]0.990566[/C][C]0[/C][/ROW]
[ROW][C][43,44[[/C][C]43.5[/C][C]0[/C][C]0[/C][C]0.990566[/C][C]0[/C][/ROW]
[ROW][C][44,45][/C][C]44.5[/C][C]1[/C][C]0.009434[/C][C]1[/C][C]0.009434[/C][/ROW]
[/TABLE]
Source: https://freestatistics.org/blog/index.php?pk=168768&T=1
Globally Unique Identifier (entire table): ba.freestatistics.org/blog/index.php?pk=168768&T=1
As an alternative you can also use a QR Code:
The GUIDs for individual cells are displayed in the table below:
| Frequency Table (Histogram) | | Bins | Midpoint | Abs. Frequency | Rel. Frequency | Cumul. Rel. Freq. | Density | | [5,6[ | 5.5 | 1 | 0.009434 | 0.009434 | 0.009434 | | [6,7[ | 6.5 | 0 | 0 | 0.009434 | 0 | | [7,8[ | 7.5 | 0 | 0 | 0.009434 | 0 | | [8,9[ | 8.5 | 1 | 0.009434 | 0.018868 | 0.009434 | | [9,10[ | 9.5 | 2 | 0.018868 | 0.037736 | 0.018868 | | [10,11[ | 10.5 | 3 | 0.028302 | 0.066038 | 0.028302 | | [11,12[ | 11.5 | 2 | 0.018868 | 0.084906 | 0.018868 | | [12,13[ | 12.5 | 4 | 0.037736 | 0.122642 | 0.037736 | | [13,14[ | 13.5 | 2 | 0.018868 | 0.141509 | 0.018868 | | [14,15[ | 14.5 | 1 | 0.009434 | 0.150943 | 0.009434 | | [15,16[ | 15.5 | 3 | 0.028302 | 0.179245 | 0.028302 | | [16,17[ | 16.5 | 5 | 0.04717 | 0.226415 | 0.04717 | | [17,18[ | 17.5 | 6 | 0.056604 | 0.283019 | 0.056604 | | [18,19[ | 18.5 | 4 | 0.037736 | 0.320755 | 0.037736 | | [19,20[ | 19.5 | 1 | 0.009434 | 0.330189 | 0.009434 | | [20,21[ | 20.5 | 3 | 0.028302 | 0.358491 | 0.028302 | | [21,22[ | 21.5 | 2 | 0.018868 | 0.377358 | 0.018868 | | [22,23[ | 22.5 | 4 | 0.037736 | 0.415094 | 0.037736 | | [23,24[ | 23.5 | 8 | 0.075472 | 0.490566 | 0.075472 | | [24,25[ | 24.5 | 4 | 0.037736 | 0.528302 | 0.037736 | | [25,26[ | 25.5 | 5 | 0.04717 | 0.575472 | 0.04717 | | [26,27[ | 26.5 | 4 | 0.037736 | 0.613208 | 0.037736 | | [27,28[ | 27.5 | 9 | 0.084906 | 0.698113 | 0.084906 | | [28,29[ | 28.5 | 3 | 0.028302 | 0.726415 | 0.028302 | | [29,30[ | 29.5 | 4 | 0.037736 | 0.764151 | 0.037736 | | [30,31[ | 30.5 | 3 | 0.028302 | 0.792453 | 0.028302 | | [31,32[ | 31.5 | 5 | 0.04717 | 0.839623 | 0.04717 | | [32,33[ | 32.5 | 2 | 0.018868 | 0.858491 | 0.018868 | | [33,34[ | 33.5 | 1 | 0.009434 | 0.867925 | 0.009434 | | [34,35[ | 34.5 | 3 | 0.028302 | 0.896226 | 0.028302 | | [35,36[ | 35.5 | 2 | 0.018868 | 0.915094 | 0.018868 | | [36,37[ | 36.5 | 3 | 0.028302 | 0.943396 | 0.028302 | | [37,38[ | 37.5 | 4 | 0.037736 | 0.981132 | 0.037736 | | [38,39[ | 38.5 | 0 | 0 | 0.981132 | 0 | | [39,40[ | 39.5 | 0 | 0 | 0.981132 | 0 | | [40,41[ | 40.5 | 1 | 0.009434 | 0.990566 | 0.009434 | | [41,42[ | 41.5 | 0 | 0 | 0.990566 | 0 | | [42,43[ | 42.5 | 0 | 0 | 0.990566 | 0 | | [43,44[ | 43.5 | 0 | 0 | 0.990566 | 0 | | [44,45] | 44.5 | 1 | 0.009434 | 1 | 0.009434 |
If you paste this QR Code into your document, anyone with a smartphone or tablet will be able to scan it and view this table in a browser.
If you paste this QR Code into your document, anyone with a smartphone or tablet will be able to scan it and view this table in a browser.
If you paste this QR Code into your document, anyone with a smartphone or tablet will be able to scan it and view this table in a browser.
If you paste this QR Code into your document, anyone with a smartphone or tablet will be able to scan it and view this table in a browser.
If you paste this QR Code into your document, anyone with a smartphone or tablet will be able to scan it and view this table in a browser.
|