Free Statistics

of Irreproducible Research!

Author's title

Author*Unverified author*
R Software Modulerwasp_autocorrelation.wasp
Title produced by software(Partial) Autocorrelation Function
Date of computationSun, 15 Aug 2010 15:56:49 +0000
Cite this page as followsStatistical Computations at FreeStatistics.org, Office for Research Development and Education, URL https://freestatistics.org/blog/index.php?v=date/2010/Aug/15/t12818877836f82qgwgrjizje9.htm/, Retrieved Sun, 28 Apr 2024 17:21:15 +0000
Statistical Computations at FreeStatistics.org, Office for Research Development and Education, URL https://freestatistics.org/blog/index.php?pk=78896, Retrieved Sun, 28 Apr 2024 17:21:15 +0000
QR Codes:

Original text written by user:
IsPrivate?No (this computation is public)
User-defined keywords
Estimated Impact148
Family? (F = Feedback message, R = changed R code, M = changed R Module, P = changed Parameters, D = changed Data)
-     [Mean Plot] [Mean vs Median pl...] [2010-08-15 15:07:22] [f5ecd041e4b32af12787a4e421b18aaf]
-   P   [Mean Plot] [Mean&Median Plot ...] [2010-08-15 15:22:42] [f5ecd041e4b32af12787a4e421b18aaf]
- RM        [(Partial) Autocorrelation Function] [Partial omzet pro...] [2010-08-15 15:56:49] [05b8da000f2ebbd12b039a4b088dd3f2] [Current]
-   P         [(Partial) Autocorrelation Function] [Partial gedif. om...] [2010-08-16 13:23:29] [f5ecd041e4b32af12787a4e421b18aaf]
Feedback Forum

Post a new message
Dataseries X:
118
117
116
114
112
111
112
114
115
115
116
118
126
131
122
124
119
112
109
108
117
122
127
124
129
141
127
133
114
98
93
101
111
128
126
134
140
158
144
146
138
119
113
120
127
141
144
150
156
174
163
167
160
141
132
144
155
164
162
181
187
209
189
201
193
177
159
158
155
164
163
185
191
217
193
192
184
166
145
146
138
149
145
166


Summary of computational transaction
Raw Inputview raw input (R code)
Raw Outputview raw output of R engine
Computing time1 seconds
R Server'George Udny Yule' @ 72.249.76.132

\begin{tabular}{lllllllll}
\hline
Summary of computational transaction \tabularnewline
Raw Input & view raw input (R code)  \tabularnewline
Raw Output & view raw output of R engine  \tabularnewline
Computing time & 1 seconds \tabularnewline
R Server & 'George Udny Yule' @ 72.249.76.132 \tabularnewline
\hline
\end{tabular}
%Source: https://freestatistics.org/blog/index.php?pk=78896&T=0

[TABLE]
[ROW][C]Summary of computational transaction[/C][/ROW]
[ROW][C]Raw Input[/C][C]view raw input (R code) [/C][/ROW]
[ROW][C]Raw Output[/C][C]view raw output of R engine [/C][/ROW]
[ROW][C]Computing time[/C][C]1 seconds[/C][/ROW]
[ROW][C]R Server[/C][C]'George Udny Yule' @ 72.249.76.132[/C][/ROW]
[/TABLE]
Source: https://freestatistics.org/blog/index.php?pk=78896&T=0

Globally Unique Identifier (entire table): ba.freestatistics.org/blog/index.php?pk=78896&T=0

As an alternative you can also use a QR Code:  

The GUIDs for individual cells are displayed in the table below:

Summary of computational transaction
Raw Inputview raw input (R code)
Raw Outputview raw output of R engine
Computing time1 seconds
R Server'George Udny Yule' @ 72.249.76.132


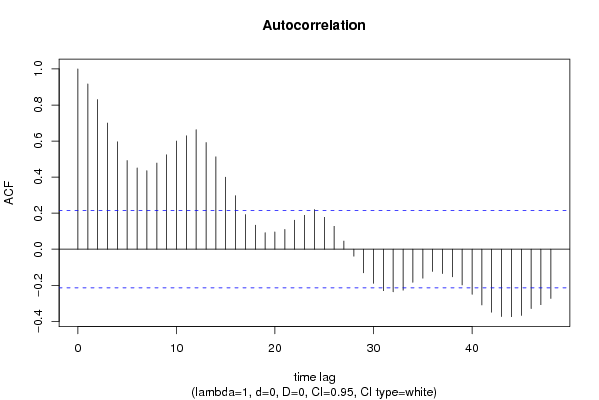
Autocorrelation Function
Time lag kACF(k)T-STATP-value
10.916618.40090
20.8300657.60770
30.6998726.41440
40.5954865.45770
50.4917624.50711.1e-05
60.4512034.13534.2e-05
70.4355673.9927e-05
80.4781054.38191.7e-05
90.5236264.79913e-06
100.6002235.50110
110.6291775.76650
120.6631376.07780
130.5920165.42590
140.5123424.69575e-06
150.3995133.66160.000219
160.2968462.72060.003959
170.1924751.76410.040679
180.1332451.22120.112712
190.0917840.84120.201308
200.0958540.87850.191085
210.1097091.00550.158772
220.1613091.47840.071517
230.1878351.72150.044418
240.2199682.0160.023496
250.1773441.62540.053914
260.1268841.16290.124079
270.0453060.41520.339515
28-0.038355-0.35150.363037
29-0.130743-1.19830.11709
30-0.189024-1.73240.043433
31-0.230127-2.10920.018954
32-0.236112-2.1640.016652
33-0.227489-2.0850.020054
34-0.183749-1.68410.047938
35-0.160457-1.47060.072567
36-0.123134-1.12850.131153
37-0.134774-1.23520.110095
38-0.152836-1.40080.082485
39-0.198146-1.8160.036466
40-0.250122-2.29240.012191
41-0.309259-2.83440.002874
42-0.349159-3.20010.00097
43-0.373701-3.4250.000477
44-0.373978-3.42760.000473
45-0.36699-3.36350.000581
46-0.329344-3.01850.001681
47-0.307744-2.82050.00299
48-0.273166-2.50360.007114

\begin{tabular}{lllllllll}
\hline
Autocorrelation Function \tabularnewline
Time lag k & ACF(k) & T-STAT & P-value \tabularnewline
1 & 0.91661 & 8.4009 & 0 \tabularnewline
2 & 0.830065 & 7.6077 & 0 \tabularnewline
3 & 0.699872 & 6.4144 & 0 \tabularnewline
4 & 0.595486 & 5.4577 & 0 \tabularnewline
5 & 0.491762 & 4.5071 & 1.1e-05 \tabularnewline
6 & 0.451203 & 4.1353 & 4.2e-05 \tabularnewline
7 & 0.435567 & 3.992 & 7e-05 \tabularnewline
8 & 0.478105 & 4.3819 & 1.7e-05 \tabularnewline
9 & 0.523626 & 4.7991 & 3e-06 \tabularnewline
10 & 0.600223 & 5.5011 & 0 \tabularnewline
11 & 0.629177 & 5.7665 & 0 \tabularnewline
12 & 0.663137 & 6.0778 & 0 \tabularnewline
13 & 0.592016 & 5.4259 & 0 \tabularnewline
14 & 0.512342 & 4.6957 & 5e-06 \tabularnewline
15 & 0.399513 & 3.6616 & 0.000219 \tabularnewline
16 & 0.296846 & 2.7206 & 0.003959 \tabularnewline
17 & 0.192475 & 1.7641 & 0.040679 \tabularnewline
18 & 0.133245 & 1.2212 & 0.112712 \tabularnewline
19 & 0.091784 & 0.8412 & 0.201308 \tabularnewline
20 & 0.095854 & 0.8785 & 0.191085 \tabularnewline
21 & 0.109709 & 1.0055 & 0.158772 \tabularnewline
22 & 0.161309 & 1.4784 & 0.071517 \tabularnewline
23 & 0.187835 & 1.7215 & 0.044418 \tabularnewline
24 & 0.219968 & 2.016 & 0.023496 \tabularnewline
25 & 0.177344 & 1.6254 & 0.053914 \tabularnewline
26 & 0.126884 & 1.1629 & 0.124079 \tabularnewline
27 & 0.045306 & 0.4152 & 0.339515 \tabularnewline
28 & -0.038355 & -0.3515 & 0.363037 \tabularnewline
29 & -0.130743 & -1.1983 & 0.11709 \tabularnewline
30 & -0.189024 & -1.7324 & 0.043433 \tabularnewline
31 & -0.230127 & -2.1092 & 0.018954 \tabularnewline
32 & -0.236112 & -2.164 & 0.016652 \tabularnewline
33 & -0.227489 & -2.085 & 0.020054 \tabularnewline
34 & -0.183749 & -1.6841 & 0.047938 \tabularnewline
35 & -0.160457 & -1.4706 & 0.072567 \tabularnewline
36 & -0.123134 & -1.1285 & 0.131153 \tabularnewline
37 & -0.134774 & -1.2352 & 0.110095 \tabularnewline
38 & -0.152836 & -1.4008 & 0.082485 \tabularnewline
39 & -0.198146 & -1.816 & 0.036466 \tabularnewline
40 & -0.250122 & -2.2924 & 0.012191 \tabularnewline
41 & -0.309259 & -2.8344 & 0.002874 \tabularnewline
42 & -0.349159 & -3.2001 & 0.00097 \tabularnewline
43 & -0.373701 & -3.425 & 0.000477 \tabularnewline
44 & -0.373978 & -3.4276 & 0.000473 \tabularnewline
45 & -0.36699 & -3.3635 & 0.000581 \tabularnewline
46 & -0.329344 & -3.0185 & 0.001681 \tabularnewline
47 & -0.307744 & -2.8205 & 0.00299 \tabularnewline
48 & -0.273166 & -2.5036 & 0.007114 \tabularnewline
\hline
\end{tabular}
%Source: https://freestatistics.org/blog/index.php?pk=78896&T=1

[TABLE]
[ROW][C]Autocorrelation Function[/C][/ROW]
[ROW][C]Time lag k[/C][C]ACF(k)[/C][C]T-STAT[/C][C]P-value[/C][/ROW]
[ROW][C]1[/C][C]0.91661[/C][C]8.4009[/C][C]0[/C][/ROW]
[ROW][C]2[/C][C]0.830065[/C][C]7.6077[/C][C]0[/C][/ROW]
[ROW][C]3[/C][C]0.699872[/C][C]6.4144[/C][C]0[/C][/ROW]
[ROW][C]4[/C][C]0.595486[/C][C]5.4577[/C][C]0[/C][/ROW]
[ROW][C]5[/C][C]0.491762[/C][C]4.5071[/C][C]1.1e-05[/C][/ROW]
[ROW][C]6[/C][C]0.451203[/C][C]4.1353[/C][C]4.2e-05[/C][/ROW]
[ROW][C]7[/C][C]0.435567[/C][C]3.992[/C][C]7e-05[/C][/ROW]
[ROW][C]8[/C][C]0.478105[/C][C]4.3819[/C][C]1.7e-05[/C][/ROW]
[ROW][C]9[/C][C]0.523626[/C][C]4.7991[/C][C]3e-06[/C][/ROW]
[ROW][C]10[/C][C]0.600223[/C][C]5.5011[/C][C]0[/C][/ROW]
[ROW][C]11[/C][C]0.629177[/C][C]5.7665[/C][C]0[/C][/ROW]
[ROW][C]12[/C][C]0.663137[/C][C]6.0778[/C][C]0[/C][/ROW]
[ROW][C]13[/C][C]0.592016[/C][C]5.4259[/C][C]0[/C][/ROW]
[ROW][C]14[/C][C]0.512342[/C][C]4.6957[/C][C]5e-06[/C][/ROW]
[ROW][C]15[/C][C]0.399513[/C][C]3.6616[/C][C]0.000219[/C][/ROW]
[ROW][C]16[/C][C]0.296846[/C][C]2.7206[/C][C]0.003959[/C][/ROW]
[ROW][C]17[/C][C]0.192475[/C][C]1.7641[/C][C]0.040679[/C][/ROW]
[ROW][C]18[/C][C]0.133245[/C][C]1.2212[/C][C]0.112712[/C][/ROW]
[ROW][C]19[/C][C]0.091784[/C][C]0.8412[/C][C]0.201308[/C][/ROW]
[ROW][C]20[/C][C]0.095854[/C][C]0.8785[/C][C]0.191085[/C][/ROW]
[ROW][C]21[/C][C]0.109709[/C][C]1.0055[/C][C]0.158772[/C][/ROW]
[ROW][C]22[/C][C]0.161309[/C][C]1.4784[/C][C]0.071517[/C][/ROW]
[ROW][C]23[/C][C]0.187835[/C][C]1.7215[/C][C]0.044418[/C][/ROW]
[ROW][C]24[/C][C]0.219968[/C][C]2.016[/C][C]0.023496[/C][/ROW]
[ROW][C]25[/C][C]0.177344[/C][C]1.6254[/C][C]0.053914[/C][/ROW]
[ROW][C]26[/C][C]0.126884[/C][C]1.1629[/C][C]0.124079[/C][/ROW]
[ROW][C]27[/C][C]0.045306[/C][C]0.4152[/C][C]0.339515[/C][/ROW]
[ROW][C]28[/C][C]-0.038355[/C][C]-0.3515[/C][C]0.363037[/C][/ROW]
[ROW][C]29[/C][C]-0.130743[/C][C]-1.1983[/C][C]0.11709[/C][/ROW]
[ROW][C]30[/C][C]-0.189024[/C][C]-1.7324[/C][C]0.043433[/C][/ROW]
[ROW][C]31[/C][C]-0.230127[/C][C]-2.1092[/C][C]0.018954[/C][/ROW]
[ROW][C]32[/C][C]-0.236112[/C][C]-2.164[/C][C]0.016652[/C][/ROW]
[ROW][C]33[/C][C]-0.227489[/C][C]-2.085[/C][C]0.020054[/C][/ROW]
[ROW][C]34[/C][C]-0.183749[/C][C]-1.6841[/C][C]0.047938[/C][/ROW]
[ROW][C]35[/C][C]-0.160457[/C][C]-1.4706[/C][C]0.072567[/C][/ROW]
[ROW][C]36[/C][C]-0.123134[/C][C]-1.1285[/C][C]0.131153[/C][/ROW]
[ROW][C]37[/C][C]-0.134774[/C][C]-1.2352[/C][C]0.110095[/C][/ROW]
[ROW][C]38[/C][C]-0.152836[/C][C]-1.4008[/C][C]0.082485[/C][/ROW]
[ROW][C]39[/C][C]-0.198146[/C][C]-1.816[/C][C]0.036466[/C][/ROW]
[ROW][C]40[/C][C]-0.250122[/C][C]-2.2924[/C][C]0.012191[/C][/ROW]
[ROW][C]41[/C][C]-0.309259[/C][C]-2.8344[/C][C]0.002874[/C][/ROW]
[ROW][C]42[/C][C]-0.349159[/C][C]-3.2001[/C][C]0.00097[/C][/ROW]
[ROW][C]43[/C][C]-0.373701[/C][C]-3.425[/C][C]0.000477[/C][/ROW]
[ROW][C]44[/C][C]-0.373978[/C][C]-3.4276[/C][C]0.000473[/C][/ROW]
[ROW][C]45[/C][C]-0.36699[/C][C]-3.3635[/C][C]0.000581[/C][/ROW]
[ROW][C]46[/C][C]-0.329344[/C][C]-3.0185[/C][C]0.001681[/C][/ROW]
[ROW][C]47[/C][C]-0.307744[/C][C]-2.8205[/C][C]0.00299[/C][/ROW]
[ROW][C]48[/C][C]-0.273166[/C][C]-2.5036[/C][C]0.007114[/C][/ROW]
[/TABLE]
Source: https://freestatistics.org/blog/index.php?pk=78896&T=1

Globally Unique Identifier (entire table): ba.freestatistics.org/blog/index.php?pk=78896&T=1

As an alternative you can also use a QR Code:  

The GUIDs for individual cells are displayed in the table below:

Autocorrelation Function
Time lag kACF(k)T-STATP-value
10.916618.40090
20.8300657.60770
30.6998726.41440
40.5954865.45770
50.4917624.50711.1e-05
60.4512034.13534.2e-05
70.4355673.9927e-05
80.4781054.38191.7e-05
90.5236264.79913e-06
100.6002235.50110
110.6291775.76650
120.6631376.07780
130.5920165.42590
140.5123424.69575e-06
150.3995133.66160.000219
160.2968462.72060.003959
170.1924751.76410.040679
180.1332451.22120.112712
190.0917840.84120.201308
200.0958540.87850.191085
210.1097091.00550.158772
220.1613091.47840.071517
230.1878351.72150.044418
240.2199682.0160.023496
250.1773441.62540.053914
260.1268841.16290.124079
270.0453060.41520.339515
28-0.038355-0.35150.363037
29-0.130743-1.19830.11709
30-0.189024-1.73240.043433
31-0.230127-2.10920.018954
32-0.236112-2.1640.016652
33-0.227489-2.0850.020054
34-0.183749-1.68410.047938
35-0.160457-1.47060.072567
36-0.123134-1.12850.131153
37-0.134774-1.23520.110095
38-0.152836-1.40080.082485
39-0.198146-1.8160.036466
40-0.250122-2.29240.012191
41-0.309259-2.83440.002874
42-0.349159-3.20010.00097
43-0.373701-3.4250.000477
44-0.373978-3.42760.000473
45-0.36699-3.36350.000581
46-0.329344-3.01850.001681
47-0.307744-2.82050.00299
48-0.273166-2.50360.007114


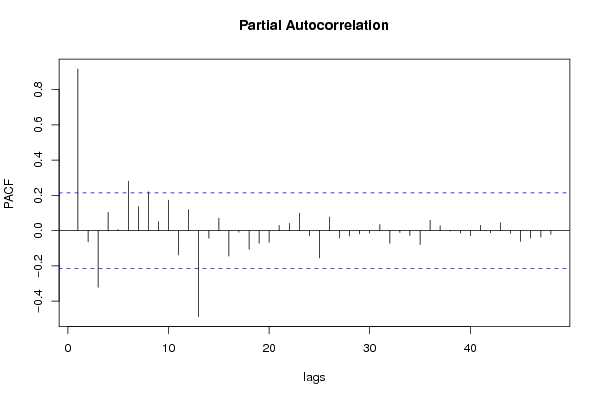
Partial Autocorrelation Function
Time lag kPACF(k)T-STATP-value
10.916618.40090
2-0.063254-0.57970.281823
3-0.32114-2.94330.002099
40.1028690.94280.174242
50.0056280.05160.479491
60.280052.56670.00602
70.1360421.24680.10796
80.2198092.01460.023574
90.051580.47270.318812
100.1726761.58260.058635
11-0.137894-1.26380.104896
120.118521.08630.140238
13-0.487813-4.47091.2e-05
14-0.043316-0.3970.346187
150.0705680.64680.259773
16-0.144426-1.32370.094599
17-0.008898-0.08160.467599
18-0.106354-0.97480.166241
19-0.072122-0.6610.255208
20-0.065934-0.60430.273638
210.0296070.27130.393394
220.0404190.37040.355991
230.0984240.90210.1848
24-0.02915-0.26720.395
25-0.154993-1.42050.079577
260.0767880.70380.24176
27-0.041442-0.37980.352517
28-0.029873-0.27380.392457
29-0.019104-0.17510.430714
30-0.013797-0.12650.449837
310.0341760.31320.377443
32-0.072022-0.66010.2555
33-0.010697-0.0980.461068
34-0.027067-0.24810.402341
35-0.078025-0.71510.238262
360.0588420.53930.295556
370.0276870.25380.400152
38-0.002443-0.02240.491094
39-0.013806-0.12650.449807
40-0.028426-0.26050.397545
410.0304140.27870.390562
42-0.012342-0.11310.455106
430.0443220.40620.342807
44-0.015825-0.1450.442514
45-0.061483-0.56350.287297
46-0.04228-0.38750.349681
47-0.03661-0.33550.369029
48-0.020959-0.19210.424068

\begin{tabular}{lllllllll}
\hline
Partial Autocorrelation Function \tabularnewline
Time lag k & PACF(k) & T-STAT & P-value \tabularnewline
1 & 0.91661 & 8.4009 & 0 \tabularnewline
2 & -0.063254 & -0.5797 & 0.281823 \tabularnewline
3 & -0.32114 & -2.9433 & 0.002099 \tabularnewline
4 & 0.102869 & 0.9428 & 0.174242 \tabularnewline
5 & 0.005628 & 0.0516 & 0.479491 \tabularnewline
6 & 0.28005 & 2.5667 & 0.00602 \tabularnewline
7 & 0.136042 & 1.2468 & 0.10796 \tabularnewline
8 & 0.219809 & 2.0146 & 0.023574 \tabularnewline
9 & 0.05158 & 0.4727 & 0.318812 \tabularnewline
10 & 0.172676 & 1.5826 & 0.058635 \tabularnewline
11 & -0.137894 & -1.2638 & 0.104896 \tabularnewline
12 & 0.11852 & 1.0863 & 0.140238 \tabularnewline
13 & -0.487813 & -4.4709 & 1.2e-05 \tabularnewline
14 & -0.043316 & -0.397 & 0.346187 \tabularnewline
15 & 0.070568 & 0.6468 & 0.259773 \tabularnewline
16 & -0.144426 & -1.3237 & 0.094599 \tabularnewline
17 & -0.008898 & -0.0816 & 0.467599 \tabularnewline
18 & -0.106354 & -0.9748 & 0.166241 \tabularnewline
19 & -0.072122 & -0.661 & 0.255208 \tabularnewline
20 & -0.065934 & -0.6043 & 0.273638 \tabularnewline
21 & 0.029607 & 0.2713 & 0.393394 \tabularnewline
22 & 0.040419 & 0.3704 & 0.355991 \tabularnewline
23 & 0.098424 & 0.9021 & 0.1848 \tabularnewline
24 & -0.02915 & -0.2672 & 0.395 \tabularnewline
25 & -0.154993 & -1.4205 & 0.079577 \tabularnewline
26 & 0.076788 & 0.7038 & 0.24176 \tabularnewline
27 & -0.041442 & -0.3798 & 0.352517 \tabularnewline
28 & -0.029873 & -0.2738 & 0.392457 \tabularnewline
29 & -0.019104 & -0.1751 & 0.430714 \tabularnewline
30 & -0.013797 & -0.1265 & 0.449837 \tabularnewline
31 & 0.034176 & 0.3132 & 0.377443 \tabularnewline
32 & -0.072022 & -0.6601 & 0.2555 \tabularnewline
33 & -0.010697 & -0.098 & 0.461068 \tabularnewline
34 & -0.027067 & -0.2481 & 0.402341 \tabularnewline
35 & -0.078025 & -0.7151 & 0.238262 \tabularnewline
36 & 0.058842 & 0.5393 & 0.295556 \tabularnewline
37 & 0.027687 & 0.2538 & 0.400152 \tabularnewline
38 & -0.002443 & -0.0224 & 0.491094 \tabularnewline
39 & -0.013806 & -0.1265 & 0.449807 \tabularnewline
40 & -0.028426 & -0.2605 & 0.397545 \tabularnewline
41 & 0.030414 & 0.2787 & 0.390562 \tabularnewline
42 & -0.012342 & -0.1131 & 0.455106 \tabularnewline
43 & 0.044322 & 0.4062 & 0.342807 \tabularnewline
44 & -0.015825 & -0.145 & 0.442514 \tabularnewline
45 & -0.061483 & -0.5635 & 0.287297 \tabularnewline
46 & -0.04228 & -0.3875 & 0.349681 \tabularnewline
47 & -0.03661 & -0.3355 & 0.369029 \tabularnewline
48 & -0.020959 & -0.1921 & 0.424068 \tabularnewline
\hline
\end{tabular}
%Source: https://freestatistics.org/blog/index.php?pk=78896&T=2

[TABLE]
[ROW][C]Partial Autocorrelation Function[/C][/ROW]
[ROW][C]Time lag k[/C][C]PACF(k)[/C][C]T-STAT[/C][C]P-value[/C][/ROW]
[ROW][C]1[/C][C]0.91661[/C][C]8.4009[/C][C]0[/C][/ROW]
[ROW][C]2[/C][C]-0.063254[/C][C]-0.5797[/C][C]0.281823[/C][/ROW]
[ROW][C]3[/C][C]-0.32114[/C][C]-2.9433[/C][C]0.002099[/C][/ROW]
[ROW][C]4[/C][C]0.102869[/C][C]0.9428[/C][C]0.174242[/C][/ROW]
[ROW][C]5[/C][C]0.005628[/C][C]0.0516[/C][C]0.479491[/C][/ROW]
[ROW][C]6[/C][C]0.28005[/C][C]2.5667[/C][C]0.00602[/C][/ROW]
[ROW][C]7[/C][C]0.136042[/C][C]1.2468[/C][C]0.10796[/C][/ROW]
[ROW][C]8[/C][C]0.219809[/C][C]2.0146[/C][C]0.023574[/C][/ROW]
[ROW][C]9[/C][C]0.05158[/C][C]0.4727[/C][C]0.318812[/C][/ROW]
[ROW][C]10[/C][C]0.172676[/C][C]1.5826[/C][C]0.058635[/C][/ROW]
[ROW][C]11[/C][C]-0.137894[/C][C]-1.2638[/C][C]0.104896[/C][/ROW]
[ROW][C]12[/C][C]0.11852[/C][C]1.0863[/C][C]0.140238[/C][/ROW]
[ROW][C]13[/C][C]-0.487813[/C][C]-4.4709[/C][C]1.2e-05[/C][/ROW]
[ROW][C]14[/C][C]-0.043316[/C][C]-0.397[/C][C]0.346187[/C][/ROW]
[ROW][C]15[/C][C]0.070568[/C][C]0.6468[/C][C]0.259773[/C][/ROW]
[ROW][C]16[/C][C]-0.144426[/C][C]-1.3237[/C][C]0.094599[/C][/ROW]
[ROW][C]17[/C][C]-0.008898[/C][C]-0.0816[/C][C]0.467599[/C][/ROW]
[ROW][C]18[/C][C]-0.106354[/C][C]-0.9748[/C][C]0.166241[/C][/ROW]
[ROW][C]19[/C][C]-0.072122[/C][C]-0.661[/C][C]0.255208[/C][/ROW]
[ROW][C]20[/C][C]-0.065934[/C][C]-0.6043[/C][C]0.273638[/C][/ROW]
[ROW][C]21[/C][C]0.029607[/C][C]0.2713[/C][C]0.393394[/C][/ROW]
[ROW][C]22[/C][C]0.040419[/C][C]0.3704[/C][C]0.355991[/C][/ROW]
[ROW][C]23[/C][C]0.098424[/C][C]0.9021[/C][C]0.1848[/C][/ROW]
[ROW][C]24[/C][C]-0.02915[/C][C]-0.2672[/C][C]0.395[/C][/ROW]
[ROW][C]25[/C][C]-0.154993[/C][C]-1.4205[/C][C]0.079577[/C][/ROW]
[ROW][C]26[/C][C]0.076788[/C][C]0.7038[/C][C]0.24176[/C][/ROW]
[ROW][C]27[/C][C]-0.041442[/C][C]-0.3798[/C][C]0.352517[/C][/ROW]
[ROW][C]28[/C][C]-0.029873[/C][C]-0.2738[/C][C]0.392457[/C][/ROW]
[ROW][C]29[/C][C]-0.019104[/C][C]-0.1751[/C][C]0.430714[/C][/ROW]
[ROW][C]30[/C][C]-0.013797[/C][C]-0.1265[/C][C]0.449837[/C][/ROW]
[ROW][C]31[/C][C]0.034176[/C][C]0.3132[/C][C]0.377443[/C][/ROW]
[ROW][C]32[/C][C]-0.072022[/C][C]-0.6601[/C][C]0.2555[/C][/ROW]
[ROW][C]33[/C][C]-0.010697[/C][C]-0.098[/C][C]0.461068[/C][/ROW]
[ROW][C]34[/C][C]-0.027067[/C][C]-0.2481[/C][C]0.402341[/C][/ROW]
[ROW][C]35[/C][C]-0.078025[/C][C]-0.7151[/C][C]0.238262[/C][/ROW]
[ROW][C]36[/C][C]0.058842[/C][C]0.5393[/C][C]0.295556[/C][/ROW]
[ROW][C]37[/C][C]0.027687[/C][C]0.2538[/C][C]0.400152[/C][/ROW]
[ROW][C]38[/C][C]-0.002443[/C][C]-0.0224[/C][C]0.491094[/C][/ROW]
[ROW][C]39[/C][C]-0.013806[/C][C]-0.1265[/C][C]0.449807[/C][/ROW]
[ROW][C]40[/C][C]-0.028426[/C][C]-0.2605[/C][C]0.397545[/C][/ROW]
[ROW][C]41[/C][C]0.030414[/C][C]0.2787[/C][C]0.390562[/C][/ROW]
[ROW][C]42[/C][C]-0.012342[/C][C]-0.1131[/C][C]0.455106[/C][/ROW]
[ROW][C]43[/C][C]0.044322[/C][C]0.4062[/C][C]0.342807[/C][/ROW]
[ROW][C]44[/C][C]-0.015825[/C][C]-0.145[/C][C]0.442514[/C][/ROW]
[ROW][C]45[/C][C]-0.061483[/C][C]-0.5635[/C][C]0.287297[/C][/ROW]
[ROW][C]46[/C][C]-0.04228[/C][C]-0.3875[/C][C]0.349681[/C][/ROW]
[ROW][C]47[/C][C]-0.03661[/C][C]-0.3355[/C][C]0.369029[/C][/ROW]
[ROW][C]48[/C][C]-0.020959[/C][C]-0.1921[/C][C]0.424068[/C][/ROW]
[/TABLE]
Source: https://freestatistics.org/blog/index.php?pk=78896&T=2

Globally Unique Identifier (entire table): ba.freestatistics.org/blog/index.php?pk=78896&T=2

As an alternative you can also use a QR Code:  

The GUIDs for individual cells are displayed in the table below:

Partial Autocorrelation Function
Time lag kPACF(k)T-STATP-value
10.916618.40090
2-0.063254-0.57970.281823
3-0.32114-2.94330.002099
40.1028690.94280.174242
50.0056280.05160.479491
60.280052.56670.00602
70.1360421.24680.10796
80.2198092.01460.023574
90.051580.47270.318812
100.1726761.58260.058635
11-0.137894-1.26380.104896
120.118521.08630.140238
13-0.487813-4.47091.2e-05
14-0.043316-0.3970.346187
150.0705680.64680.259773
16-0.144426-1.32370.094599
17-0.008898-0.08160.467599
18-0.106354-0.97480.166241
19-0.072122-0.6610.255208
20-0.065934-0.60430.273638
210.0296070.27130.393394
220.0404190.37040.355991
230.0984240.90210.1848
24-0.02915-0.26720.395
25-0.154993-1.42050.079577
260.0767880.70380.24176
27-0.041442-0.37980.352517
28-0.029873-0.27380.392457
29-0.019104-0.17510.430714
30-0.013797-0.12650.449837
310.0341760.31320.377443
32-0.072022-0.66010.2555
33-0.010697-0.0980.461068
34-0.027067-0.24810.402341
35-0.078025-0.71510.238262
360.0588420.53930.295556
370.0276870.25380.400152
38-0.002443-0.02240.491094
39-0.013806-0.12650.449807
40-0.028426-0.26050.397545
410.0304140.27870.390562
42-0.012342-0.11310.455106
430.0443220.40620.342807
44-0.015825-0.1450.442514
45-0.061483-0.56350.287297
46-0.04228-0.38750.349681
47-0.03661-0.33550.369029
48-0.020959-0.19210.424068


Parameters (Session):
Parameters (R input):
par1 = 48 ; par2 = 1 ; par3 = 0 ; par4 = 0 ; par5 = 12 ; par6 = White Noise ; par7 = 0.95 ;
R code (references can be found in the software module):
if (par1 == 'Default') {
par1 = 10*log10(length(x))
} else {
par1 <- as.numeric(par1)
}
par2 <- as.numeric(par2)
par3 <- as.numeric(par3)
par4 <- as.numeric(par4)
par5 <- as.numeric(par5)
if (par6 == 'White Noise') par6 <- 'white' else par6 <- 'ma'
par7 <- as.numeric(par7)
if (par2 == 0) {
x <- log(x)
} else {
x <- (x ^ par2 - 1) / par2
}
if (par3 > 0) x <- diff(x,lag=1,difference=par3)
if (par4 > 0) x <- diff(x,lag=par5,difference=par4)
bitmap(file='pic1.png')
racf <- acf(x, par1, main='Autocorrelation', xlab='time lag', ylab='ACF', ci.type=par6, ci=par7, sub=paste('(lambda=',par2,', d=',par3,', D=',par4,', CI=', par7, ', CI type=',par6,')',sep=''))
dev.off()
bitmap(file='pic2.png')
rpacf <- pacf(x,par1,main='Partial Autocorrelation',xlab='lags',ylab='PACF')
dev.off()
(myacf <- c(racf$acf))
(mypacf <- c(rpacf$acf))
lengthx <- length(x)
sqrtn <- sqrt(lengthx)
load(file='createtable')
a<-table.start()
a<-table.row.start(a)
a<-table.element(a,'Autocorrelation Function',4,TRUE)
a<-table.row.end(a)
a<-table.row.start(a)
a<-table.element(a,'Time lag k',header=TRUE)
a<-table.element(a,hyperlink('basics.htm','ACF(k)','click here for more information about the Autocorrelation Function'),header=TRUE)
a<-table.element(a,'T-STAT',header=TRUE)
a<-table.element(a,'P-value',header=TRUE)
a<-table.row.end(a)
for (i in 2:(par1+1)) {
a<-table.row.start(a)
a<-table.element(a,i-1,header=TRUE)
a<-table.element(a,round(myacf[i],6))
mytstat <- myacf[i]*sqrtn
a<-table.element(a,round(mytstat,4))
a<-table.element(a,round(1-pt(abs(mytstat),lengthx),6))
a<-table.row.end(a)
}
a<-table.end(a)
table.save(a,file='mytable.tab')
a<-table.start()
a<-table.row.start(a)
a<-table.element(a,'Partial Autocorrelation Function',4,TRUE)
a<-table.row.end(a)
a<-table.row.start(a)
a<-table.element(a,'Time lag k',header=TRUE)
a<-table.element(a,hyperlink('basics.htm','PACF(k)','click here for more information about the Partial Autocorrelation Function'),header=TRUE)
a<-table.element(a,'T-STAT',header=TRUE)
a<-table.element(a,'P-value',header=TRUE)
a<-table.row.end(a)
for (i in 1:par1) {
a<-table.row.start(a)
a<-table.element(a,i,header=TRUE)
a<-table.element(a,round(mypacf[i],6))
mytstat <- mypacf[i]*sqrtn
a<-table.element(a,round(mytstat,4))
a<-table.element(a,round(1-pt(abs(mytstat),lengthx),6))
a<-table.row.end(a)
}
a<-table.end(a)
table.save(a,file='mytable1.tab')