Free Statistics

of Irreproducible Research!

Author's title

Author*Unverified author*
R Software Modulerwasp_autocorrelation.wasp
Title produced by software(Partial) Autocorrelation Function
Date of computationMon, 16 Aug 2010 13:23:29 +0000
Cite this page as followsStatistical Computations at FreeStatistics.org, Office for Research Development and Education, URL https://freestatistics.org/blog/index.php?v=date/2010/Aug/16/t1281964987tq3sh7o7657gnkg.htm/, Retrieved Sat, 11 May 2024 22:33:34 +0000
Statistical Computations at FreeStatistics.org, Office for Research Development and Education, URL https://freestatistics.org/blog/index.php?pk=78989, Retrieved Sat, 11 May 2024 22:33:34 +0000
QR Codes:

Original text written by user:
IsPrivate?No (this computation is public)
User-defined keywords
Estimated Impact116
Family? (F = Feedback message, R = changed R code, M = changed R Module, P = changed Parameters, D = changed Data)
-     [Mean Plot] [Mean vs Median pl...] [2010-08-15 15:07:22] [f5ecd041e4b32af12787a4e421b18aaf]
-   P   [Mean Plot] [Mean&Median Plot ...] [2010-08-15 15:22:42] [f5ecd041e4b32af12787a4e421b18aaf]
- RM      [(Partial) Autocorrelation Function] [Partial omzet pro...] [2010-08-15 15:56:49] [f5ecd041e4b32af12787a4e421b18aaf]
-   P         [(Partial) Autocorrelation Function] [Partial gedif. om...] [2010-08-16 13:23:29] [05b8da000f2ebbd12b039a4b088dd3f2] [Current]
Feedback Forum

Post a new message
Dataseries X:
118
117
116
114
112
111
112
114
115
115
116
118
126
131
122
124
119
112
109
108
117
122
127
124
129
141
127
133
114
98
93
101
111
128
126
134
140
158
144
146
138
119
113
120
127
141
144
150
156
174
163
167
160
141
132
144
155
164
162
181
187
209
189
201
193
177
159
158
155
164
163
185
191
217
193
192
184
166
145
146
138
149
145
166


Summary of computational transaction
Raw Inputview raw input (R code)
Raw Outputview raw output of R engine
Computing time1 seconds
R Server'George Udny Yule' @ 72.249.76.132

\begin{tabular}{lllllllll}
\hline
Summary of computational transaction \tabularnewline
Raw Input & view raw input (R code)  \tabularnewline
Raw Output & view raw output of R engine  \tabularnewline
Computing time & 1 seconds \tabularnewline
R Server & 'George Udny Yule' @ 72.249.76.132 \tabularnewline
\hline
\end{tabular}
%Source: https://freestatistics.org/blog/index.php?pk=78989&T=0

[TABLE]
[ROW][C]Summary of computational transaction[/C][/ROW]
[ROW][C]Raw Input[/C][C]view raw input (R code) [/C][/ROW]
[ROW][C]Raw Output[/C][C]view raw output of R engine [/C][/ROW]
[ROW][C]Computing time[/C][C]1 seconds[/C][/ROW]
[ROW][C]R Server[/C][C]'George Udny Yule' @ 72.249.76.132[/C][/ROW]
[/TABLE]
Source: https://freestatistics.org/blog/index.php?pk=78989&T=0

Globally Unique Identifier (entire table): ba.freestatistics.org/blog/index.php?pk=78989&T=0

As an alternative you can also use a QR Code:  

The GUIDs for individual cells are displayed in the table below:

Summary of computational transaction
Raw Inputview raw input (R code)
Raw Outputview raw output of R engine
Computing time1 seconds
R Server'George Udny Yule' @ 72.249.76.132


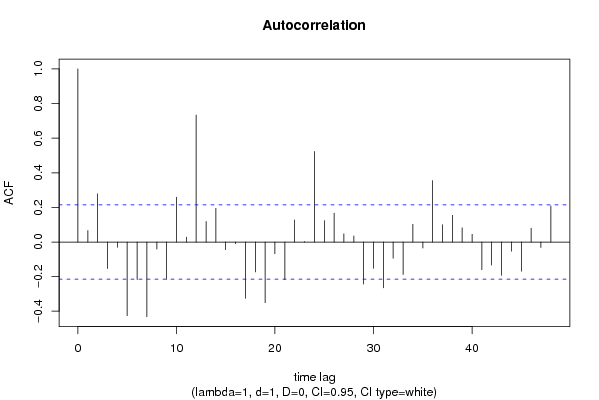
Autocorrelation Function
Time lag kACF(k)T-STATP-value
10.0662480.60350.273894
20.2786462.53860.006499
3-0.153464-1.39810.082901
4-0.030119-0.27440.392232
5-0.425371-3.87530.000106
6-0.217016-1.97710.025674
7-0.431284-3.92928.8e-05
8-0.040974-0.37330.354943
9-0.215315-1.96160.02658
100.2592632.3620.010259
110.0276440.25180.400891
120.7336676.6840
130.11871.08140.141325
140.1950281.77680.039633
15-0.044427-0.40470.343352
16-0.010527-0.09590.461913
17-0.325029-2.96120.001998
18-0.172992-1.5760.059411
19-0.35044-3.19270.000996
20-0.067918-0.61880.268885
21-0.217169-1.97850.025594
220.1278521.16480.123721
230.0022740.02070.491762
240.5232384.76694e-06
250.1241021.13060.130735
260.1667861.51950.066219
270.0474390.43220.333362
280.0354150.32260.373886
29-0.242177-2.20630.015062
30-0.152063-1.38540.084827
31-0.264754-2.4120.009035
32-0.094241-0.85860.196523
33-0.187697-1.710.045501
340.102470.93350.176624
35-0.034833-0.31730.37589
360.354883.23310.000879
370.1003680.91440.18158
380.1544721.40730.081535
390.08210.7480.228298
400.0446340.40660.34266
41-0.159662-1.45460.074777
42-0.133249-1.2140.114104
43-0.192519-1.75390.041566
44-0.052951-0.48240.315392
45-0.168364-1.53390.064432
460.0796720.72580.234987
47-0.031206-0.28430.388446
480.2088091.90230.030297

\begin{tabular}{lllllllll}
\hline
Autocorrelation Function \tabularnewline
Time lag k & ACF(k) & T-STAT & P-value \tabularnewline
1 & 0.066248 & 0.6035 & 0.273894 \tabularnewline
2 & 0.278646 & 2.5386 & 0.006499 \tabularnewline
3 & -0.153464 & -1.3981 & 0.082901 \tabularnewline
4 & -0.030119 & -0.2744 & 0.392232 \tabularnewline
5 & -0.425371 & -3.8753 & 0.000106 \tabularnewline
6 & -0.217016 & -1.9771 & 0.025674 \tabularnewline
7 & -0.431284 & -3.9292 & 8.8e-05 \tabularnewline
8 & -0.040974 & -0.3733 & 0.354943 \tabularnewline
9 & -0.215315 & -1.9616 & 0.02658 \tabularnewline
10 & 0.259263 & 2.362 & 0.010259 \tabularnewline
11 & 0.027644 & 0.2518 & 0.400891 \tabularnewline
12 & 0.733667 & 6.684 & 0 \tabularnewline
13 & 0.1187 & 1.0814 & 0.141325 \tabularnewline
14 & 0.195028 & 1.7768 & 0.039633 \tabularnewline
15 & -0.044427 & -0.4047 & 0.343352 \tabularnewline
16 & -0.010527 & -0.0959 & 0.461913 \tabularnewline
17 & -0.325029 & -2.9612 & 0.001998 \tabularnewline
18 & -0.172992 & -1.576 & 0.059411 \tabularnewline
19 & -0.35044 & -3.1927 & 0.000996 \tabularnewline
20 & -0.067918 & -0.6188 & 0.268885 \tabularnewline
21 & -0.217169 & -1.9785 & 0.025594 \tabularnewline
22 & 0.127852 & 1.1648 & 0.123721 \tabularnewline
23 & 0.002274 & 0.0207 & 0.491762 \tabularnewline
24 & 0.523238 & 4.7669 & 4e-06 \tabularnewline
25 & 0.124102 & 1.1306 & 0.130735 \tabularnewline
26 & 0.166786 & 1.5195 & 0.066219 \tabularnewline
27 & 0.047439 & 0.4322 & 0.333362 \tabularnewline
28 & 0.035415 & 0.3226 & 0.373886 \tabularnewline
29 & -0.242177 & -2.2063 & 0.015062 \tabularnewline
30 & -0.152063 & -1.3854 & 0.084827 \tabularnewline
31 & -0.264754 & -2.412 & 0.009035 \tabularnewline
32 & -0.094241 & -0.8586 & 0.196523 \tabularnewline
33 & -0.187697 & -1.71 & 0.045501 \tabularnewline
34 & 0.10247 & 0.9335 & 0.176624 \tabularnewline
35 & -0.034833 & -0.3173 & 0.37589 \tabularnewline
36 & 0.35488 & 3.2331 & 0.000879 \tabularnewline
37 & 0.100368 & 0.9144 & 0.18158 \tabularnewline
38 & 0.154472 & 1.4073 & 0.081535 \tabularnewline
39 & 0.0821 & 0.748 & 0.228298 \tabularnewline
40 & 0.044634 & 0.4066 & 0.34266 \tabularnewline
41 & -0.159662 & -1.4546 & 0.074777 \tabularnewline
42 & -0.133249 & -1.214 & 0.114104 \tabularnewline
43 & -0.192519 & -1.7539 & 0.041566 \tabularnewline
44 & -0.052951 & -0.4824 & 0.315392 \tabularnewline
45 & -0.168364 & -1.5339 & 0.064432 \tabularnewline
46 & 0.079672 & 0.7258 & 0.234987 \tabularnewline
47 & -0.031206 & -0.2843 & 0.388446 \tabularnewline
48 & 0.208809 & 1.9023 & 0.030297 \tabularnewline
\hline
\end{tabular}
%Source: https://freestatistics.org/blog/index.php?pk=78989&T=1

[TABLE]
[ROW][C]Autocorrelation Function[/C][/ROW]
[ROW][C]Time lag k[/C][C]ACF(k)[/C][C]T-STAT[/C][C]P-value[/C][/ROW]
[ROW][C]1[/C][C]0.066248[/C][C]0.6035[/C][C]0.273894[/C][/ROW]
[ROW][C]2[/C][C]0.278646[/C][C]2.5386[/C][C]0.006499[/C][/ROW]
[ROW][C]3[/C][C]-0.153464[/C][C]-1.3981[/C][C]0.082901[/C][/ROW]
[ROW][C]4[/C][C]-0.030119[/C][C]-0.2744[/C][C]0.392232[/C][/ROW]
[ROW][C]5[/C][C]-0.425371[/C][C]-3.8753[/C][C]0.000106[/C][/ROW]
[ROW][C]6[/C][C]-0.217016[/C][C]-1.9771[/C][C]0.025674[/C][/ROW]
[ROW][C]7[/C][C]-0.431284[/C][C]-3.9292[/C][C]8.8e-05[/C][/ROW]
[ROW][C]8[/C][C]-0.040974[/C][C]-0.3733[/C][C]0.354943[/C][/ROW]
[ROW][C]9[/C][C]-0.215315[/C][C]-1.9616[/C][C]0.02658[/C][/ROW]
[ROW][C]10[/C][C]0.259263[/C][C]2.362[/C][C]0.010259[/C][/ROW]
[ROW][C]11[/C][C]0.027644[/C][C]0.2518[/C][C]0.400891[/C][/ROW]
[ROW][C]12[/C][C]0.733667[/C][C]6.684[/C][C]0[/C][/ROW]
[ROW][C]13[/C][C]0.1187[/C][C]1.0814[/C][C]0.141325[/C][/ROW]
[ROW][C]14[/C][C]0.195028[/C][C]1.7768[/C][C]0.039633[/C][/ROW]
[ROW][C]15[/C][C]-0.044427[/C][C]-0.4047[/C][C]0.343352[/C][/ROW]
[ROW][C]16[/C][C]-0.010527[/C][C]-0.0959[/C][C]0.461913[/C][/ROW]
[ROW][C]17[/C][C]-0.325029[/C][C]-2.9612[/C][C]0.001998[/C][/ROW]
[ROW][C]18[/C][C]-0.172992[/C][C]-1.576[/C][C]0.059411[/C][/ROW]
[ROW][C]19[/C][C]-0.35044[/C][C]-3.1927[/C][C]0.000996[/C][/ROW]
[ROW][C]20[/C][C]-0.067918[/C][C]-0.6188[/C][C]0.268885[/C][/ROW]
[ROW][C]21[/C][C]-0.217169[/C][C]-1.9785[/C][C]0.025594[/C][/ROW]
[ROW][C]22[/C][C]0.127852[/C][C]1.1648[/C][C]0.123721[/C][/ROW]
[ROW][C]23[/C][C]0.002274[/C][C]0.0207[/C][C]0.491762[/C][/ROW]
[ROW][C]24[/C][C]0.523238[/C][C]4.7669[/C][C]4e-06[/C][/ROW]
[ROW][C]25[/C][C]0.124102[/C][C]1.1306[/C][C]0.130735[/C][/ROW]
[ROW][C]26[/C][C]0.166786[/C][C]1.5195[/C][C]0.066219[/C][/ROW]
[ROW][C]27[/C][C]0.047439[/C][C]0.4322[/C][C]0.333362[/C][/ROW]
[ROW][C]28[/C][C]0.035415[/C][C]0.3226[/C][C]0.373886[/C][/ROW]
[ROW][C]29[/C][C]-0.242177[/C][C]-2.2063[/C][C]0.015062[/C][/ROW]
[ROW][C]30[/C][C]-0.152063[/C][C]-1.3854[/C][C]0.084827[/C][/ROW]
[ROW][C]31[/C][C]-0.264754[/C][C]-2.412[/C][C]0.009035[/C][/ROW]
[ROW][C]32[/C][C]-0.094241[/C][C]-0.8586[/C][C]0.196523[/C][/ROW]
[ROW][C]33[/C][C]-0.187697[/C][C]-1.71[/C][C]0.045501[/C][/ROW]
[ROW][C]34[/C][C]0.10247[/C][C]0.9335[/C][C]0.176624[/C][/ROW]
[ROW][C]35[/C][C]-0.034833[/C][C]-0.3173[/C][C]0.37589[/C][/ROW]
[ROW][C]36[/C][C]0.35488[/C][C]3.2331[/C][C]0.000879[/C][/ROW]
[ROW][C]37[/C][C]0.100368[/C][C]0.9144[/C][C]0.18158[/C][/ROW]
[ROW][C]38[/C][C]0.154472[/C][C]1.4073[/C][C]0.081535[/C][/ROW]
[ROW][C]39[/C][C]0.0821[/C][C]0.748[/C][C]0.228298[/C][/ROW]
[ROW][C]40[/C][C]0.044634[/C][C]0.4066[/C][C]0.34266[/C][/ROW]
[ROW][C]41[/C][C]-0.159662[/C][C]-1.4546[/C][C]0.074777[/C][/ROW]
[ROW][C]42[/C][C]-0.133249[/C][C]-1.214[/C][C]0.114104[/C][/ROW]
[ROW][C]43[/C][C]-0.192519[/C][C]-1.7539[/C][C]0.041566[/C][/ROW]
[ROW][C]44[/C][C]-0.052951[/C][C]-0.4824[/C][C]0.315392[/C][/ROW]
[ROW][C]45[/C][C]-0.168364[/C][C]-1.5339[/C][C]0.064432[/C][/ROW]
[ROW][C]46[/C][C]0.079672[/C][C]0.7258[/C][C]0.234987[/C][/ROW]
[ROW][C]47[/C][C]-0.031206[/C][C]-0.2843[/C][C]0.388446[/C][/ROW]
[ROW][C]48[/C][C]0.208809[/C][C]1.9023[/C][C]0.030297[/C][/ROW]
[/TABLE]
Source: https://freestatistics.org/blog/index.php?pk=78989&T=1

Globally Unique Identifier (entire table): ba.freestatistics.org/blog/index.php?pk=78989&T=1

As an alternative you can also use a QR Code:  

The GUIDs for individual cells are displayed in the table below:

Autocorrelation Function
Time lag kACF(k)T-STATP-value
10.0662480.60350.273894
20.2786462.53860.006499
3-0.153464-1.39810.082901
4-0.030119-0.27440.392232
5-0.425371-3.87530.000106
6-0.217016-1.97710.025674
7-0.431284-3.92928.8e-05
8-0.040974-0.37330.354943
9-0.215315-1.96160.02658
100.2592632.3620.010259
110.0276440.25180.400891
120.7336676.6840
130.11871.08140.141325
140.1950281.77680.039633
15-0.044427-0.40470.343352
16-0.010527-0.09590.461913
17-0.325029-2.96120.001998
18-0.172992-1.5760.059411
19-0.35044-3.19270.000996
20-0.067918-0.61880.268885
21-0.217169-1.97850.025594
220.1278521.16480.123721
230.0022740.02070.491762
240.5232384.76694e-06
250.1241021.13060.130735
260.1667861.51950.066219
270.0474390.43220.333362
280.0354150.32260.373886
29-0.242177-2.20630.015062
30-0.152063-1.38540.084827
31-0.264754-2.4120.009035
32-0.094241-0.85860.196523
33-0.187697-1.710.045501
340.102470.93350.176624
35-0.034833-0.31730.37589
360.354883.23310.000879
370.1003680.91440.18158
380.1544721.40730.081535
390.08210.7480.228298
400.0446340.40660.34266
41-0.159662-1.45460.074777
42-0.133249-1.2140.114104
43-0.192519-1.75390.041566
44-0.052951-0.48240.315392
45-0.168364-1.53390.064432
460.0796720.72580.234987
47-0.031206-0.28430.388446
480.2088091.90230.030297


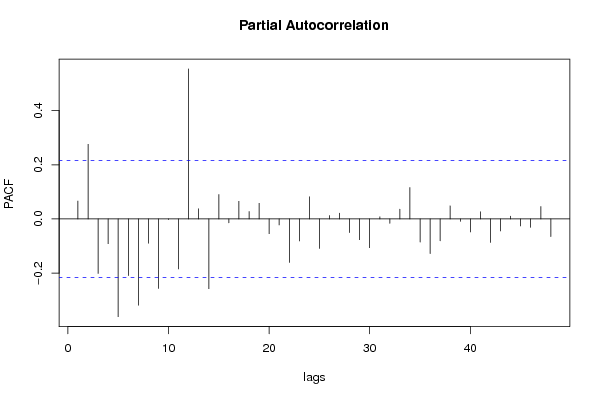
Partial Autocorrelation Function
Time lag kPACF(k)T-STATP-value
10.0662480.60350.273894
20.2754662.50960.007015
3-0.201169-1.83270.035214
4-0.091036-0.82940.204634
5-0.360482-3.28410.000749
6-0.208741-1.90170.030338
7-0.318279-2.89970.00239
8-0.089421-0.81470.208798
9-0.256392-2.33580.010956
10-0.002266-0.02060.491788
11-0.184491-1.68080.048282
120.5534745.04241e-06
130.0375430.3420.366595
14-0.257536-2.34630.010673
150.0898880.81890.207589
16-0.014221-0.12960.448612
170.0650010.59220.277666
180.0272960.24870.402111
190.0575780.52460.300645
20-0.054191-0.49370.31141
21-0.021972-0.20020.420916
22-0.160606-1.46320.073596
23-0.081307-0.74070.230469
240.0819390.74650.228737
25-0.10896-0.99270.161878
260.0125530.11440.454612
270.0213780.19480.423026
28-0.05017-0.45710.324408
29-0.076662-0.69840.243433
30-0.106119-0.96680.168229
310.0077520.07060.471933
32-0.015887-0.14470.442633
330.0358280.32640.372469
340.1156821.05390.147491
35-0.085488-0.77880.219146
36-0.127627-1.16270.124135
37-0.080823-0.73630.231803
380.0482580.43970.330666
39-0.008503-0.07750.469219
40-0.048154-0.43870.331009
410.0265640.2420.404686
42-0.086422-0.78730.216663
43-0.044097-0.40170.344452
440.0103230.0940.462648
45-0.025741-0.23450.407584
46-0.030898-0.28150.389515
470.0459320.41850.338346
48-0.064791-0.59030.278304

\begin{tabular}{lllllllll}
\hline
Partial Autocorrelation Function \tabularnewline
Time lag k & PACF(k) & T-STAT & P-value \tabularnewline
1 & 0.066248 & 0.6035 & 0.273894 \tabularnewline
2 & 0.275466 & 2.5096 & 0.007015 \tabularnewline
3 & -0.201169 & -1.8327 & 0.035214 \tabularnewline
4 & -0.091036 & -0.8294 & 0.204634 \tabularnewline
5 & -0.360482 & -3.2841 & 0.000749 \tabularnewline
6 & -0.208741 & -1.9017 & 0.030338 \tabularnewline
7 & -0.318279 & -2.8997 & 0.00239 \tabularnewline
8 & -0.089421 & -0.8147 & 0.208798 \tabularnewline
9 & -0.256392 & -2.3358 & 0.010956 \tabularnewline
10 & -0.002266 & -0.0206 & 0.491788 \tabularnewline
11 & -0.184491 & -1.6808 & 0.048282 \tabularnewline
12 & 0.553474 & 5.0424 & 1e-06 \tabularnewline
13 & 0.037543 & 0.342 & 0.366595 \tabularnewline
14 & -0.257536 & -2.3463 & 0.010673 \tabularnewline
15 & 0.089888 & 0.8189 & 0.207589 \tabularnewline
16 & -0.014221 & -0.1296 & 0.448612 \tabularnewline
17 & 0.065001 & 0.5922 & 0.277666 \tabularnewline
18 & 0.027296 & 0.2487 & 0.402111 \tabularnewline
19 & 0.057578 & 0.5246 & 0.300645 \tabularnewline
20 & -0.054191 & -0.4937 & 0.31141 \tabularnewline
21 & -0.021972 & -0.2002 & 0.420916 \tabularnewline
22 & -0.160606 & -1.4632 & 0.073596 \tabularnewline
23 & -0.081307 & -0.7407 & 0.230469 \tabularnewline
24 & 0.081939 & 0.7465 & 0.228737 \tabularnewline
25 & -0.10896 & -0.9927 & 0.161878 \tabularnewline
26 & 0.012553 & 0.1144 & 0.454612 \tabularnewline
27 & 0.021378 & 0.1948 & 0.423026 \tabularnewline
28 & -0.05017 & -0.4571 & 0.324408 \tabularnewline
29 & -0.076662 & -0.6984 & 0.243433 \tabularnewline
30 & -0.106119 & -0.9668 & 0.168229 \tabularnewline
31 & 0.007752 & 0.0706 & 0.471933 \tabularnewline
32 & -0.015887 & -0.1447 & 0.442633 \tabularnewline
33 & 0.035828 & 0.3264 & 0.372469 \tabularnewline
34 & 0.115682 & 1.0539 & 0.147491 \tabularnewline
35 & -0.085488 & -0.7788 & 0.219146 \tabularnewline
36 & -0.127627 & -1.1627 & 0.124135 \tabularnewline
37 & -0.080823 & -0.7363 & 0.231803 \tabularnewline
38 & 0.048258 & 0.4397 & 0.330666 \tabularnewline
39 & -0.008503 & -0.0775 & 0.469219 \tabularnewline
40 & -0.048154 & -0.4387 & 0.331009 \tabularnewline
41 & 0.026564 & 0.242 & 0.404686 \tabularnewline
42 & -0.086422 & -0.7873 & 0.216663 \tabularnewline
43 & -0.044097 & -0.4017 & 0.344452 \tabularnewline
44 & 0.010323 & 0.094 & 0.462648 \tabularnewline
45 & -0.025741 & -0.2345 & 0.407584 \tabularnewline
46 & -0.030898 & -0.2815 & 0.389515 \tabularnewline
47 & 0.045932 & 0.4185 & 0.338346 \tabularnewline
48 & -0.064791 & -0.5903 & 0.278304 \tabularnewline
\hline
\end{tabular}
%Source: https://freestatistics.org/blog/index.php?pk=78989&T=2

[TABLE]
[ROW][C]Partial Autocorrelation Function[/C][/ROW]
[ROW][C]Time lag k[/C][C]PACF(k)[/C][C]T-STAT[/C][C]P-value[/C][/ROW]
[ROW][C]1[/C][C]0.066248[/C][C]0.6035[/C][C]0.273894[/C][/ROW]
[ROW][C]2[/C][C]0.275466[/C][C]2.5096[/C][C]0.007015[/C][/ROW]
[ROW][C]3[/C][C]-0.201169[/C][C]-1.8327[/C][C]0.035214[/C][/ROW]
[ROW][C]4[/C][C]-0.091036[/C][C]-0.8294[/C][C]0.204634[/C][/ROW]
[ROW][C]5[/C][C]-0.360482[/C][C]-3.2841[/C][C]0.000749[/C][/ROW]
[ROW][C]6[/C][C]-0.208741[/C][C]-1.9017[/C][C]0.030338[/C][/ROW]
[ROW][C]7[/C][C]-0.318279[/C][C]-2.8997[/C][C]0.00239[/C][/ROW]
[ROW][C]8[/C][C]-0.089421[/C][C]-0.8147[/C][C]0.208798[/C][/ROW]
[ROW][C]9[/C][C]-0.256392[/C][C]-2.3358[/C][C]0.010956[/C][/ROW]
[ROW][C]10[/C][C]-0.002266[/C][C]-0.0206[/C][C]0.491788[/C][/ROW]
[ROW][C]11[/C][C]-0.184491[/C][C]-1.6808[/C][C]0.048282[/C][/ROW]
[ROW][C]12[/C][C]0.553474[/C][C]5.0424[/C][C]1e-06[/C][/ROW]
[ROW][C]13[/C][C]0.037543[/C][C]0.342[/C][C]0.366595[/C][/ROW]
[ROW][C]14[/C][C]-0.257536[/C][C]-2.3463[/C][C]0.010673[/C][/ROW]
[ROW][C]15[/C][C]0.089888[/C][C]0.8189[/C][C]0.207589[/C][/ROW]
[ROW][C]16[/C][C]-0.014221[/C][C]-0.1296[/C][C]0.448612[/C][/ROW]
[ROW][C]17[/C][C]0.065001[/C][C]0.5922[/C][C]0.277666[/C][/ROW]
[ROW][C]18[/C][C]0.027296[/C][C]0.2487[/C][C]0.402111[/C][/ROW]
[ROW][C]19[/C][C]0.057578[/C][C]0.5246[/C][C]0.300645[/C][/ROW]
[ROW][C]20[/C][C]-0.054191[/C][C]-0.4937[/C][C]0.31141[/C][/ROW]
[ROW][C]21[/C][C]-0.021972[/C][C]-0.2002[/C][C]0.420916[/C][/ROW]
[ROW][C]22[/C][C]-0.160606[/C][C]-1.4632[/C][C]0.073596[/C][/ROW]
[ROW][C]23[/C][C]-0.081307[/C][C]-0.7407[/C][C]0.230469[/C][/ROW]
[ROW][C]24[/C][C]0.081939[/C][C]0.7465[/C][C]0.228737[/C][/ROW]
[ROW][C]25[/C][C]-0.10896[/C][C]-0.9927[/C][C]0.161878[/C][/ROW]
[ROW][C]26[/C][C]0.012553[/C][C]0.1144[/C][C]0.454612[/C][/ROW]
[ROW][C]27[/C][C]0.021378[/C][C]0.1948[/C][C]0.423026[/C][/ROW]
[ROW][C]28[/C][C]-0.05017[/C][C]-0.4571[/C][C]0.324408[/C][/ROW]
[ROW][C]29[/C][C]-0.076662[/C][C]-0.6984[/C][C]0.243433[/C][/ROW]
[ROW][C]30[/C][C]-0.106119[/C][C]-0.9668[/C][C]0.168229[/C][/ROW]
[ROW][C]31[/C][C]0.007752[/C][C]0.0706[/C][C]0.471933[/C][/ROW]
[ROW][C]32[/C][C]-0.015887[/C][C]-0.1447[/C][C]0.442633[/C][/ROW]
[ROW][C]33[/C][C]0.035828[/C][C]0.3264[/C][C]0.372469[/C][/ROW]
[ROW][C]34[/C][C]0.115682[/C][C]1.0539[/C][C]0.147491[/C][/ROW]
[ROW][C]35[/C][C]-0.085488[/C][C]-0.7788[/C][C]0.219146[/C][/ROW]
[ROW][C]36[/C][C]-0.127627[/C][C]-1.1627[/C][C]0.124135[/C][/ROW]
[ROW][C]37[/C][C]-0.080823[/C][C]-0.7363[/C][C]0.231803[/C][/ROW]
[ROW][C]38[/C][C]0.048258[/C][C]0.4397[/C][C]0.330666[/C][/ROW]
[ROW][C]39[/C][C]-0.008503[/C][C]-0.0775[/C][C]0.469219[/C][/ROW]
[ROW][C]40[/C][C]-0.048154[/C][C]-0.4387[/C][C]0.331009[/C][/ROW]
[ROW][C]41[/C][C]0.026564[/C][C]0.242[/C][C]0.404686[/C][/ROW]
[ROW][C]42[/C][C]-0.086422[/C][C]-0.7873[/C][C]0.216663[/C][/ROW]
[ROW][C]43[/C][C]-0.044097[/C][C]-0.4017[/C][C]0.344452[/C][/ROW]
[ROW][C]44[/C][C]0.010323[/C][C]0.094[/C][C]0.462648[/C][/ROW]
[ROW][C]45[/C][C]-0.025741[/C][C]-0.2345[/C][C]0.407584[/C][/ROW]
[ROW][C]46[/C][C]-0.030898[/C][C]-0.2815[/C][C]0.389515[/C][/ROW]
[ROW][C]47[/C][C]0.045932[/C][C]0.4185[/C][C]0.338346[/C][/ROW]
[ROW][C]48[/C][C]-0.064791[/C][C]-0.5903[/C][C]0.278304[/C][/ROW]
[/TABLE]
Source: https://freestatistics.org/blog/index.php?pk=78989&T=2

Globally Unique Identifier (entire table): ba.freestatistics.org/blog/index.php?pk=78989&T=2

As an alternative you can also use a QR Code:  

The GUIDs for individual cells are displayed in the table below:

Partial Autocorrelation Function
Time lag kPACF(k)T-STATP-value
10.0662480.60350.273894
20.2754662.50960.007015
3-0.201169-1.83270.035214
4-0.091036-0.82940.204634
5-0.360482-3.28410.000749
6-0.208741-1.90170.030338
7-0.318279-2.89970.00239
8-0.089421-0.81470.208798
9-0.256392-2.33580.010956
10-0.002266-0.02060.491788
11-0.184491-1.68080.048282
120.5534745.04241e-06
130.0375430.3420.366595
14-0.257536-2.34630.010673
150.0898880.81890.207589
16-0.014221-0.12960.448612
170.0650010.59220.277666
180.0272960.24870.402111
190.0575780.52460.300645
20-0.054191-0.49370.31141
21-0.021972-0.20020.420916
22-0.160606-1.46320.073596
23-0.081307-0.74070.230469
240.0819390.74650.228737
25-0.10896-0.99270.161878
260.0125530.11440.454612
270.0213780.19480.423026
28-0.05017-0.45710.324408
29-0.076662-0.69840.243433
30-0.106119-0.96680.168229
310.0077520.07060.471933
32-0.015887-0.14470.442633
330.0358280.32640.372469
340.1156821.05390.147491
35-0.085488-0.77880.219146
36-0.127627-1.16270.124135
37-0.080823-0.73630.231803
380.0482580.43970.330666
39-0.008503-0.07750.469219
40-0.048154-0.43870.331009
410.0265640.2420.404686
42-0.086422-0.78730.216663
43-0.044097-0.40170.344452
440.0103230.0940.462648
45-0.025741-0.23450.407584
46-0.030898-0.28150.389515
470.0459320.41850.338346
48-0.064791-0.59030.278304


Parameters (Session):
par1 = 48 ; par2 = 1 ; par3 = 1 ; par4 = 0 ; par5 = 12 ; par6 = White Noise ; par7 = 0.95 ;
Parameters (R input):
par1 = 48 ; par2 = 1 ; par3 = 1 ; par4 = 0 ; par5 = 12 ; par6 = White Noise ; par7 = 0.95 ;
R code (references can be found in the software module):
if (par1 == 'Default') {
par1 = 10*log10(length(x))
} else {
par1 <- as.numeric(par1)
}
par2 <- as.numeric(par2)
par3 <- as.numeric(par3)
par4 <- as.numeric(par4)
par5 <- as.numeric(par5)
if (par6 == 'White Noise') par6 <- 'white' else par6 <- 'ma'
par7 <- as.numeric(par7)
if (par2 == 0) {
x <- log(x)
} else {
x <- (x ^ par2 - 1) / par2
}
if (par3 > 0) x <- diff(x,lag=1,difference=par3)
if (par4 > 0) x <- diff(x,lag=par5,difference=par4)
bitmap(file='pic1.png')
racf <- acf(x, par1, main='Autocorrelation', xlab='time lag', ylab='ACF', ci.type=par6, ci=par7, sub=paste('(lambda=',par2,', d=',par3,', D=',par4,', CI=', par7, ', CI type=',par6,')',sep=''))
dev.off()
bitmap(file='pic2.png')
rpacf <- pacf(x,par1,main='Partial Autocorrelation',xlab='lags',ylab='PACF')
dev.off()
(myacf <- c(racf$acf))
(mypacf <- c(rpacf$acf))
lengthx <- length(x)
sqrtn <- sqrt(lengthx)
load(file='createtable')
a<-table.start()
a<-table.row.start(a)
a<-table.element(a,'Autocorrelation Function',4,TRUE)
a<-table.row.end(a)
a<-table.row.start(a)
a<-table.element(a,'Time lag k',header=TRUE)
a<-table.element(a,hyperlink('basics.htm','ACF(k)','click here for more information about the Autocorrelation Function'),header=TRUE)
a<-table.element(a,'T-STAT',header=TRUE)
a<-table.element(a,'P-value',header=TRUE)
a<-table.row.end(a)
for (i in 2:(par1+1)) {
a<-table.row.start(a)
a<-table.element(a,i-1,header=TRUE)
a<-table.element(a,round(myacf[i],6))
mytstat <- myacf[i]*sqrtn
a<-table.element(a,round(mytstat,4))
a<-table.element(a,round(1-pt(abs(mytstat),lengthx),6))
a<-table.row.end(a)
}
a<-table.end(a)
table.save(a,file='mytable.tab')
a<-table.start()
a<-table.row.start(a)
a<-table.element(a,'Partial Autocorrelation Function',4,TRUE)
a<-table.row.end(a)
a<-table.row.start(a)
a<-table.element(a,'Time lag k',header=TRUE)
a<-table.element(a,hyperlink('basics.htm','PACF(k)','click here for more information about the Partial Autocorrelation Function'),header=TRUE)
a<-table.element(a,'T-STAT',header=TRUE)
a<-table.element(a,'P-value',header=TRUE)
a<-table.row.end(a)
for (i in 1:par1) {
a<-table.row.start(a)
a<-table.element(a,i,header=TRUE)
a<-table.element(a,round(mypacf[i],6))
mytstat <- mypacf[i]*sqrtn
a<-table.element(a,round(mytstat,4))
a<-table.element(a,round(1-pt(abs(mytstat),lengthx),6))
a<-table.row.end(a)
}
a<-table.end(a)
table.save(a,file='mytable1.tab')