Free Statistics

of Irreproducible Research!

Author's title

Author*The author of this computation has been verified*
R Software Modulerwasp_boxcoxlin.wasp
Title produced by softwareBox-Cox Linearity Plot
Date of computationWed, 12 Nov 2008 04:30:21 -0700
Cite this page as followsStatistical Computations at FreeStatistics.org, Office for Research Development and Education, URL https://freestatistics.org/blog/index.php?v=date/2008/Nov/12/t1226489503tmez5wtt6u2f2cd.htm/, Retrieved Sun, 19 May 2024 08:47:18 +0000
Statistical Computations at FreeStatistics.org, Office for Research Development and Education, URL https://freestatistics.org/blog/index.php?pk=24134, Retrieved Sun, 19 May 2024 08:47:18 +0000
QR Codes:

Original text written by user:
IsPrivate?No (this computation is public)
User-defined keywordsVarious topics about EDA
Estimated Impact205
Family? (F = Feedback message, R = changed R code, M = changed R Module, P = changed Parameters, D = changed Data)
-     [(Partial) Autocorrelation Function] [omzet] [2007-12-03 11:20:48] [8eeeb1b102d3219870922ae6f80f1f57]
F   PD  [(Partial) Autocorrelation Function] [Various EDA topic...] [2008-11-12 10:44:14] [c29178f7f550574a75dc881e636e0923]
F RMPD      [Box-Cox Linearity Plot] [Various topics ab...] [2008-11-12 11:30:21] [3efbb18563b4564408d69b3c9a8e9a6e] [Current]
Feedback Forum
2008-11-15 09:00:44 [Tamara Witters] [reply
Juiste R-code maar geen uitleg.
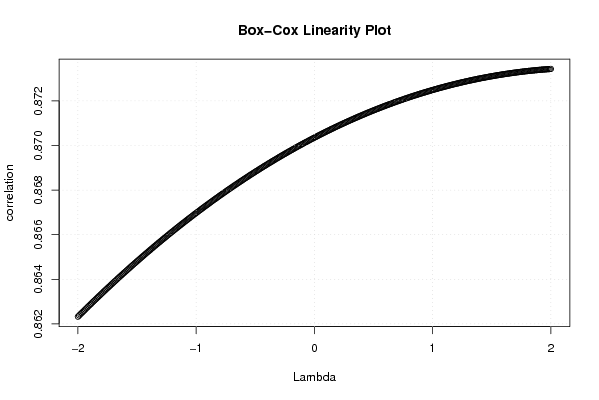
Met deze formule kan je een tijdreeks transformeren en op die manier problemen oplossen. VB: De scatterplot doet denken dat er een lineair verband bestaat, maar eigenlijk is er geen verband.
Met deze formule probeert de PC alle transformaties voor de verschillende lambda-waarden en op die manier ervoor te zorgen dat de correlatie het grootst wordt.
We moeten afleiden uit onze grafiek waar het maximum bereikt word, want daar is de correlatie het grootst.
In dit geval zouden we kunnen stellen dat de correlatie het grootst is bij lambda 2 nl: 0.873437330078354. MAAR indien we de grenzen zouden vergroten kunnen we zien dat de grafiek nog even zou stijgen en dan pas zou dalen. En daar wordt pas het maximum bereikt. Bijgevolg kunnen we geen besluit maken want het maximum is niet bereikt.
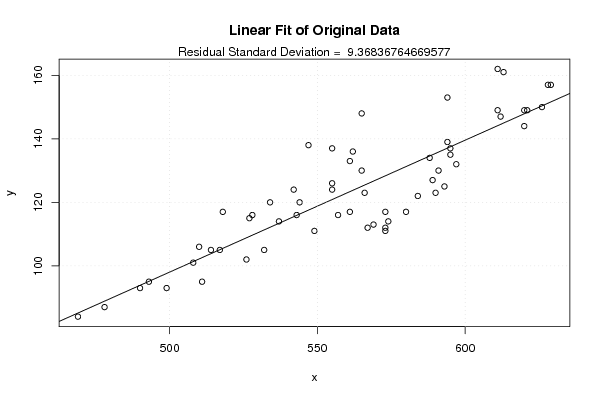
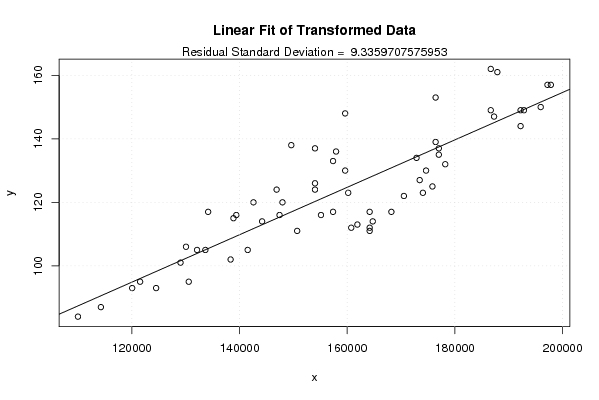
De twee volgende grafieken geven ook de correlatie weer. Indien de verschillende puntjes (observaties) gelijk zouden vallen op de rechte dan kunnen we spreken van een grote correlatie.
2008-11-16 17:02:09 [Kevin Truyts] [reply
Deze berekening wordt uitgevoerd om via een geschikte lamda het volgende probleem op te lossen. Som is het namelijk zo dat er het vermoeden is dat er geen lineair verband bestaat.
Hier gaan we via transformatie het verband wel lineair maken.
2008-11-24 14:36:09 [Bernard Femont] [reply
Met deze formule probeert de PC alle transformaties voor de verschillende lambda-waarden en op die manier ervoor te zorgen dat de correlatie het grootst wordt. We moeten afleiden uit onze grafiek waar het maximum bereikt word, want daar is de correlatie het grootst. In dit geval zouden we kunnen stellen dat de correlatie het grootst is bij lambda 2 nl: 0.873437330078354. Bijgevolg kunnen we geen besluit maken want het maximum is niet bereikt.Hier gaan we via transformatie het verband wel lineair maken.De twee volgende grafieken geven ook de correlatie weer. Indien de verschillende puntjes (observaties) gelijk zouden vallen op de rechte dan kunnen we spreken van een grote correlatie.

Post a new message
Dataseries X:
565
547
555
562
561
555
544
537
543
594
611
613
611
594
595
591
589
584
573
567
569
621
629
628
612
595
597
593
590
580
574
573
573
620
626
620
588
566
557
561
549
532
526
511
499
555
565
542
527
510
514
517
508
493
490
469
478
528
534
518
Dataseries Y:
148
138
137
136
133
126
120
114
116
153
162
161
149
139
135
130
127
122
117
112
113
149
157
157
147
137
132
125
123
117
114
111
112
144
150
149
134
123
116
117
111
105
102
95
93
124
130
124
115
106
105
105
101
95
93
84
87
116
120
117


Summary of computational transaction
Raw Inputview raw input (R code)
Raw Outputview raw output of R engine
Computing time2 seconds
R Server'Sir Ronald Aylmer Fisher' @ 193.190.124.24

\begin{tabular}{lllllllll}
\hline
Summary of computational transaction \tabularnewline
Raw Input & view raw input (R code)  \tabularnewline
Raw Output & view raw output of R engine  \tabularnewline
Computing time & 2 seconds \tabularnewline
R Server & 'Sir Ronald Aylmer Fisher' @ 193.190.124.24 \tabularnewline
\hline
\end{tabular}
%Source: https://freestatistics.org/blog/index.php?pk=24134&T=0

[TABLE]
[ROW][C]Summary of computational transaction[/C][/ROW]
[ROW][C]Raw Input[/C][C]view raw input (R code) [/C][/ROW]
[ROW][C]Raw Output[/C][C]view raw output of R engine [/C][/ROW]
[ROW][C]Computing time[/C][C]2 seconds[/C][/ROW]
[ROW][C]R Server[/C][C]'Sir Ronald Aylmer Fisher' @ 193.190.124.24[/C][/ROW]
[/TABLE]
Source: https://freestatistics.org/blog/index.php?pk=24134&T=0

Globally Unique Identifier (entire table): ba.freestatistics.org/blog/index.php?pk=24134&T=0

As an alternative you can also use a QR Code:  

The GUIDs for individual cells are displayed in the table below:

Summary of computational transaction
Raw Inputview raw input (R code)
Raw Outputview raw output of R engine
Computing time2 seconds
R Server'Sir Ronald Aylmer Fisher' @ 193.190.124.24


Box-Cox Linearity Plot
# observations x60
maximum correlation0.873437330078354
optimal lambda(x)2
Residual SD (orginial)9.36836764669577
Residual SD (transformed)9.3359707575953

\begin{tabular}{lllllllll}
\hline
Box-Cox Linearity Plot \tabularnewline
# observations x & 60 \tabularnewline
maximum correlation & 0.873437330078354 \tabularnewline
optimal lambda(x) & 2 \tabularnewline
Residual SD (orginial) & 9.36836764669577 \tabularnewline
Residual SD (transformed) & 9.3359707575953 \tabularnewline
\hline
\end{tabular}
%Source: https://freestatistics.org/blog/index.php?pk=24134&T=1

[TABLE]
[ROW][C]Box-Cox Linearity Plot[/C][/ROW]
[ROW][C]# observations x[/C][C]60[/C][/ROW]
[ROW][C]maximum correlation[/C][C]0.873437330078354[/C][/ROW]
[ROW][C]optimal lambda(x)[/C][C]2[/C][/ROW]
[ROW][C]Residual SD (orginial)[/C][C]9.36836764669577[/C][/ROW]
[ROW][C]Residual SD (transformed)[/C][C]9.3359707575953[/C][/ROW]
[/TABLE]
Source: https://freestatistics.org/blog/index.php?pk=24134&T=1

Globally Unique Identifier (entire table): ba.freestatistics.org/blog/index.php?pk=24134&T=1

As an alternative you can also use a QR Code:  

The GUIDs for individual cells are displayed in the table below:

Box-Cox Linearity Plot
# observations x60
maximum correlation0.873437330078354
optimal lambda(x)2
Residual SD (orginial)9.36836764669577
Residual SD (transformed)9.3359707575953


Parameters (Session):
Parameters (R input):
R code (references can be found in the software module):
n <- length(x)
c <- array(NA,dim=c(401))
l <- array(NA,dim=c(401))
mx <- 0
mxli <- -999
for (i in 1:401)
{
l[i] <- (i-201)/100
if (l[i] != 0)
{
x1 <- (x^l[i] - 1) / l[i]
} else {
x1 <- log(x)
}
c[i] <- cor(x1,y)
if (mx < abs(c[i]))
{
mx <- abs(c[i])
mxli <- l[i]
}
}
c
mx
mxli
if (mxli != 0)
{
x1 <- (x^mxli - 1) / mxli
} else {
x1 <- log(x)
}
r<-lm(y~x)
se <- sqrt(var(r$residuals))
r1 <- lm(y~x1)
se1 <- sqrt(var(r1$residuals))
bitmap(file='test1.png')
plot(l,c,main='Box-Cox Linearity Plot',xlab='Lambda',ylab='correlation')
grid()
dev.off()
bitmap(file='test2.png')
plot(x,y,main='Linear Fit of Original Data',xlab='x',ylab='y')
abline(r)
grid()
mtext(paste('Residual Standard Deviation = ',se))
dev.off()
bitmap(file='test3.png')
plot(x1,y,main='Linear Fit of Transformed Data',xlab='x',ylab='y')
abline(r1)
grid()
mtext(paste('Residual Standard Deviation = ',se1))
dev.off()
load(file='createtable')
a<-table.start()
a<-table.row.start(a)
a<-table.element(a,'Box-Cox Linearity Plot',2,TRUE)
a<-table.row.end(a)
a<-table.row.start(a)
a<-table.element(a,'# observations x',header=TRUE)
a<-table.element(a,n)
a<-table.row.end(a)
a<-table.row.start(a)
a<-table.element(a,'maximum correlation',header=TRUE)
a<-table.element(a,mx)
a<-table.row.end(a)
a<-table.row.start(a)
a<-table.element(a,'optimal lambda(x)',header=TRUE)
a<-table.element(a,mxli)
a<-table.row.end(a)
a<-table.row.start(a)
a<-table.element(a,'Residual SD (orginial)',header=TRUE)
a<-table.element(a,se)
a<-table.row.end(a)
a<-table.row.start(a)
a<-table.element(a,'Residual SD (transformed)',header=TRUE)
a<-table.element(a,se1)
a<-table.row.end(a)
a<-table.end(a)
table.save(a,file='mytable.tab')