Free Statistics

of Irreproducible Research!

Author's title

Author*Unverified author*
R Software Modulerwasp_histogram.wasp
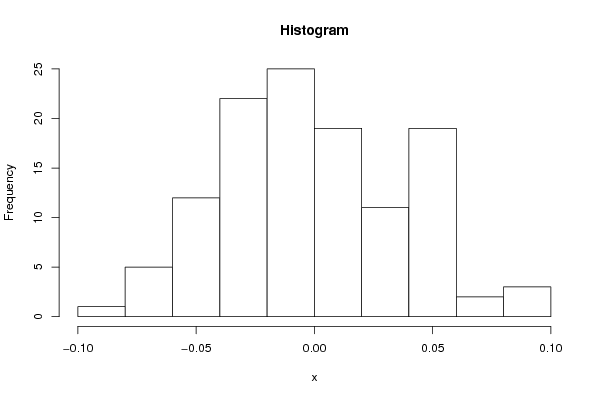
Title produced by softwareHistogram
Date of computationWed, 26 Sep 2018 05:48:09 +0200
Cite this page as followsStatistical Computations at FreeStatistics.org, Office for Research Development and Education, URL https://freestatistics.org/blog/index.php?v=date/2018/Sep/26/t1537933704wgievq0pdzltw63.htm/, Retrieved Wed, 15 May 2024 11:23:54 +0000
Statistical Computations at FreeStatistics.org, Office for Research Development and Education, URL https://freestatistics.org/blog/index.php?pk=315543, Retrieved Wed, 15 May 2024 11:23:54 +0000
QR Codes:

Original text written by user:
IsPrivate?No (this computation is public)
User-defined keywords
Estimated Impact137
Family? (F = Feedback message, R = changed R code, M = changed R Module, P = changed Parameters, D = changed Data)
-     [Skewness and Kurtosis] [] [2010-11-30 14:37:56] [8441f95c4a5787a301bc621ebc7904ca]
-    D  [Skewness and Kurtosis] [] [2010-11-30 22:38:03] [7e261c986c934df955dd3ac53e9d45c6]
- RMPD      [Histogram] [] [2018-09-26 03:48:09] [d41d8cd98f00b204e9800998ecf8427e] [Current]
Feedback Forum

Post a new message
Dataseries X:
-0.054611601
0.057831786
0.005957405
-0.020512983
0.011928644
-0.016582058
0.016949588
-0.066903067
0.093448102
-0.02450691
0.00437009
-0.041052328
0.022919681
-0.00640448
0.012629533
-0.015689095
-0.0529577
0.044567321
0.044151025
-0.015844613
-0.038433529
0.043955462
-0.028094757
0.0055446
-0.028251183
0.039363124
-0.010609882
-0.030469037
0.024972923
0.007892936
-0.03835567
0.044309919
0.005951763
0.023460247
-0.07435845
0.05067777
-0.033444522
0.025361622
-0.030741735
-0.009556061
0.026576008
0.072401665
-0.040371452
-0.026926272
0.008079016
0.046599599
-0.030432137
-0.038594464
0.005642194
0.004825203
0.042323896
-0.038728412
-0.041243246
0.02934116
0.04398013
-0.004451578
0.009653336
-0.047588331
0.041284138
-0.034044666
0.047303616
-0.033348174
0.019198606
-0.003164871
-0.002710535
0.026831524
-0.005264983
-0.005698829
-0.0097941
-0.00905251
-0.084928623
0.082528992
-0.010006585
-0.041628495
0.046280099
-0.013272035
0.038919326
-0.021199822
0.013680891
0.033011201
-0.074335033
-0.004211971
0.009455049
0.012786257
-0.00030183
-0.0494863
0.054953227
-0.030381477
0.055354672
-0.001306851
-0.042078827
0.047463303
-0.062200347
0.040366791
0.016262259
-0.010776501
-0.066495283
0.044393554
-0.003344389
-0.000923747
0.043342532
-0.022876096
-0.02049196
0.005127403
0.045816441
-0.012010141
-0.057167181
-0.049413561
0.087493671
0.027243912
-0.008757887
-0.033422561
0.003642183
-0.030365832
-0.00636733
0.078207898
-0.037793201
-0.002711201
-0.055996341


Summary of computational transaction
Raw Input view raw input (R code)
Raw Outputview raw output of R engine
Computing time1 seconds
R ServerBig Analytics Cloud Computing Center

\begin{tabular}{lllllllll}
\hline
Summary of computational transaction \tabularnewline
Raw Input view raw input (R code)  \tabularnewline
Raw Outputview raw output of R engine  \tabularnewline
Computing time1 seconds \tabularnewline
R ServerBig Analytics Cloud Computing Center \tabularnewline
\hline
\end{tabular}
%Source: https://freestatistics.org/blog/index.php?pk=315543&T=0

[TABLE]
[ROW]
Summary of computational transaction[/C][/ROW] [ROW]Raw Input[/C] view raw input (R code) [/C][/ROW] [ROW]Raw Output[/C]view raw output of R engine [/C][/ROW] [ROW]Computing time[/C]1 seconds[/C][/ROW] [ROW]R Server[/C]Big Analytics Cloud Computing Center[/C][/ROW] [/TABLE] Source: https://freestatistics.org/blog/index.php?pk=315543&T=0

Globally Unique Identifier (entire table): ba.freestatistics.org/blog/index.php?pk=315543&T=0

As an alternative you can also use a QR Code:  

The GUIDs for individual cells are displayed in the table below:

Summary of computational transaction
Raw Input view raw input (R code)
Raw Outputview raw output of R engine
Computing time1 seconds
R ServerBig Analytics Cloud Computing Center


Frequency Table (Histogram)
BinsMidpointAbs. FrequencyRel. FrequencyCumul. Rel. Freq.Density
[-0.1,-0.08]-0.0910.0084030.0084030.420168
]-0.08,-0.06]-0.0750.0420170.050422.10084
]-0.06,-0.04]-0.05120.100840.1512615.042017
]-0.04,-0.02]-0.03220.1848740.3361349.243697
]-0.02,0]-0.01250.2100840.54621810.504202
]0,0.02]0.01190.1596640.7058827.983193
]0.02,0.04]0.03110.0924370.7983194.621849
]0.04,0.06]0.05190.1596640.9579837.983193
]0.06,0.08]0.0720.0168070.974790.840336
]0.08,0.1]0.0930.0252111.260504

\begin{tabular}{lllllllll}
\hline
Frequency Table (Histogram) \tabularnewline
Bins & Midpoint & Abs. Frequency & Rel. Frequency & Cumul. Rel. Freq. & Density \tabularnewline
[-0.1,-0.08] & -0.09 & 1 & 0.008403 & 0.008403 & 0.420168 \tabularnewline
]-0.08,-0.06] & -0.07 & 5 & 0.042017 & 0.05042 & 2.10084 \tabularnewline
]-0.06,-0.04] & -0.05 & 12 & 0.10084 & 0.151261 & 5.042017 \tabularnewline
]-0.04,-0.02] & -0.03 & 22 & 0.184874 & 0.336134 & 9.243697 \tabularnewline
]-0.02,0] & -0.01 & 25 & 0.210084 & 0.546218 & 10.504202 \tabularnewline
]0,0.02] & 0.01 & 19 & 0.159664 & 0.705882 & 7.983193 \tabularnewline
]0.02,0.04] & 0.03 & 11 & 0.092437 & 0.798319 & 4.621849 \tabularnewline
]0.04,0.06] & 0.05 & 19 & 0.159664 & 0.957983 & 7.983193 \tabularnewline
]0.06,0.08] & 0.07 & 2 & 0.016807 & 0.97479 & 0.840336 \tabularnewline
]0.08,0.1] & 0.09 & 3 & 0.02521 & 1 & 1.260504 \tabularnewline
\hline
\end{tabular}
%Source: https://freestatistics.org/blog/index.php?pk=315543&T=1

[TABLE]
[ROW][C]Frequency Table (Histogram)[/C][/ROW]
[ROW][C]Bins[/C][C]Midpoint[/C][C]Abs. Frequency[/C][C]Rel. Frequency[/C][C]Cumul. Rel. Freq.[/C][C]Density[/C][/ROW]
[ROW][C][-0.1,-0.08][/C][C]-0.09[/C][C]1[/C][C]0.008403[/C][C]0.008403[/C][C]0.420168[/C][/ROW]
[ROW][C]]-0.08,-0.06][/C][C]-0.07[/C][C]5[/C][C]0.042017[/C][C]0.05042[/C][C]2.10084[/C][/ROW]
[ROW][C]]-0.06,-0.04][/C][C]-0.05[/C][C]12[/C][C]0.10084[/C][C]0.151261[/C][C]5.042017[/C][/ROW]
[ROW][C]]-0.04,-0.02][/C][C]-0.03[/C][C]22[/C][C]0.184874[/C][C]0.336134[/C][C]9.243697[/C][/ROW]
[ROW][C]]-0.02,0][/C][C]-0.01[/C][C]25[/C][C]0.210084[/C][C]0.546218[/C][C]10.504202[/C][/ROW]
[ROW][C]]0,0.02][/C][C]0.01[/C][C]19[/C][C]0.159664[/C][C]0.705882[/C][C]7.983193[/C][/ROW]
[ROW][C]]0.02,0.04][/C][C]0.03[/C][C]11[/C][C]0.092437[/C][C]0.798319[/C][C]4.621849[/C][/ROW]
[ROW][C]]0.04,0.06][/C][C]0.05[/C][C]19[/C][C]0.159664[/C][C]0.957983[/C][C]7.983193[/C][/ROW]
[ROW][C]]0.06,0.08][/C][C]0.07[/C][C]2[/C][C]0.016807[/C][C]0.97479[/C][C]0.840336[/C][/ROW]
[ROW][C]]0.08,0.1][/C][C]0.09[/C][C]3[/C][C]0.02521[/C][C]1[/C][C]1.260504[/C][/ROW]
[/TABLE]
Source: https://freestatistics.org/blog/index.php?pk=315543&T=1

Globally Unique Identifier (entire table): ba.freestatistics.org/blog/index.php?pk=315543&T=1

As an alternative you can also use a QR Code:  

The GUIDs for individual cells are displayed in the table below:

Frequency Table (Histogram)
BinsMidpointAbs. FrequencyRel. FrequencyCumul. Rel. Freq.Density
[-0.1,-0.08]-0.0910.0084030.0084030.420168
]-0.08,-0.06]-0.0750.0420170.050422.10084
]-0.06,-0.04]-0.05120.100840.1512615.042017
]-0.04,-0.02]-0.03220.1848740.3361349.243697
]-0.02,0]-0.01250.2100840.54621810.504202
]0,0.02]0.01190.1596640.7058827.983193
]0.02,0.04]0.03110.0924370.7983194.621849
]0.04,0.06]0.05190.1596640.9579837.983193
]0.06,0.08]0.0720.0168070.974790.840336
]0.08,0.1]0.0930.0252111.260504


Parameters (Session):
par2 = white ; par3 = TRUE ; par4 = Unknown ;
Parameters (R input):
par1 = ; par2 = white ; par3 = TRUE ; par4 = Unknown ;
R code (references can be found in the software module):
par4 <- 'Unknown'
par3 <- 'TRUE'
par2 <- 'blue'
par1 <- ''
par1 <- as.numeric(par1)
if (par3 == 'TRUE') par3 <- TRUE
if (par3 == 'FALSE') par3 <- FALSE
if (par4 == 'Unknown') par1 <- as.numeric(par1)
if (par4 == 'Interval/Ratio') par1 <- as.numeric(par1)
if (par4 == '3-point Likert') par1 <- c(1:3 - 0.5, 3.5)
if (par4 == '4-point Likert') par1 <- c(1:4 - 0.5, 4.5)
if (par4 == '5-point Likert') par1 <- c(1:5 - 0.5, 5.5)
if (par4 == '6-point Likert') par1 <- c(1:6 - 0.5, 6.5)
if (par4 == '7-point Likert') par1 <- c(1:7 - 0.5, 7.5)
if (par4 == '8-point Likert') par1 <- c(1:8 - 0.5, 8.5)
if (par4 == '9-point Likert') par1 <- c(1:9 - 0.5, 9.5)
if (par4 == '10-point Likert') par1 <- c(1:10 - 0.5, 10.5)
bitmap(file='test1.png')
if(is.numeric(x[1])) {
if (is.na(par1)) {
myhist<-hist(x,col=par2,main=main,xlab=xlab,right=par3)
} else {
if (par1 < 0) par1 <- 3
if (par1 > 50) par1 <- 50
myhist<-hist(x,breaks=par1,col=par2,main=main,xlab=xlab,right=par3)
}
} else {
barplot(mytab <- sort(table(x),T),col=par2,main='Frequency Plot',xlab=xlab,ylab='Absolute Frequency')
}
dev.off()
if(is.numeric(x[1])) {
myhist
n <- length(x)
load(file='createtable')
a<-table.start()
a<-table.row.start(a)
a<-table.element(a,'Frequency Table (Histogram)',6,TRUE)
a<-table.row.end(a)
a<-table.row.start(a)
a<-table.element(a,'Bins',header=TRUE)
a<-table.element(a,'Midpoint',header=TRUE)
a<-table.element(a,'Abs. Frequency',header=TRUE)
a<-table.element(a,'Rel. Frequency',header=TRUE)
a<-table.element(a,'Cumul. Rel. Freq.',header=TRUE)
a<-table.element(a,'Density',header=TRUE)
a<-table.row.end(a)
crf <- 0
if (par3 == FALSE) mybracket <- '[' else mybracket <- ']'
mynumrows <- (length(myhist$breaks)-1)
for (i in 1:mynumrows) {
a<-table.row.start(a)
if (i == 1)
dum <- paste('[',myhist$breaks[i],sep='')
else
dum <- paste(mybracket,myhist$breaks[i],sep='')
dum <- paste(dum,myhist$breaks[i+1],sep=',')
if (i==mynumrows)
dum <- paste(dum,']',sep='')
else
dum <- paste(dum,mybracket,sep='')
a<-table.element(a,dum,header=TRUE)
a<-table.element(a,myhist$mids[i])
a<-table.element(a,myhist$counts[i])
rf <- myhist$counts[i]/n
crf <- crf + rf
a<-table.element(a,round(rf,6))
a<-table.element(a,round(crf,6))
a<-table.element(a,round(myhist$density[i],6))
a<-table.row.end(a)
}
a<-table.end(a)
table.save(a,file='mytable.tab')
} else {
mytab
reltab <- mytab / sum(mytab)
n <- length(mytab)
load(file='createtable')
a<-table.start()
a<-table.row.start(a)
a<-table.element(a,'Frequency Table (Categorical Data)',3,TRUE)
a<-table.row.end(a)
a<-table.row.start(a)
a<-table.element(a,'Category',header=TRUE)
a<-table.element(a,'Abs. Frequency',header=TRUE)
a<-table.element(a,'Rel. Frequency',header=TRUE)
a<-table.row.end(a)
for (i in 1:n) {
a<-table.row.start(a)
a<-table.element(a,labels(mytab)$x[i],header=TRUE)
a<-table.element(a,mytab[i])
a<-table.element(a,round(reltab[i],4))
a<-table.row.end(a)
}
a<-table.end(a)
table.save(a,file='mytable1.tab')
}