Free Statistics

of Irreproducible Research!

Author's title

Author*The author of this computation has been verified*
R Software Modulerwasp_autocorrelation.wasp
Title produced by software(Partial) Autocorrelation Function
Date of computationMon, 23 Jan 2017 09:24:29 +0100
Cite this page as followsStatistical Computations at FreeStatistics.org, Office for Research Development and Education, URL https://freestatistics.org/blog/index.php?v=date/2017/Jan/23/t14851599523u0uqyiwqly515v.htm/, Retrieved Fri, 01 Nov 2024 00:12:29 +0000
Statistical Computations at FreeStatistics.org, Office for Research Development and Education, URL https://freestatistics.org/blog/index.php?pk=303801, Retrieved Fri, 01 Nov 2024 00:12:29 +0000
QR Codes:

Original text written by user:
IsPrivate?No (this computation is public)
User-defined keywords
Estimated Impact81
Family? (F = Feedback message, R = changed R code, M = changed R Module, P = changed Parameters, D = changed Data)
-       [(Partial) Autocorrelation Function] [examen tijdreeks] [2017-01-23 08:24:29] [da1cd5b79b9c78a074da6b069a6d8376] [Current]
Feedback Forum

Post a new message
Dataseries X:
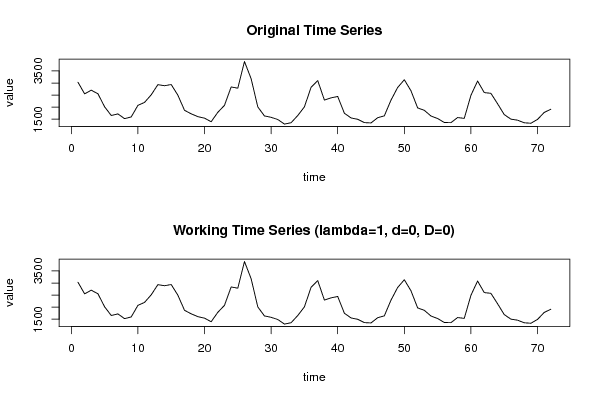
3035
2552
2704
2554
2014
1655
1721
1524
1596
2074
2199
2512
2933
2889
2938
2497
1870
1726
1607
1545
1396
1787
2076
2837
2787
3891
3179
2011
1636
1580
1489
1300
1356
1653
2013
2823
3102
2294
2385
2444
1748
1554
1498
1361
1346
1564
1640
2293
2815
3137
2679
1969
1870
1633
1529
1366
1357
1570
1535
2491
3084
2605
2573
2143
1693
1504
1461
1354
1333
1492
1781
1915


Summary of computational transaction
Raw Input view raw input (R code)
Raw Outputview raw output of R engine
Computing time1 seconds
R ServerBig Analytics Cloud Computing Center

\begin{tabular}{lllllllll}
\hline
Summary of computational transaction \tabularnewline
Raw Input view raw input (R code)  \tabularnewline
Raw Outputview raw output of R engine  \tabularnewline
Computing time1 seconds \tabularnewline
R ServerBig Analytics Cloud Computing Center \tabularnewline
\hline
\end{tabular}
%Source: https://freestatistics.org/blog/index.php?pk=303801&T=0

[TABLE]
[ROW]
Summary of computational transaction[/C][/ROW] [ROW]Raw Input[/C] view raw input (R code) [/C][/ROW] [ROW]Raw Output[/C]view raw output of R engine [/C][/ROW] [ROW]Computing time[/C]1 seconds[/C][/ROW] [ROW]R Server[/C]Big Analytics Cloud Computing Center[/C][/ROW] [/TABLE] Source: https://freestatistics.org/blog/index.php?pk=303801&T=0

Globally Unique Identifier (entire table): ba.freestatistics.org/blog/index.php?pk=303801&T=0

As an alternative you can also use a QR Code:  

The GUIDs for individual cells are displayed in the table below:

Summary of computational transaction
Raw Input view raw input (R code)
Raw Outputview raw output of R engine
Computing time1 seconds
R ServerBig Analytics Cloud Computing Center


Autocorrelation Function
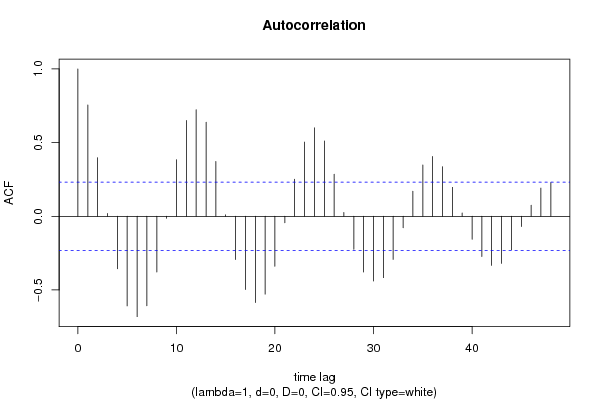
Time lag kACF(k)T-STATP-value
10.7550516.40680
20.3969573.36830.000609
30.0193960.16460.434869
4-0.355898-3.01990.001749
5-0.608566-5.16391e-06
6-0.681383-5.78170
7-0.60791-5.15831e-06
8-0.378212-3.20920.000994
9-0.012976-0.11010.456317
100.3832533.2520.000873
110.6502075.51720
120.7231676.13630
130.6380015.41360
140.3715783.15290.001179
150.0094670.08030.468097
16-0.2937-2.49210.0075
17-0.496742-4.2153.6e-05
18-0.585559-4.96862e-06
19-0.528759-4.48671.3e-05
20-0.338822-2.8750.002655
21-0.044431-0.3770.353639
220.2508152.12820.018371
230.5034424.27182.9e-05
240.600145.09241e-06
250.5108954.33512.3e-05
260.2854982.42250.008965
270.0259790.22040.413077
28-0.224152-1.9020.030586
29-0.378079-3.20810.000998
30-0.439585-3.730.000189
31-0.416656-3.53540.000358
32-0.292533-2.48220.007695
33-0.078606-0.6670.253454
340.1693591.43710.077516
350.3477622.95090.002137
360.4053543.43950.000486
370.336492.85520.002807
380.1960521.66360.050275
390.0225720.19150.424324
40-0.155562-1.320.09551
41-0.273521-2.32090.011564
42-0.333169-2.8270.003039
43-0.31983-2.71380.004158
44-0.227402-1.92960.0288
45-0.069573-0.59030.278404
460.0751530.63770.262849
470.191271.6230.054482
480.2287051.94060.02811

\begin{tabular}{lllllllll}
\hline
Autocorrelation Function \tabularnewline
Time lag k & ACF(k) & T-STAT & P-value \tabularnewline
1 & 0.755051 & 6.4068 & 0 \tabularnewline
2 & 0.396957 & 3.3683 & 0.000609 \tabularnewline
3 & 0.019396 & 0.1646 & 0.434869 \tabularnewline
4 & -0.355898 & -3.0199 & 0.001749 \tabularnewline
5 & -0.608566 & -5.1639 & 1e-06 \tabularnewline
6 & -0.681383 & -5.7817 & 0 \tabularnewline
7 & -0.60791 & -5.1583 & 1e-06 \tabularnewline
8 & -0.378212 & -3.2092 & 0.000994 \tabularnewline
9 & -0.012976 & -0.1101 & 0.456317 \tabularnewline
10 & 0.383253 & 3.252 & 0.000873 \tabularnewline
11 & 0.650207 & 5.5172 & 0 \tabularnewline
12 & 0.723167 & 6.1363 & 0 \tabularnewline
13 & 0.638001 & 5.4136 & 0 \tabularnewline
14 & 0.371578 & 3.1529 & 0.001179 \tabularnewline
15 & 0.009467 & 0.0803 & 0.468097 \tabularnewline
16 & -0.2937 & -2.4921 & 0.0075 \tabularnewline
17 & -0.496742 & -4.215 & 3.6e-05 \tabularnewline
18 & -0.585559 & -4.9686 & 2e-06 \tabularnewline
19 & -0.528759 & -4.4867 & 1.3e-05 \tabularnewline
20 & -0.338822 & -2.875 & 0.002655 \tabularnewline
21 & -0.044431 & -0.377 & 0.353639 \tabularnewline
22 & 0.250815 & 2.1282 & 0.018371 \tabularnewline
23 & 0.503442 & 4.2718 & 2.9e-05 \tabularnewline
24 & 0.60014 & 5.0924 & 1e-06 \tabularnewline
25 & 0.510895 & 4.3351 & 2.3e-05 \tabularnewline
26 & 0.285498 & 2.4225 & 0.008965 \tabularnewline
27 & 0.025979 & 0.2204 & 0.413077 \tabularnewline
28 & -0.224152 & -1.902 & 0.030586 \tabularnewline
29 & -0.378079 & -3.2081 & 0.000998 \tabularnewline
30 & -0.439585 & -3.73 & 0.000189 \tabularnewline
31 & -0.416656 & -3.5354 & 0.000358 \tabularnewline
32 & -0.292533 & -2.4822 & 0.007695 \tabularnewline
33 & -0.078606 & -0.667 & 0.253454 \tabularnewline
34 & 0.169359 & 1.4371 & 0.077516 \tabularnewline
35 & 0.347762 & 2.9509 & 0.002137 \tabularnewline
36 & 0.405354 & 3.4395 & 0.000486 \tabularnewline
37 & 0.33649 & 2.8552 & 0.002807 \tabularnewline
38 & 0.196052 & 1.6636 & 0.050275 \tabularnewline
39 & 0.022572 & 0.1915 & 0.424324 \tabularnewline
40 & -0.155562 & -1.32 & 0.09551 \tabularnewline
41 & -0.273521 & -2.3209 & 0.011564 \tabularnewline
42 & -0.333169 & -2.827 & 0.003039 \tabularnewline
43 & -0.31983 & -2.7138 & 0.004158 \tabularnewline
44 & -0.227402 & -1.9296 & 0.0288 \tabularnewline
45 & -0.069573 & -0.5903 & 0.278404 \tabularnewline
46 & 0.075153 & 0.6377 & 0.262849 \tabularnewline
47 & 0.19127 & 1.623 & 0.054482 \tabularnewline
48 & 0.228705 & 1.9406 & 0.02811 \tabularnewline
\hline
\end{tabular}
%Source: https://freestatistics.org/blog/index.php?pk=303801&T=1

[TABLE]
[ROW][C]Autocorrelation Function[/C][/ROW]
[ROW][C]Time lag k[/C][C]ACF(k)[/C][C]T-STAT[/C][C]P-value[/C][/ROW]
[ROW][C]1[/C][C]0.755051[/C][C]6.4068[/C][C]0[/C][/ROW]
[ROW][C]2[/C][C]0.396957[/C][C]3.3683[/C][C]0.000609[/C][/ROW]
[ROW][C]3[/C][C]0.019396[/C][C]0.1646[/C][C]0.434869[/C][/ROW]
[ROW][C]4[/C][C]-0.355898[/C][C]-3.0199[/C][C]0.001749[/C][/ROW]
[ROW][C]5[/C][C]-0.608566[/C][C]-5.1639[/C][C]1e-06[/C][/ROW]
[ROW][C]6[/C][C]-0.681383[/C][C]-5.7817[/C][C]0[/C][/ROW]
[ROW][C]7[/C][C]-0.60791[/C][C]-5.1583[/C][C]1e-06[/C][/ROW]
[ROW][C]8[/C][C]-0.378212[/C][C]-3.2092[/C][C]0.000994[/C][/ROW]
[ROW][C]9[/C][C]-0.012976[/C][C]-0.1101[/C][C]0.456317[/C][/ROW]
[ROW][C]10[/C][C]0.383253[/C][C]3.252[/C][C]0.000873[/C][/ROW]
[ROW][C]11[/C][C]0.650207[/C][C]5.5172[/C][C]0[/C][/ROW]
[ROW][C]12[/C][C]0.723167[/C][C]6.1363[/C][C]0[/C][/ROW]
[ROW][C]13[/C][C]0.638001[/C][C]5.4136[/C][C]0[/C][/ROW]
[ROW][C]14[/C][C]0.371578[/C][C]3.1529[/C][C]0.001179[/C][/ROW]
[ROW][C]15[/C][C]0.009467[/C][C]0.0803[/C][C]0.468097[/C][/ROW]
[ROW][C]16[/C][C]-0.2937[/C][C]-2.4921[/C][C]0.0075[/C][/ROW]
[ROW][C]17[/C][C]-0.496742[/C][C]-4.215[/C][C]3.6e-05[/C][/ROW]
[ROW][C]18[/C][C]-0.585559[/C][C]-4.9686[/C][C]2e-06[/C][/ROW]
[ROW][C]19[/C][C]-0.528759[/C][C]-4.4867[/C][C]1.3e-05[/C][/ROW]
[ROW][C]20[/C][C]-0.338822[/C][C]-2.875[/C][C]0.002655[/C][/ROW]
[ROW][C]21[/C][C]-0.044431[/C][C]-0.377[/C][C]0.353639[/C][/ROW]
[ROW][C]22[/C][C]0.250815[/C][C]2.1282[/C][C]0.018371[/C][/ROW]
[ROW][C]23[/C][C]0.503442[/C][C]4.2718[/C][C]2.9e-05[/C][/ROW]
[ROW][C]24[/C][C]0.60014[/C][C]5.0924[/C][C]1e-06[/C][/ROW]
[ROW][C]25[/C][C]0.510895[/C][C]4.3351[/C][C]2.3e-05[/C][/ROW]
[ROW][C]26[/C][C]0.285498[/C][C]2.4225[/C][C]0.008965[/C][/ROW]
[ROW][C]27[/C][C]0.025979[/C][C]0.2204[/C][C]0.413077[/C][/ROW]
[ROW][C]28[/C][C]-0.224152[/C][C]-1.902[/C][C]0.030586[/C][/ROW]
[ROW][C]29[/C][C]-0.378079[/C][C]-3.2081[/C][C]0.000998[/C][/ROW]
[ROW][C]30[/C][C]-0.439585[/C][C]-3.73[/C][C]0.000189[/C][/ROW]
[ROW][C]31[/C][C]-0.416656[/C][C]-3.5354[/C][C]0.000358[/C][/ROW]
[ROW][C]32[/C][C]-0.292533[/C][C]-2.4822[/C][C]0.007695[/C][/ROW]
[ROW][C]33[/C][C]-0.078606[/C][C]-0.667[/C][C]0.253454[/C][/ROW]
[ROW][C]34[/C][C]0.169359[/C][C]1.4371[/C][C]0.077516[/C][/ROW]
[ROW][C]35[/C][C]0.347762[/C][C]2.9509[/C][C]0.002137[/C][/ROW]
[ROW][C]36[/C][C]0.405354[/C][C]3.4395[/C][C]0.000486[/C][/ROW]
[ROW][C]37[/C][C]0.33649[/C][C]2.8552[/C][C]0.002807[/C][/ROW]
[ROW][C]38[/C][C]0.196052[/C][C]1.6636[/C][C]0.050275[/C][/ROW]
[ROW][C]39[/C][C]0.022572[/C][C]0.1915[/C][C]0.424324[/C][/ROW]
[ROW][C]40[/C][C]-0.155562[/C][C]-1.32[/C][C]0.09551[/C][/ROW]
[ROW][C]41[/C][C]-0.273521[/C][C]-2.3209[/C][C]0.011564[/C][/ROW]
[ROW][C]42[/C][C]-0.333169[/C][C]-2.827[/C][C]0.003039[/C][/ROW]
[ROW][C]43[/C][C]-0.31983[/C][C]-2.7138[/C][C]0.004158[/C][/ROW]
[ROW][C]44[/C][C]-0.227402[/C][C]-1.9296[/C][C]0.0288[/C][/ROW]
[ROW][C]45[/C][C]-0.069573[/C][C]-0.5903[/C][C]0.278404[/C][/ROW]
[ROW][C]46[/C][C]0.075153[/C][C]0.6377[/C][C]0.262849[/C][/ROW]
[ROW][C]47[/C][C]0.19127[/C][C]1.623[/C][C]0.054482[/C][/ROW]
[ROW][C]48[/C][C]0.228705[/C][C]1.9406[/C][C]0.02811[/C][/ROW]
[/TABLE]
Source: https://freestatistics.org/blog/index.php?pk=303801&T=1

Globally Unique Identifier (entire table): ba.freestatistics.org/blog/index.php?pk=303801&T=1

As an alternative you can also use a QR Code:  

The GUIDs for individual cells are displayed in the table below:

Autocorrelation Function
Time lag kACF(k)T-STATP-value
10.7550516.40680
20.3969573.36830.000609
30.0193960.16460.434869
4-0.355898-3.01990.001749
5-0.608566-5.16391e-06
6-0.681383-5.78170
7-0.60791-5.15831e-06
8-0.378212-3.20920.000994
9-0.012976-0.11010.456317
100.3832533.2520.000873
110.6502075.51720
120.7231676.13630
130.6380015.41360
140.3715783.15290.001179
150.0094670.08030.468097
16-0.2937-2.49210.0075
17-0.496742-4.2153.6e-05
18-0.585559-4.96862e-06
19-0.528759-4.48671.3e-05
20-0.338822-2.8750.002655
21-0.044431-0.3770.353639
220.2508152.12820.018371
230.5034424.27182.9e-05
240.600145.09241e-06
250.5108954.33512.3e-05
260.2854982.42250.008965
270.0259790.22040.413077
28-0.224152-1.9020.030586
29-0.378079-3.20810.000998
30-0.439585-3.730.000189
31-0.416656-3.53540.000358
32-0.292533-2.48220.007695
33-0.078606-0.6670.253454
340.1693591.43710.077516
350.3477622.95090.002137
360.4053543.43950.000486
370.336492.85520.002807
380.1960521.66360.050275
390.0225720.19150.424324
40-0.155562-1.320.09551
41-0.273521-2.32090.011564
42-0.333169-2.8270.003039
43-0.31983-2.71380.004158
44-0.227402-1.92960.0288
45-0.069573-0.59030.278404
460.0751530.63770.262849
470.191271.6230.054482
480.2287051.94060.02811


Partial Autocorrelation Function
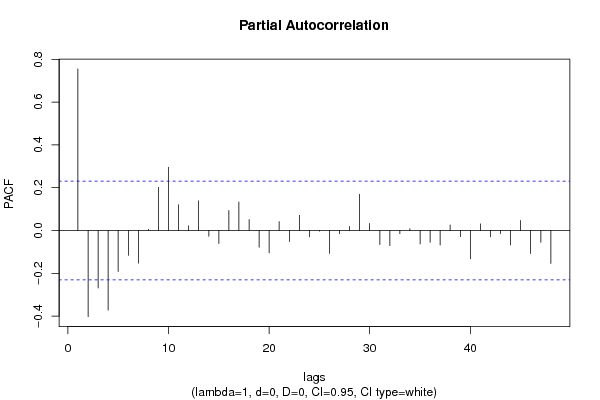
Time lag kPACF(k)T-STATP-value
10.7550516.40680
2-0.402759-3.41750.000521
3-0.269154-2.28390.012666
4-0.372371-3.15970.001155
5-0.192068-1.62980.053761
6-0.11561-0.9810.164943
7-0.152737-1.2960.099555
80.0052160.04430.48241
90.201641.7110.045696
100.2953032.50570.007241
110.1206931.02410.154605
120.0216040.18330.427534
130.1384061.17440.12205
14-0.026658-0.22620.410844
15-0.061025-0.51780.303087
160.0935980.79420.214843
170.1335081.13290.130517
180.0507140.43030.334124
19-0.078511-0.66620.253709
20-0.104156-0.88380.189875
210.0415780.35280.362634
22-0.051609-0.43790.331378
230.0706340.59930.275411
24-0.029041-0.24640.40303
25-0.003108-0.02640.489517
26-0.107069-0.90850.183321
27-0.015317-0.130.448476
280.0190520.16170.436013
290.1696561.43960.077161
300.0326670.27720.391216
31-0.06544-0.55530.290215
32-0.070838-0.60110.274836
33-0.014591-0.12380.450907
340.0078160.06630.473654
35-0.062578-0.5310.29853
36-0.055448-0.47050.319713
37-0.067953-0.57660.283003
380.0258420.21930.413527
39-0.028796-0.24430.40383
40-0.132518-1.12440.132279
410.0308020.26140.397278
42-0.029011-0.24620.403126
43-0.01406-0.11930.452685
44-0.067528-0.5730.284217
450.0470960.39960.345309
46-0.107634-0.91330.182066
47-0.054834-0.46530.321568
48-0.153701-1.30420.098161

\begin{tabular}{lllllllll}
\hline
Partial Autocorrelation Function \tabularnewline
Time lag k & PACF(k) & T-STAT & P-value \tabularnewline
1 & 0.755051 & 6.4068 & 0 \tabularnewline
2 & -0.402759 & -3.4175 & 0.000521 \tabularnewline
3 & -0.269154 & -2.2839 & 0.012666 \tabularnewline
4 & -0.372371 & -3.1597 & 0.001155 \tabularnewline
5 & -0.192068 & -1.6298 & 0.053761 \tabularnewline
6 & -0.11561 & -0.981 & 0.164943 \tabularnewline
7 & -0.152737 & -1.296 & 0.099555 \tabularnewline
8 & 0.005216 & 0.0443 & 0.48241 \tabularnewline
9 & 0.20164 & 1.711 & 0.045696 \tabularnewline
10 & 0.295303 & 2.5057 & 0.007241 \tabularnewline
11 & 0.120693 & 1.0241 & 0.154605 \tabularnewline
12 & 0.021604 & 0.1833 & 0.427534 \tabularnewline
13 & 0.138406 & 1.1744 & 0.12205 \tabularnewline
14 & -0.026658 & -0.2262 & 0.410844 \tabularnewline
15 & -0.061025 & -0.5178 & 0.303087 \tabularnewline
16 & 0.093598 & 0.7942 & 0.214843 \tabularnewline
17 & 0.133508 & 1.1329 & 0.130517 \tabularnewline
18 & 0.050714 & 0.4303 & 0.334124 \tabularnewline
19 & -0.078511 & -0.6662 & 0.253709 \tabularnewline
20 & -0.104156 & -0.8838 & 0.189875 \tabularnewline
21 & 0.041578 & 0.3528 & 0.362634 \tabularnewline
22 & -0.051609 & -0.4379 & 0.331378 \tabularnewline
23 & 0.070634 & 0.5993 & 0.275411 \tabularnewline
24 & -0.029041 & -0.2464 & 0.40303 \tabularnewline
25 & -0.003108 & -0.0264 & 0.489517 \tabularnewline
26 & -0.107069 & -0.9085 & 0.183321 \tabularnewline
27 & -0.015317 & -0.13 & 0.448476 \tabularnewline
28 & 0.019052 & 0.1617 & 0.436013 \tabularnewline
29 & 0.169656 & 1.4396 & 0.077161 \tabularnewline
30 & 0.032667 & 0.2772 & 0.391216 \tabularnewline
31 & -0.06544 & -0.5553 & 0.290215 \tabularnewline
32 & -0.070838 & -0.6011 & 0.274836 \tabularnewline
33 & -0.014591 & -0.1238 & 0.450907 \tabularnewline
34 & 0.007816 & 0.0663 & 0.473654 \tabularnewline
35 & -0.062578 & -0.531 & 0.29853 \tabularnewline
36 & -0.055448 & -0.4705 & 0.319713 \tabularnewline
37 & -0.067953 & -0.5766 & 0.283003 \tabularnewline
38 & 0.025842 & 0.2193 & 0.413527 \tabularnewline
39 & -0.028796 & -0.2443 & 0.40383 \tabularnewline
40 & -0.132518 & -1.1244 & 0.132279 \tabularnewline
41 & 0.030802 & 0.2614 & 0.397278 \tabularnewline
42 & -0.029011 & -0.2462 & 0.403126 \tabularnewline
43 & -0.01406 & -0.1193 & 0.452685 \tabularnewline
44 & -0.067528 & -0.573 & 0.284217 \tabularnewline
45 & 0.047096 & 0.3996 & 0.345309 \tabularnewline
46 & -0.107634 & -0.9133 & 0.182066 \tabularnewline
47 & -0.054834 & -0.4653 & 0.321568 \tabularnewline
48 & -0.153701 & -1.3042 & 0.098161 \tabularnewline
\hline
\end{tabular}
%Source: https://freestatistics.org/blog/index.php?pk=303801&T=2

[TABLE]
[ROW][C]Partial Autocorrelation Function[/C][/ROW]
[ROW][C]Time lag k[/C][C]PACF(k)[/C][C]T-STAT[/C][C]P-value[/C][/ROW]
[ROW][C]1[/C][C]0.755051[/C][C]6.4068[/C][C]0[/C][/ROW]
[ROW][C]2[/C][C]-0.402759[/C][C]-3.4175[/C][C]0.000521[/C][/ROW]
[ROW][C]3[/C][C]-0.269154[/C][C]-2.2839[/C][C]0.012666[/C][/ROW]
[ROW][C]4[/C][C]-0.372371[/C][C]-3.1597[/C][C]0.001155[/C][/ROW]
[ROW][C]5[/C][C]-0.192068[/C][C]-1.6298[/C][C]0.053761[/C][/ROW]
[ROW][C]6[/C][C]-0.11561[/C][C]-0.981[/C][C]0.164943[/C][/ROW]
[ROW][C]7[/C][C]-0.152737[/C][C]-1.296[/C][C]0.099555[/C][/ROW]
[ROW][C]8[/C][C]0.005216[/C][C]0.0443[/C][C]0.48241[/C][/ROW]
[ROW][C]9[/C][C]0.20164[/C][C]1.711[/C][C]0.045696[/C][/ROW]
[ROW][C]10[/C][C]0.295303[/C][C]2.5057[/C][C]0.007241[/C][/ROW]
[ROW][C]11[/C][C]0.120693[/C][C]1.0241[/C][C]0.154605[/C][/ROW]
[ROW][C]12[/C][C]0.021604[/C][C]0.1833[/C][C]0.427534[/C][/ROW]
[ROW][C]13[/C][C]0.138406[/C][C]1.1744[/C][C]0.12205[/C][/ROW]
[ROW][C]14[/C][C]-0.026658[/C][C]-0.2262[/C][C]0.410844[/C][/ROW]
[ROW][C]15[/C][C]-0.061025[/C][C]-0.5178[/C][C]0.303087[/C][/ROW]
[ROW][C]16[/C][C]0.093598[/C][C]0.7942[/C][C]0.214843[/C][/ROW]
[ROW][C]17[/C][C]0.133508[/C][C]1.1329[/C][C]0.130517[/C][/ROW]
[ROW][C]18[/C][C]0.050714[/C][C]0.4303[/C][C]0.334124[/C][/ROW]
[ROW][C]19[/C][C]-0.078511[/C][C]-0.6662[/C][C]0.253709[/C][/ROW]
[ROW][C]20[/C][C]-0.104156[/C][C]-0.8838[/C][C]0.189875[/C][/ROW]
[ROW][C]21[/C][C]0.041578[/C][C]0.3528[/C][C]0.362634[/C][/ROW]
[ROW][C]22[/C][C]-0.051609[/C][C]-0.4379[/C][C]0.331378[/C][/ROW]
[ROW][C]23[/C][C]0.070634[/C][C]0.5993[/C][C]0.275411[/C][/ROW]
[ROW][C]24[/C][C]-0.029041[/C][C]-0.2464[/C][C]0.40303[/C][/ROW]
[ROW][C]25[/C][C]-0.003108[/C][C]-0.0264[/C][C]0.489517[/C][/ROW]
[ROW][C]26[/C][C]-0.107069[/C][C]-0.9085[/C][C]0.183321[/C][/ROW]
[ROW][C]27[/C][C]-0.015317[/C][C]-0.13[/C][C]0.448476[/C][/ROW]
[ROW][C]28[/C][C]0.019052[/C][C]0.1617[/C][C]0.436013[/C][/ROW]
[ROW][C]29[/C][C]0.169656[/C][C]1.4396[/C][C]0.077161[/C][/ROW]
[ROW][C]30[/C][C]0.032667[/C][C]0.2772[/C][C]0.391216[/C][/ROW]
[ROW][C]31[/C][C]-0.06544[/C][C]-0.5553[/C][C]0.290215[/C][/ROW]
[ROW][C]32[/C][C]-0.070838[/C][C]-0.6011[/C][C]0.274836[/C][/ROW]
[ROW][C]33[/C][C]-0.014591[/C][C]-0.1238[/C][C]0.450907[/C][/ROW]
[ROW][C]34[/C][C]0.007816[/C][C]0.0663[/C][C]0.473654[/C][/ROW]
[ROW][C]35[/C][C]-0.062578[/C][C]-0.531[/C][C]0.29853[/C][/ROW]
[ROW][C]36[/C][C]-0.055448[/C][C]-0.4705[/C][C]0.319713[/C][/ROW]
[ROW][C]37[/C][C]-0.067953[/C][C]-0.5766[/C][C]0.283003[/C][/ROW]
[ROW][C]38[/C][C]0.025842[/C][C]0.2193[/C][C]0.413527[/C][/ROW]
[ROW][C]39[/C][C]-0.028796[/C][C]-0.2443[/C][C]0.40383[/C][/ROW]
[ROW][C]40[/C][C]-0.132518[/C][C]-1.1244[/C][C]0.132279[/C][/ROW]
[ROW][C]41[/C][C]0.030802[/C][C]0.2614[/C][C]0.397278[/C][/ROW]
[ROW][C]42[/C][C]-0.029011[/C][C]-0.2462[/C][C]0.403126[/C][/ROW]
[ROW][C]43[/C][C]-0.01406[/C][C]-0.1193[/C][C]0.452685[/C][/ROW]
[ROW][C]44[/C][C]-0.067528[/C][C]-0.573[/C][C]0.284217[/C][/ROW]
[ROW][C]45[/C][C]0.047096[/C][C]0.3996[/C][C]0.345309[/C][/ROW]
[ROW][C]46[/C][C]-0.107634[/C][C]-0.9133[/C][C]0.182066[/C][/ROW]
[ROW][C]47[/C][C]-0.054834[/C][C]-0.4653[/C][C]0.321568[/C][/ROW]
[ROW][C]48[/C][C]-0.153701[/C][C]-1.3042[/C][C]0.098161[/C][/ROW]
[/TABLE]
Source: https://freestatistics.org/blog/index.php?pk=303801&T=2

Globally Unique Identifier (entire table): ba.freestatistics.org/blog/index.php?pk=303801&T=2

As an alternative you can also use a QR Code:  

The GUIDs for individual cells are displayed in the table below:

Partial Autocorrelation Function
Time lag kPACF(k)T-STATP-value
10.7550516.40680
2-0.402759-3.41750.000521
3-0.269154-2.28390.012666
4-0.372371-3.15970.001155
5-0.192068-1.62980.053761
6-0.11561-0.9810.164943
7-0.152737-1.2960.099555
80.0052160.04430.48241
90.201641.7110.045696
100.2953032.50570.007241
110.1206931.02410.154605
120.0216040.18330.427534
130.1384061.17440.12205
14-0.026658-0.22620.410844
15-0.061025-0.51780.303087
160.0935980.79420.214843
170.1335081.13290.130517
180.0507140.43030.334124
19-0.078511-0.66620.253709
20-0.104156-0.88380.189875
210.0415780.35280.362634
22-0.051609-0.43790.331378
230.0706340.59930.275411
24-0.029041-0.24640.40303
25-0.003108-0.02640.489517
26-0.107069-0.90850.183321
27-0.015317-0.130.448476
280.0190520.16170.436013
290.1696561.43960.077161
300.0326670.27720.391216
31-0.06544-0.55530.290215
32-0.070838-0.60110.274836
33-0.014591-0.12380.450907
340.0078160.06630.473654
35-0.062578-0.5310.29853
36-0.055448-0.47050.319713
37-0.067953-0.57660.283003
380.0258420.21930.413527
39-0.028796-0.24430.40383
40-0.132518-1.12440.132279
410.0308020.26140.397278
42-0.029011-0.24620.403126
43-0.01406-0.11930.452685
44-0.067528-0.5730.284217
450.0470960.39960.345309
46-0.107634-0.91330.182066
47-0.054834-0.46530.321568
48-0.153701-1.30420.098161


Parameters (Session):
par1 = DefaultDefault4848 ; par2 = 1111 ; par3 = 0000 ; par4 = 0000 ; par5 = 12121212 ; par6 = White NoiseWhite NoiseWhite NoiseWhite Noise ; par7 = 0.950.95 ;
Parameters (R input):
par1 = 48 ; par2 = 1 ; par3 = 0 ; par4 = 0 ; par5 = 12 ; par6 = White Noise ; par7 = 0.95 ; par8 = ;
R code (references can be found in the software module):
par8 <- ''
par7 <- ''
par6 <- 'White Noise'
par5 <- '12'
par4 <- '0'
par3 <- '0'
par2 <- '1'
par1 <- '48'
if (par1 == 'Default') {
par1 = 10*log10(length(x))
} else {
par1 <- as.numeric(par1)
}
par2 <- as.numeric(par2)
par3 <- as.numeric(par3)
par4 <- as.numeric(par4)
par5 <- as.numeric(par5)
if (par6 == 'White Noise') par6 <- 'white' else par6 <- 'ma'
par7 <- as.numeric(par7)
if (par8 != '') par8 <- as.numeric(par8)
x <- na.omit(x)
ox <- x
if (par8 == '') {
if (par2 == 0) {
x <- log(x)
} else {
x <- (x ^ par2 - 1) / par2
}
} else {
x <- log(x,base=par8)
}
if (par3 > 0) x <- diff(x,lag=1,difference=par3)
if (par4 > 0) x <- diff(x,lag=par5,difference=par4)
bitmap(file='picts.png')
op <- par(mfrow=c(2,1))
plot(ox,type='l',main='Original Time Series',xlab='time',ylab='value')
if (par8=='') {
mytitle <- paste('Working Time Series (lambda=',par2,', d=',par3,', D=',par4,')',sep='')
mysub <- paste('(lambda=',par2,', d=',par3,', D=',par4,', CI=', par7, ', CI type=',par6,')',sep='')
} else {
mytitle <- paste('Working Time Series (base=',par8,', d=',par3,', D=',par4,')',sep='')
mysub <- paste('(base=',par8,', d=',par3,', D=',par4,', CI=', par7, ', CI type=',par6,')',sep='')
}
plot(x,type='l', main=mytitle,xlab='time',ylab='value')
par(op)
dev.off()
bitmap(file='pic1.png')
racf <- acf(x, par1, main='Autocorrelation', xlab='time lag', ylab='ACF', ci.type=par6, ci=par7, sub=mysub)
dev.off()
bitmap(file='pic2.png')
rpacf <- pacf(x,par1,main='Partial Autocorrelation',xlab='lags',ylab='PACF',sub=mysub)
dev.off()
(myacf <- c(racf$acf))
(mypacf <- c(rpacf$acf))
lengthx <- length(x)
sqrtn <- sqrt(lengthx)
load(file='createtable')
a<-table.start()
a<-table.row.start(a)
a<-table.element(a,'Autocorrelation Function',4,TRUE)
a<-table.row.end(a)
a<-table.row.start(a)
a<-table.element(a,'Time lag k',header=TRUE)
a<-table.element(a,'ACF(k)',header=TRUE)
a<-table.element(a,'T-STAT',header=TRUE)
a<-table.element(a,'P-value',header=TRUE)
a<-table.row.end(a)
for (i in 2:(par1+1)) {
a<-table.row.start(a)
a<-table.element(a,i-1,header=TRUE)
a<-table.element(a,round(myacf[i],6))
mytstat <- myacf[i]*sqrtn
a<-table.element(a,round(mytstat,4))
a<-table.element(a,round(1-pt(abs(mytstat),lengthx),6))
a<-table.row.end(a)
}
a<-table.end(a)
table.save(a,file='mytable.tab')
a<-table.start()
a<-table.row.start(a)
a<-table.element(a,'Partial Autocorrelation Function',4,TRUE)
a<-table.row.end(a)
a<-table.row.start(a)
a<-table.element(a,'Time lag k',header=TRUE)
a<-table.element(a,'PACF(k)',header=TRUE)
a<-table.element(a,'T-STAT',header=TRUE)
a<-table.element(a,'P-value',header=TRUE)
a<-table.row.end(a)
for (i in 1:par1) {
a<-table.row.start(a)
a<-table.element(a,i,header=TRUE)
a<-table.element(a,round(mypacf[i],6))
mytstat <- mypacf[i]*sqrtn
a<-table.element(a,round(mytstat,4))
a<-table.element(a,round(1-pt(abs(mytstat),lengthx),6))
a<-table.row.end(a)
}
a<-table.end(a)
table.save(a,file='mytable1.tab')