Free Statistics

of Irreproducible Research!

Author's title

Author*The author of this computation has been verified*
R Software Modulerwasp_boxcoxnorm.wasp
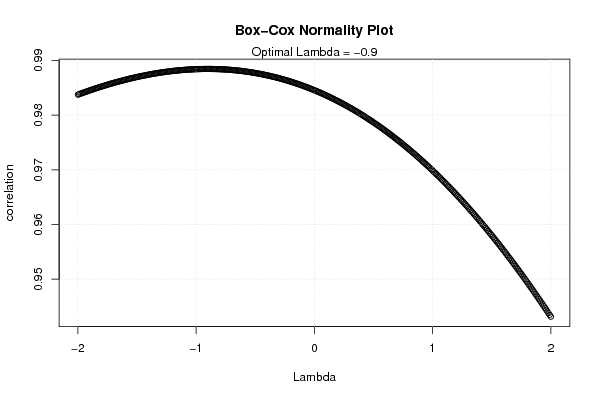
Title produced by softwareBox-Cox Normality Plot
Date of computationFri, 23 Dec 2016 15:14:48 +0100
Cite this page as followsStatistical Computations at FreeStatistics.org, Office for Research Development and Education, URL https://freestatistics.org/blog/index.php?v=date/2016/Dec/23/t14825025533er4kpltzka6i88.htm/, Retrieved Fri, 01 Nov 2024 03:41:08 +0000
Statistical Computations at FreeStatistics.org, Office for Research Development and Education, URL https://freestatistics.org/blog/index.php?pk=302963, Retrieved Fri, 01 Nov 2024 03:41:08 +0000
QR Codes:

Original text written by user:
IsPrivate?No (this computation is public)
User-defined keywords
Estimated Impact111
Family? (F = Feedback message, R = changed R code, M = changed R Module, P = changed Parameters, D = changed Data)
-       [Box-Cox Normality Plot] [BCNP N2671] [2016-12-23 14:14:48] [11b61e09f442d73f657668491c17a736] [Current]
Feedback Forum

Post a new message
Dataseries X:
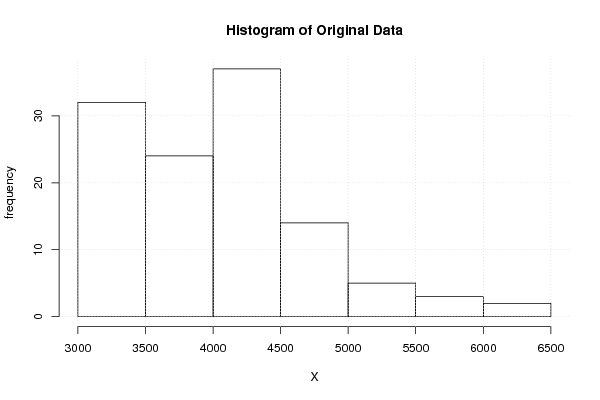
6258.5
6191
5939.5
5517.5
5382.5
5785
5353.5
5205.5
4915
4691.5
4564.5
4496
4877.5
4703.5
4528.5
4262.5
4077
4291
4357
4191
4025.5
3994.5
3934.5
3989
4565.5
4451
4312.5
4075
4005.5
4376.5
4341
4025.5
3992
3958.5
3907.5
3858.5
4236
4520.5
4333.5
4057.5
4079
4387.5
4235.5
3977.5
4007.5
3921
3936
3730.5
4310
4251.5
4062
3653
3659
3827.5
3726.5
3544
3428.5
3422.5
3401
3263
3801.5
3741
3545
3179.5
3276.5
3409.5
3411.5
3329.5
3184
3091
3162.5
3071
3654.5
3441.5
3189
3114.5
3078
3425
3368
3176
3165
3111
3247.5
3150
3628
3567
3348.5
3228.5
3181.5
3351
3472.5
3418.5
3409
3361
3605.5
3671.5
4297.5
4459.5
4402
4024.5
4116.5
4387
4288
4118.5
4035
4006.5
4143
4279.5
4974.5
5080.5
4845.5
4472.5
4584.5
5047.5
4922.5
4695
4545


Summary of computational transaction
Raw Input view raw input (R code)
Raw Outputview raw output of R engine
Computing time5 seconds
R ServerBig Analytics Cloud Computing Center

\begin{tabular}{lllllllll}
\hline
Summary of computational transaction \tabularnewline
Raw Input view raw input (R code)  \tabularnewline
Raw Outputview raw output of R engine  \tabularnewline
Computing time5 seconds \tabularnewline
R ServerBig Analytics Cloud Computing Center \tabularnewline
\hline
\end{tabular}
%Source: https://freestatistics.org/blog/index.php?pk=302963&T=0

[TABLE]
[ROW]
Summary of computational transaction[/C][/ROW] [ROW]Raw Input[/C] view raw input (R code) [/C][/ROW] [ROW]Raw Output[/C]view raw output of R engine [/C][/ROW] [ROW]Computing time[/C]5 seconds[/C][/ROW] [ROW]R Server[/C]Big Analytics Cloud Computing Center[/C][/ROW] [/TABLE] Source: https://freestatistics.org/blog/index.php?pk=302963&T=0

Globally Unique Identifier (entire table): ba.freestatistics.org/blog/index.php?pk=302963&T=0

As an alternative you can also use a QR Code:  

The GUIDs for individual cells are displayed in the table below:

Summary of computational transaction
Raw Input view raw input (R code)
Raw Outputview raw output of R engine
Computing time5 seconds
R ServerBig Analytics Cloud Computing Center


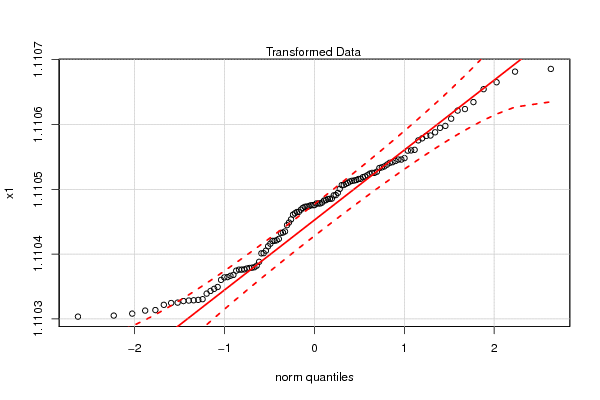
Box-Cox Normality Plot
# observations x117
maximum correlation0.988448233937327
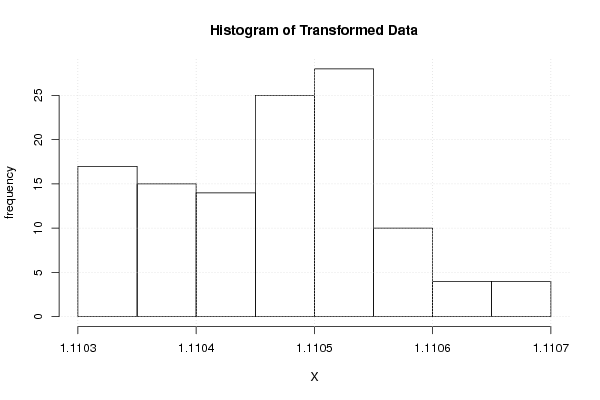
optimal lambda-0.9
transformation formulafor all lambda <> 0 : T(Y) = (Y^lambda - 1) / lambda

\begin{tabular}{lllllllll}
\hline
Box-Cox Normality Plot \tabularnewline
# observations x & 117 \tabularnewline
maximum correlation & 0.988448233937327 \tabularnewline
optimal lambda & -0.9 \tabularnewline
transformation formula & for all lambda <> 0 : T(Y) = (Y^lambda - 1) / lambda \tabularnewline
\hline
\end{tabular}
%Source: https://freestatistics.org/blog/index.php?pk=302963&T=1

[TABLE]
[ROW][C]Box-Cox Normality Plot[/C][/ROW]
[ROW][C]# observations x[/C][C]117[/C][/ROW]
[ROW][C]maximum correlation[/C][C]0.988448233937327[/C][/ROW]
[ROW][C]optimal lambda[/C][C]-0.9[/C][/ROW]
[ROW][C]transformation formula[/C][C]for all lambda <> 0 : T(Y) = (Y^lambda - 1) / lambda[/C][/ROW]
[/TABLE]
Source: https://freestatistics.org/blog/index.php?pk=302963&T=1

Globally Unique Identifier (entire table): ba.freestatistics.org/blog/index.php?pk=302963&T=1

As an alternative you can also use a QR Code:  

The GUIDs for individual cells are displayed in the table below:

Box-Cox Normality Plot
# observations x117
maximum correlation0.988448233937327
optimal lambda-0.9
transformation formulafor all lambda <> 0 : T(Y) = (Y^lambda - 1) / lambda


Maximum Likelihood Estimation of Lambda
> summary(mypT)
bcPower Transformation to Normality 
  Est.Power Std.Err. Wald Lower Bound Wald Upper Bound
x   -1.0509   0.5305          -2.0906          -0.0111
Likelihood ratio tests about transformation parameters
                            LRT df         pval
LR test, lambda = (0)  4.123322  1 0.0422959426
LR test, lambda = (1) 16.379654  1 0.0000518387

\begin{tabular}{lllllllll}
\hline
Maximum Likelihood Estimation of Lambda \tabularnewline
> summary(mypT)
bcPower Transformation to Normality 
  Est.Power Std.Err. Wald Lower Bound Wald Upper Bound
x   -1.0509   0.5305          -2.0906          -0.0111
Likelihood ratio tests about transformation parameters
                            LRT df         pval
LR test, lambda = (0)  4.123322  1 0.0422959426
LR test, lambda = (1) 16.379654  1 0.0000518387
\tabularnewline \hline \end{tabular} %Source: https://freestatistics.org/blog/index.php?pk=302963&T=2

[TABLE]
[ROW][C]Maximum Likelihood Estimation of Lambda[/C][/ROW]
[ROW][C]
> summary(mypT)
bcPower Transformation to Normality 
  Est.Power Std.Err. Wald Lower Bound Wald Upper Bound
x   -1.0509   0.5305          -2.0906          -0.0111
Likelihood ratio tests about transformation parameters
                            LRT df         pval
LR test, lambda = (0)  4.123322  1 0.0422959426
LR test, lambda = (1) 16.379654  1 0.0000518387
[/C][/ROW] [/TABLE] Source: https://freestatistics.org/blog/index.php?pk=302963&T=2

Globally Unique Identifier (entire table): ba.freestatistics.org/blog/index.php?pk=302963&T=2

As an alternative you can also use a QR Code:  

The GUIDs for individual cells are displayed in the table below:

Maximum Likelihood Estimation of Lambda
> summary(mypT)
bcPower Transformation to Normality 
  Est.Power Std.Err. Wald Lower Bound Wald Upper Bound
x   -1.0509   0.5305          -2.0906          -0.0111
Likelihood ratio tests about transformation parameters
                            LRT df         pval
LR test, lambda = (0)  4.123322  1 0.0422959426
LR test, lambda = (1) 16.379654  1 0.0000518387


Parameters (Session):
par1 = 12 ;
Parameters (R input):
par1 = Full Box-Cox transform ; par2 = -2 ; par3 = 2 ; par4 = 0 ; par5 = No ;
R code (references can be found in the software module):
library(car)
par2 <- abs(as.numeric(par2)*100)
par3 <- as.numeric(par3)*100
if(par4=='') par4 <- 0
par4 <- as.numeric(par4)
numlam <- par2 + par3 + 1
x <- x + par4
n <- length(x)
c <- array(NA,dim=c(numlam))
l <- array(NA,dim=c(numlam))
mx <- -1
mxli <- -999
for (i in 1:numlam)
{
l[i] <- (i-par2-1)/100
if (l[i] != 0)
{
if (par1 == 'Full Box-Cox transform') x1 <- (x^l[i] - 1) / l[i]
if (par1 == 'Simple Box-Cox transform') x1 <- x^l[i]
} else {
x1 <- log(x)
}
c[i] <- cor(qnorm(ppoints(x), mean=0, sd=1),sort(x1))
if (mx < c[i])
{
mx <- c[i]
mxli <- l[i]
x1.best <- x1
}
}
print(c)
print(mx)
print(mxli)
print(x1.best)
if (mxli != 0)
{
if (par1 == 'Full Box-Cox transform') x1 <- (x^mxli - 1) / mxli
if (par1 == 'Simple Box-Cox transform') x1 <- x^mxli
} else {
x1 <- log(x)
}
mypT <- powerTransform(x)
summary(mypT)
bitmap(file='test1.png')
plot(l,c,main='Box-Cox Normality Plot', xlab='Lambda',ylab='correlation')
mtext(paste('Optimal Lambda =',mxli))
grid()
dev.off()
bitmap(file='test2.png')
hist(x,main='Histogram of Original Data',xlab='X',ylab='frequency')
grid()
dev.off()
bitmap(file='test3.png')
hist(x1,main='Histogram of Transformed Data', xlab='X',ylab='frequency')
grid()
dev.off()
bitmap(file='test4.png')
qqPlot(x)
grid()
mtext('Original Data')
dev.off()
bitmap(file='test5.png')
qqPlot(x1)
grid()
mtext('Transformed Data')
dev.off()
load(file='createtable')
a<-table.start()
a<-table.row.start(a)
a<-table.element(a,'Box-Cox Normality Plot',2,TRUE)
a<-table.row.end(a)
a<-table.row.start(a)
a<-table.element(a,'# observations x',header=TRUE)
a<-table.element(a,n)
a<-table.row.end(a)
a<-table.row.start(a)
a<-table.element(a,'maximum correlation',header=TRUE)
a<-table.element(a,mx)
a<-table.row.end(a)
a<-table.row.start(a)
a<-table.element(a,'optimal lambda',header=TRUE)
a<-table.element(a,mxli)
a<-table.row.end(a)
a<-table.row.start(a)
a<-table.element(a,'transformation formula',header=TRUE)
if (par1 == 'Full Box-Cox transform') {
a<-table.element(a,'for all lambda <> 0 : T(Y) = (Y^lambda - 1) / lambda')
} else {
a<-table.element(a,'for all lambda <> 0 : T(Y) = Y^lambda')
}
a<-table.row.end(a)
if(mx<0) {
a<-table.row.start(a)
a<-table.element(a,'Warning: maximum correlation is negative! The Box-Cox transformation must not be used.',2)
a<-table.row.end(a)
}
a<-table.end(a)
table.save(a,file='mytable.tab')
if(par5=='Yes') {
a<-table.start()
a<-table.row.start(a)
a<-table.element(a,'Obs.',header=T)
a<-table.element(a,'Original',header=T)
a<-table.element(a,'Transformed',header=T)
a<-table.row.end(a)
for (i in 1:n) {
a<-table.row.start(a)
a<-table.element(a,i)
a<-table.element(a,x[i])
a<-table.element(a,x1.best[i])
a<-table.row.end(a)
}
a<-table.end(a)
table.save(a,file='mytable1.tab')
}
a<-table.start()
a<-table.row.start(a)
a<-table.element(a,'Maximum Likelihood Estimation of Lambda',1,TRUE)
a<-table.row.end(a)
a<-table.row.start(a)
a<-table.element(a,paste('
',RC.texteval('summary(mypT)'),'
',sep=''))
a<-table.row.end(a)
a<-table.end(a)
table.save(a,file='mytable3.tab')