Free Statistics

of Irreproducible Research!

Author's title

Author*The author of this computation has been verified*
R Software Modulerwasp_arimabackwardselection.wasp
Title produced by softwareARIMA Backward Selection
Date of computationFri, 23 Dec 2016 15:03:31 +0100
Cite this page as followsStatistical Computations at FreeStatistics.org, Office for Research Development and Education, URL https://freestatistics.org/blog/index.php?v=date/2016/Dec/23/t1482501886geai8pfnn2oenpj.htm/, Retrieved Fri, 01 Nov 2024 03:39:02 +0000
Statistical Computations at FreeStatistics.org, Office for Research Development and Education, URL https://freestatistics.org/blog/index.php?pk=302959, Retrieved Fri, 01 Nov 2024 03:39:02 +0000
QR Codes:

Original text written by user:
IsPrivate?No (this computation is public)
User-defined keywords
Estimated Impact114
Family? (F = Feedback message, R = changed R code, M = changed R Module, P = changed Parameters, D = changed Data)
-       [ARIMA Backward Selection] [] [2016-12-23 14:03:31] [c4ef4c70482680cab119953cba46aca4] [Current]
Feedback Forum

Post a new message
Dataseries X:
4998
4480
4824
4814
4602
4499
4594
4600
4507
4606
4503
4801
4564
4142
4818
4408
4496
4587
4656
4799
4652
4638
4650
5185
5208
4477
4976
4670
4842
4713
4804
4996
4574
4841
4688
4766
4994
4514
4766
4642
4806
4645
4784
4979
4530
4942
4651
5150
4987
4532
5046
4783
4958
4815
5055
5152
4773
5147
4866
5311
5172
4734
5011
4957
4968
5049
5305
5067
5001
5252
4903
5408
5395
5150
5460
4968
5021
5118
5175
5420
5121
5450
5286
5693
5353
5017
5577
4987
5129
5249
5100
5382
5039
5364
5193
5846
5259
4809
5297
5034
5243
5150
5296
5596
4954
5250
5009
5113
5237
4575
5026
4842
5019
5063
5261
5327
5054
5269
5019
5315
5274
4899
5216
5029
5110
5093


Summary of computational transaction
Raw Input view raw input (R code)
Raw Outputview raw output of R engine
Computing time7 seconds
R ServerBig Analytics Cloud Computing Center

\begin{tabular}{lllllllll}
\hline
Summary of computational transaction \tabularnewline
Raw Input view raw input (R code)  \tabularnewline
Raw Outputview raw output of R engine  \tabularnewline
Computing time7 seconds \tabularnewline
R ServerBig Analytics Cloud Computing Center \tabularnewline
\hline
\end{tabular}
%Source: https://freestatistics.org/blog/index.php?pk=302959&T=0

[TABLE]
[ROW]
Summary of computational transaction[/C][/ROW] [ROW]Raw Input[/C] view raw input (R code) [/C][/ROW] [ROW]Raw Output[/C]view raw output of R engine [/C][/ROW] [ROW]Computing time[/C]7 seconds[/C][/ROW] [ROW]R Server[/C]Big Analytics Cloud Computing Center[/C][/ROW] [/TABLE] Source: https://freestatistics.org/blog/index.php?pk=302959&T=0

Globally Unique Identifier (entire table): ba.freestatistics.org/blog/index.php?pk=302959&T=0

As an alternative you can also use a QR Code:  

The GUIDs for individual cells are displayed in the table below:

Summary of computational transaction
Raw Input view raw input (R code)
Raw Outputview raw output of R engine
Computing time7 seconds
R ServerBig Analytics Cloud Computing Center


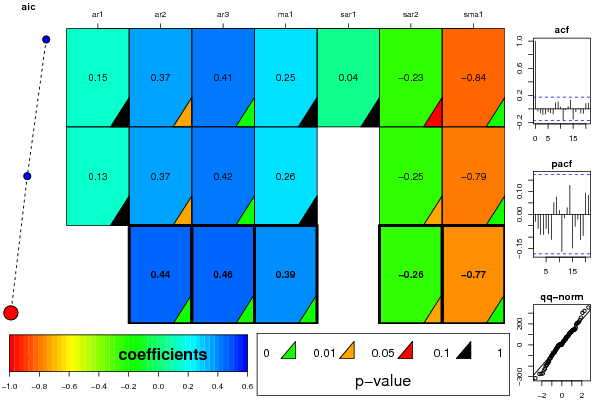
ARIMA Parameter Estimation and Backward Selection
Iterationar1ar2ar3ma1sar1sar2sma1
Estimates ( 1 )0.14560.3680.41410.25440.0407-0.2338-0.8365
(p-val)(0.5762 )(0.0193 )(7e-04 )(0.3615 )(0.7756 )(0.0738 )(4e-04 )
Estimates ( 2 )0.13440.37060.41820.26010-0.2518-0.7932
(p-val)(0.5922 )(0.0155 )(5e-04 )(0.3377 )(NA )(0.0277 )(0 )
Estimates ( 3 )00.44060.46210.39390-0.2593-0.7731
(p-val)(NA )(0 )(0 )(0 )(NA )(0.0223 )(0 )
Estimates ( 4 )NANANANANANANA
(p-val)(NA )(NA )(NA )(NA )(NA )(NA )(NA )
Estimates ( 5 )NANANANANANANA
(p-val)(NA )(NA )(NA )(NA )(NA )(NA )(NA )
Estimates ( 6 )NANANANANANANA
(p-val)(NA )(NA )(NA )(NA )(NA )(NA )(NA )
Estimates ( 7 )NANANANANANANA
(p-val)(NA )(NA )(NA )(NA )(NA )(NA )(NA )
Estimates ( 8 )NANANANANANANA
(p-val)(NA )(NA )(NA )(NA )(NA )(NA )(NA )
Estimates ( 9 )NANANANANANANA
(p-val)(NA )(NA )(NA )(NA )(NA )(NA )(NA )
Estimates ( 10 )NANANANANANANA
(p-val)(NA )(NA )(NA )(NA )(NA )(NA )(NA )
Estimates ( 11 )NANANANANANANA
(p-val)(NA )(NA )(NA )(NA )(NA )(NA )(NA )
Estimates ( 12 )NANANANANANANA
(p-val)(NA )(NA )(NA )(NA )(NA )(NA )(NA )
Estimates ( 13 )NANANANANANANA
(p-val)(NA )(NA )(NA )(NA )(NA )(NA )(NA )

\begin{tabular}{lllllllll}
\hline
ARIMA Parameter Estimation and Backward Selection \tabularnewline
Iteration & ar1 & ar2 & ar3 & ma1 & sar1 & sar2 & sma1 \tabularnewline
Estimates ( 1 ) & 0.1456 & 0.368 & 0.4141 & 0.2544 & 0.0407 & -0.2338 & -0.8365 \tabularnewline
(p-val) & (0.5762 ) & (0.0193 ) & (7e-04 ) & (0.3615 ) & (0.7756 ) & (0.0738 ) & (4e-04 ) \tabularnewline
Estimates ( 2 ) & 0.1344 & 0.3706 & 0.4182 & 0.2601 & 0 & -0.2518 & -0.7932 \tabularnewline
(p-val) & (0.5922 ) & (0.0155 ) & (5e-04 ) & (0.3377 ) & (NA ) & (0.0277 ) & (0 ) \tabularnewline
Estimates ( 3 ) & 0 & 0.4406 & 0.4621 & 0.3939 & 0 & -0.2593 & -0.7731 \tabularnewline
(p-val) & (NA ) & (0 ) & (0 ) & (0 ) & (NA ) & (0.0223 ) & (0 ) \tabularnewline
Estimates ( 4 ) & NA & NA & NA & NA & NA & NA & NA \tabularnewline
(p-val) & (NA ) & (NA ) & (NA ) & (NA ) & (NA ) & (NA ) & (NA ) \tabularnewline
Estimates ( 5 ) & NA & NA & NA & NA & NA & NA & NA \tabularnewline
(p-val) & (NA ) & (NA ) & (NA ) & (NA ) & (NA ) & (NA ) & (NA ) \tabularnewline
Estimates ( 6 ) & NA & NA & NA & NA & NA & NA & NA \tabularnewline
(p-val) & (NA ) & (NA ) & (NA ) & (NA ) & (NA ) & (NA ) & (NA ) \tabularnewline
Estimates ( 7 ) & NA & NA & NA & NA & NA & NA & NA \tabularnewline
(p-val) & (NA ) & (NA ) & (NA ) & (NA ) & (NA ) & (NA ) & (NA ) \tabularnewline
Estimates ( 8 ) & NA & NA & NA & NA & NA & NA & NA \tabularnewline
(p-val) & (NA ) & (NA ) & (NA ) & (NA ) & (NA ) & (NA ) & (NA ) \tabularnewline
Estimates ( 9 ) & NA & NA & NA & NA & NA & NA & NA \tabularnewline
(p-val) & (NA ) & (NA ) & (NA ) & (NA ) & (NA ) & (NA ) & (NA ) \tabularnewline
Estimates ( 10 ) & NA & NA & NA & NA & NA & NA & NA \tabularnewline
(p-val) & (NA ) & (NA ) & (NA ) & (NA ) & (NA ) & (NA ) & (NA ) \tabularnewline
Estimates ( 11 ) & NA & NA & NA & NA & NA & NA & NA \tabularnewline
(p-val) & (NA ) & (NA ) & (NA ) & (NA ) & (NA ) & (NA ) & (NA ) \tabularnewline
Estimates ( 12 ) & NA & NA & NA & NA & NA & NA & NA \tabularnewline
(p-val) & (NA ) & (NA ) & (NA ) & (NA ) & (NA ) & (NA ) & (NA ) \tabularnewline
Estimates ( 13 ) & NA & NA & NA & NA & NA & NA & NA \tabularnewline
(p-val) & (NA ) & (NA ) & (NA ) & (NA ) & (NA ) & (NA ) & (NA ) \tabularnewline
\hline
\end{tabular}
%Source: https://freestatistics.org/blog/index.php?pk=302959&T=1

[TABLE]
[ROW][C]ARIMA Parameter Estimation and Backward Selection[/C][/ROW]
[ROW][C]Iteration[/C][C]ar1[/C][C]ar2[/C][C]ar3[/C][C]ma1[/C][C]sar1[/C][C]sar2[/C][C]sma1[/C][/ROW]
[ROW][C]Estimates ( 1 )[/C][C]0.1456[/C][C]0.368[/C][C]0.4141[/C][C]0.2544[/C][C]0.0407[/C][C]-0.2338[/C][C]-0.8365[/C][/ROW]
[ROW][C](p-val)[/C][C](0.5762 )[/C][C](0.0193 )[/C][C](7e-04 )[/C][C](0.3615 )[/C][C](0.7756 )[/C][C](0.0738 )[/C][C](4e-04 )[/C][/ROW]
[ROW][C]Estimates ( 2 )[/C][C]0.1344[/C][C]0.3706[/C][C]0.4182[/C][C]0.2601[/C][C]0[/C][C]-0.2518[/C][C]-0.7932[/C][/ROW]
[ROW][C](p-val)[/C][C](0.5922 )[/C][C](0.0155 )[/C][C](5e-04 )[/C][C](0.3377 )[/C][C](NA )[/C][C](0.0277 )[/C][C](0 )[/C][/ROW]
[ROW][C]Estimates ( 3 )[/C][C]0[/C][C]0.4406[/C][C]0.4621[/C][C]0.3939[/C][C]0[/C][C]-0.2593[/C][C]-0.7731[/C][/ROW]
[ROW][C](p-val)[/C][C](NA )[/C][C](0 )[/C][C](0 )[/C][C](0 )[/C][C](NA )[/C][C](0.0223 )[/C][C](0 )[/C][/ROW]
[ROW][C]Estimates ( 4 )[/C][C]NA[/C][C]NA[/C][C]NA[/C][C]NA[/C][C]NA[/C][C]NA[/C][C]NA[/C][/ROW]
[ROW][C](p-val)[/C][C](NA )[/C][C](NA )[/C][C](NA )[/C][C](NA )[/C][C](NA )[/C][C](NA )[/C][C](NA )[/C][/ROW]
[ROW][C]Estimates ( 5 )[/C][C]NA[/C][C]NA[/C][C]NA[/C][C]NA[/C][C]NA[/C][C]NA[/C][C]NA[/C][/ROW]
[ROW][C](p-val)[/C][C](NA )[/C][C](NA )[/C][C](NA )[/C][C](NA )[/C][C](NA )[/C][C](NA )[/C][C](NA )[/C][/ROW]
[ROW][C]Estimates ( 6 )[/C][C]NA[/C][C]NA[/C][C]NA[/C][C]NA[/C][C]NA[/C][C]NA[/C][C]NA[/C][/ROW]
[ROW][C](p-val)[/C][C](NA )[/C][C](NA )[/C][C](NA )[/C][C](NA )[/C][C](NA )[/C][C](NA )[/C][C](NA )[/C][/ROW]
[ROW][C]Estimates ( 7 )[/C][C]NA[/C][C]NA[/C][C]NA[/C][C]NA[/C][C]NA[/C][C]NA[/C][C]NA[/C][/ROW]
[ROW][C](p-val)[/C][C](NA )[/C][C](NA )[/C][C](NA )[/C][C](NA )[/C][C](NA )[/C][C](NA )[/C][C](NA )[/C][/ROW]
[ROW][C]Estimates ( 8 )[/C][C]NA[/C][C]NA[/C][C]NA[/C][C]NA[/C][C]NA[/C][C]NA[/C][C]NA[/C][/ROW]
[ROW][C](p-val)[/C][C](NA )[/C][C](NA )[/C][C](NA )[/C][C](NA )[/C][C](NA )[/C][C](NA )[/C][C](NA )[/C][/ROW]
[ROW][C]Estimates ( 9 )[/C][C]NA[/C][C]NA[/C][C]NA[/C][C]NA[/C][C]NA[/C][C]NA[/C][C]NA[/C][/ROW]
[ROW][C](p-val)[/C][C](NA )[/C][C](NA )[/C][C](NA )[/C][C](NA )[/C][C](NA )[/C][C](NA )[/C][C](NA )[/C][/ROW]
[ROW][C]Estimates ( 10 )[/C][C]NA[/C][C]NA[/C][C]NA[/C][C]NA[/C][C]NA[/C][C]NA[/C][C]NA[/C][/ROW]
[ROW][C](p-val)[/C][C](NA )[/C][C](NA )[/C][C](NA )[/C][C](NA )[/C][C](NA )[/C][C](NA )[/C][C](NA )[/C][/ROW]
[ROW][C]Estimates ( 11 )[/C][C]NA[/C][C]NA[/C][C]NA[/C][C]NA[/C][C]NA[/C][C]NA[/C][C]NA[/C][/ROW]
[ROW][C](p-val)[/C][C](NA )[/C][C](NA )[/C][C](NA )[/C][C](NA )[/C][C](NA )[/C][C](NA )[/C][C](NA )[/C][/ROW]
[ROW][C]Estimates ( 12 )[/C][C]NA[/C][C]NA[/C][C]NA[/C][C]NA[/C][C]NA[/C][C]NA[/C][C]NA[/C][/ROW]
[ROW][C](p-val)[/C][C](NA )[/C][C](NA )[/C][C](NA )[/C][C](NA )[/C][C](NA )[/C][C](NA )[/C][C](NA )[/C][/ROW]
[ROW][C]Estimates ( 13 )[/C][C]NA[/C][C]NA[/C][C]NA[/C][C]NA[/C][C]NA[/C][C]NA[/C][C]NA[/C][/ROW]
[ROW][C](p-val)[/C][C](NA )[/C][C](NA )[/C][C](NA )[/C][C](NA )[/C][C](NA )[/C][C](NA )[/C][C](NA )[/C][/ROW]
[/TABLE]
Source: https://freestatistics.org/blog/index.php?pk=302959&T=1

Globally Unique Identifier (entire table): ba.freestatistics.org/blog/index.php?pk=302959&T=1

As an alternative you can also use a QR Code:  

The GUIDs for individual cells are displayed in the table below:

ARIMA Parameter Estimation and Backward Selection
Iterationar1ar2ar3ma1sar1sar2sma1
Estimates ( 1 )0.14560.3680.41410.25440.0407-0.2338-0.8365
(p-val)(0.5762 )(0.0193 )(7e-04 )(0.3615 )(0.7756 )(0.0738 )(4e-04 )
Estimates ( 2 )0.13440.37060.41820.26010-0.2518-0.7932
(p-val)(0.5922 )(0.0155 )(5e-04 )(0.3377 )(NA )(0.0277 )(0 )
Estimates ( 3 )00.44060.46210.39390-0.2593-0.7731
(p-val)(NA )(0 )(0 )(0 )(NA )(0.0223 )(0 )
Estimates ( 4 )NANANANANANANA
(p-val)(NA )(NA )(NA )(NA )(NA )(NA )(NA )
Estimates ( 5 )NANANANANANANA
(p-val)(NA )(NA )(NA )(NA )(NA )(NA )(NA )
Estimates ( 6 )NANANANANANANA
(p-val)(NA )(NA )(NA )(NA )(NA )(NA )(NA )
Estimates ( 7 )NANANANANANANA
(p-val)(NA )(NA )(NA )(NA )(NA )(NA )(NA )
Estimates ( 8 )NANANANANANANA
(p-val)(NA )(NA )(NA )(NA )(NA )(NA )(NA )
Estimates ( 9 )NANANANANANANA
(p-val)(NA )(NA )(NA )(NA )(NA )(NA )(NA )
Estimates ( 10 )NANANANANANANA
(p-val)(NA )(NA )(NA )(NA )(NA )(NA )(NA )
Estimates ( 11 )NANANANANANANA
(p-val)(NA )(NA )(NA )(NA )(NA )(NA )(NA )
Estimates ( 12 )NANANANANANANA
(p-val)(NA )(NA )(NA )(NA )(NA )(NA )(NA )
Estimates ( 13 )NANANANANANANA
(p-val)(NA )(NA )(NA )(NA )(NA )(NA )(NA )


Estimated ARIMA Residuals
Value
4.80092332096904
-225.325637421572
-36.8742996257335
211.002607734092
-158.687187985867
75.0575255579736
142.315174757216
129.894627173308
89.12836481156
2.49257413873191
-98.6830920127606
-8.75375642967456
219.865045759391
304.220150872716
-68.2887694412371
-128.1834234016
-124.857525648953
144.245081487889
-33.9843225813055
-4.73438249281714
41.0279920396924
-168.188317511245
74.1534147184408
-73.5544177974975
-271.20960942994
-18.0115630974356
148.942415670184
-49.1904916931788
-39.7557787838741
118.597780596815
56.0485655034583
44.1213923743076
77.9689510246549
-107.705051139808
132.197695770622
-88.2592191800102
258.722701983622
-73.9202831665354
31.3453080491515
39.9178166179948
16.3637905843268
122.076641636584
-6.26603341594807
147.346892009431
33.9832713924069
-67.8183280775903
108.361984759983
-45.9349485419293
24.2229810332656
-71.4521725911169
106.989256022322
-172.69105400781
109.915074501684
-10.0466135709024
208.481149511854
195.180390832494
-193.121391112393
54.3092086390445
84.0804593627755
-64.4754630166586
75.7158204563683
61.4511806732566
353.820888629087
96.0398037408722
-239.514259631545
-199.436898053251
77.1632652831597
42.1659067052519
202.72169185409
55.4132059019441
164.403004344487
96.4631034546516
120.617281721723
-269.480743214817
-25.3967543770269
134.286535819089
-123.911061246731
-73.5475689068195
144.863185303808
-92.5615713883846
16.7186021952517
-11.1837056594035
111.587265527246
36.6783413271889
321.744359622941
-273.671753849059
-129.836823136105
-77.402155878215
76.0620132136363
121.973957339578
19.2653115586233
57.8263140279064
235.668849873949
-187.285824819812
-102.179263756264
-106.408669879742
-313.572837513799
47.5314235379046
-151.828236524291
34.2327004368521
-7.14350339932769
142.325787838149
144.849575486595
115.506602723233
-2.03289241300995
59.9311125901644
-22.1777028963716
-25.1123171008908
-51.9779474281907
-25.6578381808113
82.9353342164121
-47.9696502726693
90.3714564052563
22.6070697101337
3.21030633417861

\begin{tabular}{lllllllll}
\hline
Estimated ARIMA Residuals \tabularnewline
Value \tabularnewline
4.80092332096904 \tabularnewline
-225.325637421572 \tabularnewline
-36.8742996257335 \tabularnewline
211.002607734092 \tabularnewline
-158.687187985867 \tabularnewline
75.0575255579736 \tabularnewline
142.315174757216 \tabularnewline
129.894627173308 \tabularnewline
89.12836481156 \tabularnewline
2.49257413873191 \tabularnewline
-98.6830920127606 \tabularnewline
-8.75375642967456 \tabularnewline
219.865045759391 \tabularnewline
304.220150872716 \tabularnewline
-68.2887694412371 \tabularnewline
-128.1834234016 \tabularnewline
-124.857525648953 \tabularnewline
144.245081487889 \tabularnewline
-33.9843225813055 \tabularnewline
-4.73438249281714 \tabularnewline
41.0279920396924 \tabularnewline
-168.188317511245 \tabularnewline
74.1534147184408 \tabularnewline
-73.5544177974975 \tabularnewline
-271.20960942994 \tabularnewline
-18.0115630974356 \tabularnewline
148.942415670184 \tabularnewline
-49.1904916931788 \tabularnewline
-39.7557787838741 \tabularnewline
118.597780596815 \tabularnewline
56.0485655034583 \tabularnewline
44.1213923743076 \tabularnewline
77.9689510246549 \tabularnewline
-107.705051139808 \tabularnewline
132.197695770622 \tabularnewline
-88.2592191800102 \tabularnewline
258.722701983622 \tabularnewline
-73.9202831665354 \tabularnewline
31.3453080491515 \tabularnewline
39.9178166179948 \tabularnewline
16.3637905843268 \tabularnewline
122.076641636584 \tabularnewline
-6.26603341594807 \tabularnewline
147.346892009431 \tabularnewline
33.9832713924069 \tabularnewline
-67.8183280775903 \tabularnewline
108.361984759983 \tabularnewline
-45.9349485419293 \tabularnewline
24.2229810332656 \tabularnewline
-71.4521725911169 \tabularnewline
106.989256022322 \tabularnewline
-172.69105400781 \tabularnewline
109.915074501684 \tabularnewline
-10.0466135709024 \tabularnewline
208.481149511854 \tabularnewline
195.180390832494 \tabularnewline
-193.121391112393 \tabularnewline
54.3092086390445 \tabularnewline
84.0804593627755 \tabularnewline
-64.4754630166586 \tabularnewline
75.7158204563683 \tabularnewline
61.4511806732566 \tabularnewline
353.820888629087 \tabularnewline
96.0398037408722 \tabularnewline
-239.514259631545 \tabularnewline
-199.436898053251 \tabularnewline
77.1632652831597 \tabularnewline
42.1659067052519 \tabularnewline
202.72169185409 \tabularnewline
55.4132059019441 \tabularnewline
164.403004344487 \tabularnewline
96.4631034546516 \tabularnewline
120.617281721723 \tabularnewline
-269.480743214817 \tabularnewline
-25.3967543770269 \tabularnewline
134.286535819089 \tabularnewline
-123.911061246731 \tabularnewline
-73.5475689068195 \tabularnewline
144.863185303808 \tabularnewline
-92.5615713883846 \tabularnewline
16.7186021952517 \tabularnewline
-11.1837056594035 \tabularnewline
111.587265527246 \tabularnewline
36.6783413271889 \tabularnewline
321.744359622941 \tabularnewline
-273.671753849059 \tabularnewline
-129.836823136105 \tabularnewline
-77.402155878215 \tabularnewline
76.0620132136363 \tabularnewline
121.973957339578 \tabularnewline
19.2653115586233 \tabularnewline
57.8263140279064 \tabularnewline
235.668849873949 \tabularnewline
-187.285824819812 \tabularnewline
-102.179263756264 \tabularnewline
-106.408669879742 \tabularnewline
-313.572837513799 \tabularnewline
47.5314235379046 \tabularnewline
-151.828236524291 \tabularnewline
34.2327004368521 \tabularnewline
-7.14350339932769 \tabularnewline
142.325787838149 \tabularnewline
144.849575486595 \tabularnewline
115.506602723233 \tabularnewline
-2.03289241300995 \tabularnewline
59.9311125901644 \tabularnewline
-22.1777028963716 \tabularnewline
-25.1123171008908 \tabularnewline
-51.9779474281907 \tabularnewline
-25.6578381808113 \tabularnewline
82.9353342164121 \tabularnewline
-47.9696502726693 \tabularnewline
90.3714564052563 \tabularnewline
22.6070697101337 \tabularnewline
3.21030633417861 \tabularnewline
\hline
\end{tabular}
%Source: https://freestatistics.org/blog/index.php?pk=302959&T=2

[TABLE]
[ROW][C]Estimated ARIMA Residuals[/C][/ROW]
[ROW][C]Value[/C][/ROW]
[ROW][C]4.80092332096904[/C][/ROW]
[ROW][C]-225.325637421572[/C][/ROW]
[ROW][C]-36.8742996257335[/C][/ROW]
[ROW][C]211.002607734092[/C][/ROW]
[ROW][C]-158.687187985867[/C][/ROW]
[ROW][C]75.0575255579736[/C][/ROW]
[ROW][C]142.315174757216[/C][/ROW]
[ROW][C]129.894627173308[/C][/ROW]
[ROW][C]89.12836481156[/C][/ROW]
[ROW][C]2.49257413873191[/C][/ROW]
[ROW][C]-98.6830920127606[/C][/ROW]
[ROW][C]-8.75375642967456[/C][/ROW]
[ROW][C]219.865045759391[/C][/ROW]
[ROW][C]304.220150872716[/C][/ROW]
[ROW][C]-68.2887694412371[/C][/ROW]
[ROW][C]-128.1834234016[/C][/ROW]
[ROW][C]-124.857525648953[/C][/ROW]
[ROW][C]144.245081487889[/C][/ROW]
[ROW][C]-33.9843225813055[/C][/ROW]
[ROW][C]-4.73438249281714[/C][/ROW]
[ROW][C]41.0279920396924[/C][/ROW]
[ROW][C]-168.188317511245[/C][/ROW]
[ROW][C]74.1534147184408[/C][/ROW]
[ROW][C]-73.5544177974975[/C][/ROW]
[ROW][C]-271.20960942994[/C][/ROW]
[ROW][C]-18.0115630974356[/C][/ROW]
[ROW][C]148.942415670184[/C][/ROW]
[ROW][C]-49.1904916931788[/C][/ROW]
[ROW][C]-39.7557787838741[/C][/ROW]
[ROW][C]118.597780596815[/C][/ROW]
[ROW][C]56.0485655034583[/C][/ROW]
[ROW][C]44.1213923743076[/C][/ROW]
[ROW][C]77.9689510246549[/C][/ROW]
[ROW][C]-107.705051139808[/C][/ROW]
[ROW][C]132.197695770622[/C][/ROW]
[ROW][C]-88.2592191800102[/C][/ROW]
[ROW][C]258.722701983622[/C][/ROW]
[ROW][C]-73.9202831665354[/C][/ROW]
[ROW][C]31.3453080491515[/C][/ROW]
[ROW][C]39.9178166179948[/C][/ROW]
[ROW][C]16.3637905843268[/C][/ROW]
[ROW][C]122.076641636584[/C][/ROW]
[ROW][C]-6.26603341594807[/C][/ROW]
[ROW][C]147.346892009431[/C][/ROW]
[ROW][C]33.9832713924069[/C][/ROW]
[ROW][C]-67.8183280775903[/C][/ROW]
[ROW][C]108.361984759983[/C][/ROW]
[ROW][C]-45.9349485419293[/C][/ROW]
[ROW][C]24.2229810332656[/C][/ROW]
[ROW][C]-71.4521725911169[/C][/ROW]
[ROW][C]106.989256022322[/C][/ROW]
[ROW][C]-172.69105400781[/C][/ROW]
[ROW][C]109.915074501684[/C][/ROW]
[ROW][C]-10.0466135709024[/C][/ROW]
[ROW][C]208.481149511854[/C][/ROW]
[ROW][C]195.180390832494[/C][/ROW]
[ROW][C]-193.121391112393[/C][/ROW]
[ROW][C]54.3092086390445[/C][/ROW]
[ROW][C]84.0804593627755[/C][/ROW]
[ROW][C]-64.4754630166586[/C][/ROW]
[ROW][C]75.7158204563683[/C][/ROW]
[ROW][C]61.4511806732566[/C][/ROW]
[ROW][C]353.820888629087[/C][/ROW]
[ROW][C]96.0398037408722[/C][/ROW]
[ROW][C]-239.514259631545[/C][/ROW]
[ROW][C]-199.436898053251[/C][/ROW]
[ROW][C]77.1632652831597[/C][/ROW]
[ROW][C]42.1659067052519[/C][/ROW]
[ROW][C]202.72169185409[/C][/ROW]
[ROW][C]55.4132059019441[/C][/ROW]
[ROW][C]164.403004344487[/C][/ROW]
[ROW][C]96.4631034546516[/C][/ROW]
[ROW][C]120.617281721723[/C][/ROW]
[ROW][C]-269.480743214817[/C][/ROW]
[ROW][C]-25.3967543770269[/C][/ROW]
[ROW][C]134.286535819089[/C][/ROW]
[ROW][C]-123.911061246731[/C][/ROW]
[ROW][C]-73.5475689068195[/C][/ROW]
[ROW][C]144.863185303808[/C][/ROW]
[ROW][C]-92.5615713883846[/C][/ROW]
[ROW][C]16.7186021952517[/C][/ROW]
[ROW][C]-11.1837056594035[/C][/ROW]
[ROW][C]111.587265527246[/C][/ROW]
[ROW][C]36.6783413271889[/C][/ROW]
[ROW][C]321.744359622941[/C][/ROW]
[ROW][C]-273.671753849059[/C][/ROW]
[ROW][C]-129.836823136105[/C][/ROW]
[ROW][C]-77.402155878215[/C][/ROW]
[ROW][C]76.0620132136363[/C][/ROW]
[ROW][C]121.973957339578[/C][/ROW]
[ROW][C]19.2653115586233[/C][/ROW]
[ROW][C]57.8263140279064[/C][/ROW]
[ROW][C]235.668849873949[/C][/ROW]
[ROW][C]-187.285824819812[/C][/ROW]
[ROW][C]-102.179263756264[/C][/ROW]
[ROW][C]-106.408669879742[/C][/ROW]
[ROW][C]-313.572837513799[/C][/ROW]
[ROW][C]47.5314235379046[/C][/ROW]
[ROW][C]-151.828236524291[/C][/ROW]
[ROW][C]34.2327004368521[/C][/ROW]
[ROW][C]-7.14350339932769[/C][/ROW]
[ROW][C]142.325787838149[/C][/ROW]
[ROW][C]144.849575486595[/C][/ROW]
[ROW][C]115.506602723233[/C][/ROW]
[ROW][C]-2.03289241300995[/C][/ROW]
[ROW][C]59.9311125901644[/C][/ROW]
[ROW][C]-22.1777028963716[/C][/ROW]
[ROW][C]-25.1123171008908[/C][/ROW]
[ROW][C]-51.9779474281907[/C][/ROW]
[ROW][C]-25.6578381808113[/C][/ROW]
[ROW][C]82.9353342164121[/C][/ROW]
[ROW][C]-47.9696502726693[/C][/ROW]
[ROW][C]90.3714564052563[/C][/ROW]
[ROW][C]22.6070697101337[/C][/ROW]
[ROW][C]3.21030633417861[/C][/ROW]
[/TABLE]
Source: https://freestatistics.org/blog/index.php?pk=302959&T=2

Globally Unique Identifier (entire table): ba.freestatistics.org/blog/index.php?pk=302959&T=2

As an alternative you can also use a QR Code:  

The GUIDs for individual cells are displayed in the table below:

Estimated ARIMA Residuals
Value
4.80092332096904
-225.325637421572
-36.8742996257335
211.002607734092
-158.687187985867
75.0575255579736
142.315174757216
129.894627173308
89.12836481156
2.49257413873191
-98.6830920127606
-8.75375642967456
219.865045759391
304.220150872716
-68.2887694412371
-128.1834234016
-124.857525648953
144.245081487889
-33.9843225813055
-4.73438249281714
41.0279920396924
-168.188317511245
74.1534147184408
-73.5544177974975
-271.20960942994
-18.0115630974356
148.942415670184
-49.1904916931788
-39.7557787838741
118.597780596815
56.0485655034583
44.1213923743076
77.9689510246549
-107.705051139808
132.197695770622
-88.2592191800102
258.722701983622
-73.9202831665354
31.3453080491515
39.9178166179948
16.3637905843268
122.076641636584
-6.26603341594807
147.346892009431
33.9832713924069
-67.8183280775903
108.361984759983
-45.9349485419293
24.2229810332656
-71.4521725911169
106.989256022322
-172.69105400781
109.915074501684
-10.0466135709024
208.481149511854
195.180390832494
-193.121391112393
54.3092086390445
84.0804593627755
-64.4754630166586
75.7158204563683
61.4511806732566
353.820888629087
96.0398037408722
-239.514259631545
-199.436898053251
77.1632652831597
42.1659067052519
202.72169185409
55.4132059019441
164.403004344487
96.4631034546516
120.617281721723
-269.480743214817
-25.3967543770269
134.286535819089
-123.911061246731
-73.5475689068195
144.863185303808
-92.5615713883846
16.7186021952517
-11.1837056594035
111.587265527246
36.6783413271889
321.744359622941
-273.671753849059
-129.836823136105
-77.402155878215
76.0620132136363
121.973957339578
19.2653115586233
57.8263140279064
235.668849873949
-187.285824819812
-102.179263756264
-106.408669879742
-313.572837513799
47.5314235379046
-151.828236524291
34.2327004368521
-7.14350339932769
142.325787838149
144.849575486595
115.506602723233
-2.03289241300995
59.9311125901644
-22.1777028963716
-25.1123171008908
-51.9779474281907
-25.6578381808113
82.9353342164121
-47.9696502726693
90.3714564052563
22.6070697101337
3.21030633417861


Parameters (Session):
par1 = 60 ; par2 = 1 ; par3 = 1 ; par4 = 1 ; par5 = 12 ; par6 = White Noise ; par7 = 0.95 ;
Parameters (R input):
par1 = FALSE ; par2 = 1 ; par3 = 0 ; par4 = 1 ; par5 = 12 ; par6 = 3 ; par7 = 1 ; par8 = 2 ; par9 = 1 ;
R code (references can be found in the software module):
par9 <- '1'
par8 <- '2'
par7 <- '1'
par6 <- '2'
par5 <- '12'
par4 <- '1'
par3 <- '1'
par2 <- '1'
par1 <- 'FALSE'
library(lattice)
if (par1 == 'TRUE') par1 <- TRUE
if (par1 == 'FALSE') par1 <- FALSE
par2 <- as.numeric(par2) #Box-Cox lambda transformation parameter
par3 <- as.numeric(par3) #degree of non-seasonal differencing
par4 <- as.numeric(par4) #degree of seasonal differencing
par5 <- as.numeric(par5) #seasonal period
par6 <- as.numeric(par6) #degree (p) of the non-seasonal AR(p) polynomial
par7 <- as.numeric(par7) #degree (q) of the non-seasonal MA(q) polynomial
par8 <- as.numeric(par8) #degree (P) of the seasonal AR(P) polynomial
par9 <- as.numeric(par9) #degree (Q) of the seasonal MA(Q) polynomial
armaGR <- function(arima.out, names, n){
try1 <- arima.out$coef
try2 <- sqrt(diag(arima.out$var.coef))
try.data.frame <- data.frame(matrix(NA,ncol=4,nrow=length(names)))
dimnames(try.data.frame) <- list(names,c('coef','std','tstat','pv'))
try.data.frame[,1] <- try1
for(i in 1:length(try2)) try.data.frame[which(rownames(try.data.frame)==names(try2)[i]),2] <- try2[i]
try.data.frame[,3] <- try.data.frame[,1] / try.data.frame[,2]
try.data.frame[,4] <- round((1-pt(abs(try.data.frame[,3]),df=n-(length(try2)+1)))*2,5)
vector <- rep(NA,length(names))
vector[is.na(try.data.frame[,4])] <- 0
maxi <- which.max(try.data.frame[,4])
continue <- max(try.data.frame[,4],na.rm=TRUE) > .05
vector[maxi] <- 0
list(summary=try.data.frame,next.vector=vector,continue=continue)
}
arimaSelect <- function(series, order=c(13,0,0), seasonal=list(order=c(2,0,0),period=12), include.mean=F){
nrc <- order[1]+order[3]+seasonal$order[1]+seasonal$order[3]
coeff <- matrix(NA, nrow=nrc*2, ncol=nrc)
pval <- matrix(NA, nrow=nrc*2, ncol=nrc)
mylist <- rep(list(NULL), nrc)
names <- NULL
if(order[1] > 0) names <- paste('ar',1:order[1],sep='')
if(order[3] > 0) names <- c( names , paste('ma',1:order[3],sep='') )
if(seasonal$order[1] > 0) names <- c(names, paste('sar',1:seasonal$order[1],sep=''))
if(seasonal$order[3] > 0) names <- c(names, paste('sma',1:seasonal$order[3],sep=''))
arima.out <- arima(series, order=order, seasonal=seasonal, include.mean=include.mean, method='ML')
mylist[[1]] <- arima.out
last.arma <- armaGR(arima.out, names, length(series))
mystop <- FALSE
i <- 1
coeff[i,] <- last.arma[[1]][,1]
pval [i,] <- last.arma[[1]][,4]
i <- 2
aic <- arima.out$aic
while(!mystop){
mylist[[i]] <- arima.out
arima.out <- arima(series, order=order, seasonal=seasonal, include.mean=include.mean, method='ML', fixed=last.arma$next.vector)
aic <- c(aic, arima.out$aic)
last.arma <- armaGR(arima.out, names, length(series))
mystop <- !last.arma$continue
coeff[i,] <- last.arma[[1]][,1]
pval [i,] <- last.arma[[1]][,4]
i <- i+1
}
list(coeff, pval, mylist, aic=aic)
}
arimaSelectplot <- function(arimaSelect.out,noms,choix){
noms <- names(arimaSelect.out[[3]][[1]]$coef)
coeff <- arimaSelect.out[[1]]
k <- min(which(is.na(coeff[,1])))-1
coeff <- coeff[1:k,]
pval <- arimaSelect.out[[2]][1:k,]
aic <- arimaSelect.out$aic[1:k]
coeff[coeff==0] <- NA
n <- ncol(coeff)
if(missing(choix)) choix <- k
layout(matrix(c(1,1,1,2,
3,3,3,2,
3,3,3,4,
5,6,7,7),nr=4),
widths=c(10,35,45,15),
heights=c(30,30,15,15))
couleurs <- rainbow(75)[1:50]#(50)
ticks <- pretty(coeff)
par(mar=c(1,1,3,1))
plot(aic,k:1-.5,type='o',pch=21,bg='blue',cex=2,axes=F,lty=2,xpd=NA)
points(aic[choix],k-choix+.5,pch=21,cex=4,bg=2,xpd=NA)
title('aic',line=2)
par(mar=c(3,0,0,0))
plot(0,axes=F,xlab='',ylab='',xlim=range(ticks),ylim=c(.1,1))
rect(xleft = min(ticks) + (0:49)/50*(max(ticks)-min(ticks)),
xright = min(ticks) + (1:50)/50*(max(ticks)-min(ticks)),
ytop = rep(1,50),
ybottom= rep(0,50),col=couleurs,border=NA)
axis(1,ticks)
rect(xleft=min(ticks),xright=max(ticks),ytop=1,ybottom=0)
text(mean(coeff,na.rm=T),.5,'coefficients',cex=2,font=2)
par(mar=c(1,1,3,1))
image(1:n,1:k,t(coeff[k:1,]),axes=F,col=couleurs,zlim=range(ticks))
for(i in 1:n) for(j in 1:k) if(!is.na(coeff[j,i])) {
if(pval[j,i]<.01) symb = 'green'
else if( (pval[j,i]<.05) & (pval[j,i]>=.01)) symb = 'orange'
else if( (pval[j,i]<.1) & (pval[j,i]>=.05)) symb = 'red'
else symb = 'black'
polygon(c(i+.5 ,i+.2 ,i+.5 ,i+.5),
c(k-j+0.5,k-j+0.5,k-j+0.8,k-j+0.5),
col=symb)
if(j==choix) {
rect(xleft=i-.5,
xright=i+.5,
ybottom=k-j+1.5,
ytop=k-j+.5,
lwd=4)
text(i,
k-j+1,
round(coeff[j,i],2),
cex=1.2,
font=2)
}
else{
rect(xleft=i-.5,xright=i+.5,ybottom=k-j+1.5,ytop=k-j+.5)
text(i,k-j+1,round(coeff[j,i],2),cex=1.2,font=1)
}
}
axis(3,1:n,noms)
par(mar=c(0.5,0,0,0.5))
plot(0,axes=F,xlab='',ylab='',type='n',xlim=c(0,8),ylim=c(-.2,.8))
cols <- c('green','orange','red','black')
niv <- c('0','0.01','0.05','0.1')
for(i in 0:3){
polygon(c(1+2*i ,1+2*i ,1+2*i-.5 ,1+2*i),
c(.4 ,.7 , .4 , .4),
col=cols[i+1])
text(2*i,0.5,niv[i+1],cex=1.5)
}
text(8,.5,1,cex=1.5)
text(4,0,'p-value',cex=2)
box()
residus <- arimaSelect.out[[3]][[choix]]$res
par(mar=c(1,2,4,1))
acf(residus,main='')
title('acf',line=.5)
par(mar=c(1,2,4,1))
pacf(residus,main='')
title('pacf',line=.5)
par(mar=c(2,2,4,1))
qqnorm(residus,main='')
title('qq-norm',line=.5)
qqline(residus)
residus
}
if (par2 == 0) x <- log(x)
if (par2 != 0) x <- x^par2
(selection <- arimaSelect(x, order=c(par6,par3,par7), seasonal=list(order=c(par8,par4,par9), period=par5)))
bitmap(file='test1.png')
resid <- arimaSelectplot(selection)
dev.off()
resid
bitmap(file='test2.png')
acf(resid,length(resid)/2, main='Residual Autocorrelation Function')
dev.off()
bitmap(file='test3.png')
pacf(resid,length(resid)/2, main='Residual Partial Autocorrelation Function')
dev.off()
bitmap(file='test4.png')
cpgram(resid, main='Residual Cumulative Periodogram')
dev.off()
bitmap(file='test5.png')
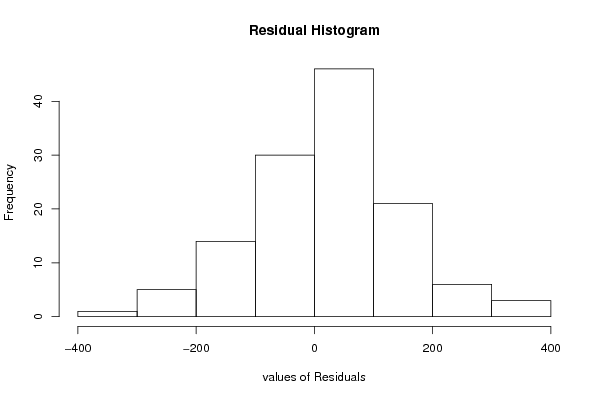
hist(resid, main='Residual Histogram', xlab='values of Residuals')
dev.off()
bitmap(file='test6.png')
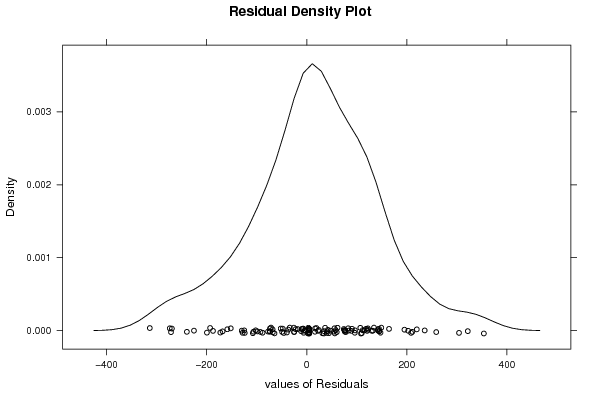
densityplot(~resid,col='black',main='Residual Density Plot', xlab='values of Residuals')
dev.off()
bitmap(file='test7.png')
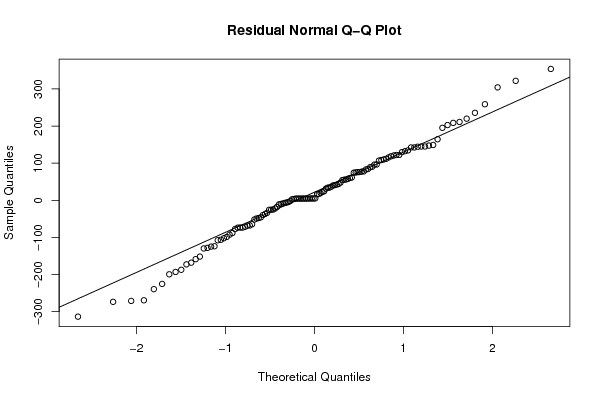
qqnorm(resid, main='Residual Normal Q-Q Plot')
qqline(resid)
dev.off()
ncols <- length(selection[[1]][1,])
nrows <- length(selection[[2]][,1])-1
load(file='createtable')
a<-table.start()
a<-table.row.start(a)
a<-table.element(a,'ARIMA Parameter Estimation and Backward Selection', ncols+1,TRUE)
a<-table.row.end(a)
a<-table.row.start(a)
a<-table.element(a,'Iteration', header=TRUE)
for (i in 1:ncols) {
a<-table.element(a,names(selection[[3]][[1]]$coef)[i],header=TRUE)
}
a<-table.row.end(a)
for (j in 1:nrows) {
a<-table.row.start(a)
mydum <- 'Estimates ('
mydum <- paste(mydum,j)
mydum <- paste(mydum,')')
a<-table.element(a,mydum, header=TRUE)
for (i in 1:ncols) {
a<-table.element(a,round(selection[[1]][j,i],4))
}
a<-table.row.end(a)
a<-table.row.start(a)
a<-table.element(a,'(p-val)', header=TRUE)
for (i in 1:ncols) {
mydum <- '('
mydum <- paste(mydum,round(selection[[2]][j,i],4),sep='')
mydum <- paste(mydum,')')
a<-table.element(a,mydum)
}
a<-table.row.end(a)
}
a<-table.end(a)
table.save(a,file='mytable.tab')
a<-table.start()
a<-table.row.start(a)
a<-table.element(a,'Estimated ARIMA Residuals', 1,TRUE)
a<-table.row.end(a)
a<-table.row.start(a)
a<-table.element(a,'Value', 1,TRUE)
a<-table.row.end(a)
for (i in (par4*par5+par3):length(resid)) {
a<-table.row.start(a)
a<-table.element(a,resid[i])
a<-table.row.end(a)
}
a<-table.end(a)
table.save(a,file='mytable1.tab')