Free Statistics

of Irreproducible Research!

Author's title

Author*The author of this computation has been verified*
R Software Modulerwasp_autocorrelation.wasp
Title produced by software(Partial) Autocorrelation Function
Date of computationFri, 23 Dec 2016 14:55:20 +0100
Cite this page as followsStatistical Computations at FreeStatistics.org, Office for Research Development and Education, URL https://freestatistics.org/blog/index.php?v=date/2016/Dec/23/t1482501348k5bdxk170yixv84.htm/, Retrieved Fri, 01 Nov 2024 03:36:42 +0000
Statistical Computations at FreeStatistics.org, Office for Research Development and Education, URL https://freestatistics.org/blog/index.php?pk=302953, Retrieved Fri, 01 Nov 2024 03:36:42 +0000
QR Codes:

Original text written by user:
IsPrivate?No (this computation is public)
User-defined keywords
Estimated Impact107
Family? (F = Feedback message, R = changed R code, M = changed R Module, P = changed Parameters, D = changed Data)
-       [(Partial) Autocorrelation Function] [] [2016-12-23 13:55:20] [c6ea875f0603e0876d03f43aca979571] [Current]
Feedback Forum

Post a new message
Dataseries X:
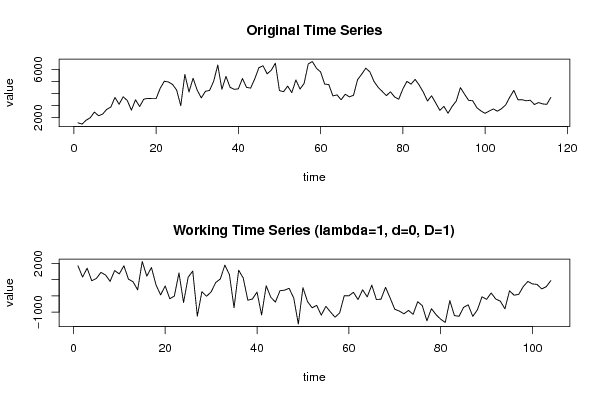
1565
1460
1780
1990
2460
2155
2290
2685
2880
3680
3110
3735
3420
2620
3485
2920
3530
3600
3580
3580
4440
5030
4965
4765
4290
2990
5600
4135
5280
4275
3640
4190
4260
5020
6380
4355
5435
4520
4350
4395
5255
4515
4460
5230
6155
6320
5645
5940
6530
4250
4155
4625
4075
5135
4375
4845
6470
6670
6110
5805
4790
4750
3805
3890
3485
3945
3730
3850
5155
5615
6120
5805
5010
4520
4180
3825
4145
3720
3525
4375
5020
4790
5180
4700
4110
3380
3820
3220
2605
2930
2360
2935
3380
4495
3960
3440
3400
2825
2555
2355
2545
2715
2535
2740
3050
3695
4270
3480
3490
3400
3445
3090
3250
3140
3100
3680


Summary of computational transaction
Raw Input view raw input (R code)
Raw Outputview raw output of R engine
Computing time1 seconds
R ServerBig Analytics Cloud Computing Center

\begin{tabular}{lllllllll}
\hline
Summary of computational transaction \tabularnewline
Raw Input view raw input (R code)  \tabularnewline
Raw Outputview raw output of R engine  \tabularnewline
Computing time1 seconds \tabularnewline
R ServerBig Analytics Cloud Computing Center \tabularnewline
\hline
\end{tabular}
%Source: https://freestatistics.org/blog/index.php?pk=302953&T=0

[TABLE]
[ROW]
Summary of computational transaction[/C][/ROW] [ROW]Raw Input[/C] view raw input (R code) [/C][/ROW] [ROW]Raw Output[/C]view raw output of R engine [/C][/ROW] [ROW]Computing time[/C]1 seconds[/C][/ROW] [ROW]R Server[/C]Big Analytics Cloud Computing Center[/C][/ROW] [/TABLE] Source: https://freestatistics.org/blog/index.php?pk=302953&T=0

Globally Unique Identifier (entire table): ba.freestatistics.org/blog/index.php?pk=302953&T=0

As an alternative you can also use a QR Code:  

The GUIDs for individual cells are displayed in the table below:

Summary of computational transaction
Raw Input view raw input (R code)
Raw Outputview raw output of R engine
Computing time1 seconds
R ServerBig Analytics Cloud Computing Center


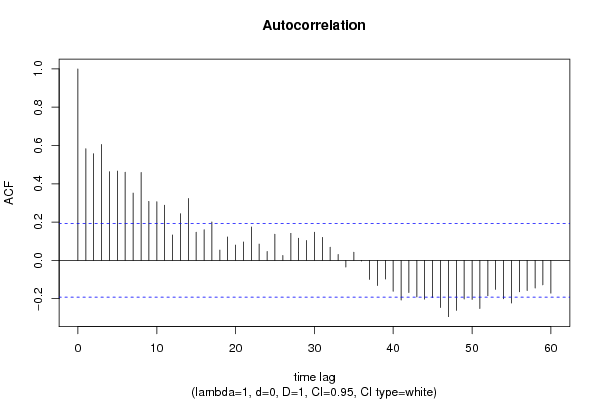
Autocorrelation Function
Time lag kACF(k)T-STATP-value
10.583285.94830
20.5574495.68490
30.6050076.16990
40.4629134.72084e-06
50.4664614.7573e-06
60.4601444.69264e-06
70.3514193.58380.000259
80.459444.68544e-06
90.3081833.14290.00109
100.30633.12370.001157
110.2882412.93950.002025
120.1323571.34980.090008
130.2434562.48280.007318
140.3229333.29330.000677
150.1474721.50390.067815
160.1601181.63290.052758
170.2007142.04690.021595
180.0536420.5470.292762
190.1219151.24330.108278
200.0798830.81460.208567
210.0962330.98140.164339
220.174371.77820.039144
230.0851980.86890.193465
240.0469530.47880.316533
250.1369561.39670.082741
260.0259410.26450.395943
270.1413691.44170.076197
280.1158821.18180.119997
290.103861.05920.145988
300.1474661.50390.067824
310.12011.22480.111713
320.069060.70430.241419
330.0312690.31890.375229
34-0.034243-0.34920.363817
350.0424830.43320.332868
36-0.003367-0.03430.486336
37-0.09902-1.00980.157466
38-0.130885-1.33480.092433
39-0.097349-0.99280.161563
40-0.161464-1.64660.051327
41-0.206778-2.10870.018685
42-0.167628-1.70950.045172
43-0.190527-1.9430.02736
44-0.202509-2.06520.020696
45-0.193945-1.97790.025295
46-0.246234-2.51110.006787
47-0.293843-2.99660.001707
48-0.260998-2.66170.004505
49-0.201759-2.05750.021068
50-0.203638-2.07670.020147
51-0.250947-2.55920.005966
52-0.184106-1.87750.031625
53-0.151599-1.5460.06257
54-0.200554-2.04530.021677
55-0.222194-2.26590.012763
56-0.163849-1.67090.048871
57-0.157086-1.6020.056098
58-0.144599-1.47460.071666
59-0.12772-1.30250.097813
60-0.171193-1.74580.041897

\begin{tabular}{lllllllll}
\hline
Autocorrelation Function \tabularnewline
Time lag k & ACF(k) & T-STAT & P-value \tabularnewline
1 & 0.58328 & 5.9483 & 0 \tabularnewline
2 & 0.557449 & 5.6849 & 0 \tabularnewline
3 & 0.605007 & 6.1699 & 0 \tabularnewline
4 & 0.462913 & 4.7208 & 4e-06 \tabularnewline
5 & 0.466461 & 4.757 & 3e-06 \tabularnewline
6 & 0.460144 & 4.6926 & 4e-06 \tabularnewline
7 & 0.351419 & 3.5838 & 0.000259 \tabularnewline
8 & 0.45944 & 4.6854 & 4e-06 \tabularnewline
9 & 0.308183 & 3.1429 & 0.00109 \tabularnewline
10 & 0.3063 & 3.1237 & 0.001157 \tabularnewline
11 & 0.288241 & 2.9395 & 0.002025 \tabularnewline
12 & 0.132357 & 1.3498 & 0.090008 \tabularnewline
13 & 0.243456 & 2.4828 & 0.007318 \tabularnewline
14 & 0.322933 & 3.2933 & 0.000677 \tabularnewline
15 & 0.147472 & 1.5039 & 0.067815 \tabularnewline
16 & 0.160118 & 1.6329 & 0.052758 \tabularnewline
17 & 0.200714 & 2.0469 & 0.021595 \tabularnewline
18 & 0.053642 & 0.547 & 0.292762 \tabularnewline
19 & 0.121915 & 1.2433 & 0.108278 \tabularnewline
20 & 0.079883 & 0.8146 & 0.208567 \tabularnewline
21 & 0.096233 & 0.9814 & 0.164339 \tabularnewline
22 & 0.17437 & 1.7782 & 0.039144 \tabularnewline
23 & 0.085198 & 0.8689 & 0.193465 \tabularnewline
24 & 0.046953 & 0.4788 & 0.316533 \tabularnewline
25 & 0.136956 & 1.3967 & 0.082741 \tabularnewline
26 & 0.025941 & 0.2645 & 0.395943 \tabularnewline
27 & 0.141369 & 1.4417 & 0.076197 \tabularnewline
28 & 0.115882 & 1.1818 & 0.119997 \tabularnewline
29 & 0.10386 & 1.0592 & 0.145988 \tabularnewline
30 & 0.147466 & 1.5039 & 0.067824 \tabularnewline
31 & 0.1201 & 1.2248 & 0.111713 \tabularnewline
32 & 0.06906 & 0.7043 & 0.241419 \tabularnewline
33 & 0.031269 & 0.3189 & 0.375229 \tabularnewline
34 & -0.034243 & -0.3492 & 0.363817 \tabularnewline
35 & 0.042483 & 0.4332 & 0.332868 \tabularnewline
36 & -0.003367 & -0.0343 & 0.486336 \tabularnewline
37 & -0.09902 & -1.0098 & 0.157466 \tabularnewline
38 & -0.130885 & -1.3348 & 0.092433 \tabularnewline
39 & -0.097349 & -0.9928 & 0.161563 \tabularnewline
40 & -0.161464 & -1.6466 & 0.051327 \tabularnewline
41 & -0.206778 & -2.1087 & 0.018685 \tabularnewline
42 & -0.167628 & -1.7095 & 0.045172 \tabularnewline
43 & -0.190527 & -1.943 & 0.02736 \tabularnewline
44 & -0.202509 & -2.0652 & 0.020696 \tabularnewline
45 & -0.193945 & -1.9779 & 0.025295 \tabularnewline
46 & -0.246234 & -2.5111 & 0.006787 \tabularnewline
47 & -0.293843 & -2.9966 & 0.001707 \tabularnewline
48 & -0.260998 & -2.6617 & 0.004505 \tabularnewline
49 & -0.201759 & -2.0575 & 0.021068 \tabularnewline
50 & -0.203638 & -2.0767 & 0.020147 \tabularnewline
51 & -0.250947 & -2.5592 & 0.005966 \tabularnewline
52 & -0.184106 & -1.8775 & 0.031625 \tabularnewline
53 & -0.151599 & -1.546 & 0.06257 \tabularnewline
54 & -0.200554 & -2.0453 & 0.021677 \tabularnewline
55 & -0.222194 & -2.2659 & 0.012763 \tabularnewline
56 & -0.163849 & -1.6709 & 0.048871 \tabularnewline
57 & -0.157086 & -1.602 & 0.056098 \tabularnewline
58 & -0.144599 & -1.4746 & 0.071666 \tabularnewline
59 & -0.12772 & -1.3025 & 0.097813 \tabularnewline
60 & -0.171193 & -1.7458 & 0.041897 \tabularnewline
\hline
\end{tabular}
%Source: https://freestatistics.org/blog/index.php?pk=302953&T=1

[TABLE]
[ROW][C]Autocorrelation Function[/C][/ROW]
[ROW][C]Time lag k[/C][C]ACF(k)[/C][C]T-STAT[/C][C]P-value[/C][/ROW]
[ROW][C]1[/C][C]0.58328[/C][C]5.9483[/C][C]0[/C][/ROW]
[ROW][C]2[/C][C]0.557449[/C][C]5.6849[/C][C]0[/C][/ROW]
[ROW][C]3[/C][C]0.605007[/C][C]6.1699[/C][C]0[/C][/ROW]
[ROW][C]4[/C][C]0.462913[/C][C]4.7208[/C][C]4e-06[/C][/ROW]
[ROW][C]5[/C][C]0.466461[/C][C]4.757[/C][C]3e-06[/C][/ROW]
[ROW][C]6[/C][C]0.460144[/C][C]4.6926[/C][C]4e-06[/C][/ROW]
[ROW][C]7[/C][C]0.351419[/C][C]3.5838[/C][C]0.000259[/C][/ROW]
[ROW][C]8[/C][C]0.45944[/C][C]4.6854[/C][C]4e-06[/C][/ROW]
[ROW][C]9[/C][C]0.308183[/C][C]3.1429[/C][C]0.00109[/C][/ROW]
[ROW][C]10[/C][C]0.3063[/C][C]3.1237[/C][C]0.001157[/C][/ROW]
[ROW][C]11[/C][C]0.288241[/C][C]2.9395[/C][C]0.002025[/C][/ROW]
[ROW][C]12[/C][C]0.132357[/C][C]1.3498[/C][C]0.090008[/C][/ROW]
[ROW][C]13[/C][C]0.243456[/C][C]2.4828[/C][C]0.007318[/C][/ROW]
[ROW][C]14[/C][C]0.322933[/C][C]3.2933[/C][C]0.000677[/C][/ROW]
[ROW][C]15[/C][C]0.147472[/C][C]1.5039[/C][C]0.067815[/C][/ROW]
[ROW][C]16[/C][C]0.160118[/C][C]1.6329[/C][C]0.052758[/C][/ROW]
[ROW][C]17[/C][C]0.200714[/C][C]2.0469[/C][C]0.021595[/C][/ROW]
[ROW][C]18[/C][C]0.053642[/C][C]0.547[/C][C]0.292762[/C][/ROW]
[ROW][C]19[/C][C]0.121915[/C][C]1.2433[/C][C]0.108278[/C][/ROW]
[ROW][C]20[/C][C]0.079883[/C][C]0.8146[/C][C]0.208567[/C][/ROW]
[ROW][C]21[/C][C]0.096233[/C][C]0.9814[/C][C]0.164339[/C][/ROW]
[ROW][C]22[/C][C]0.17437[/C][C]1.7782[/C][C]0.039144[/C][/ROW]
[ROW][C]23[/C][C]0.085198[/C][C]0.8689[/C][C]0.193465[/C][/ROW]
[ROW][C]24[/C][C]0.046953[/C][C]0.4788[/C][C]0.316533[/C][/ROW]
[ROW][C]25[/C][C]0.136956[/C][C]1.3967[/C][C]0.082741[/C][/ROW]
[ROW][C]26[/C][C]0.025941[/C][C]0.2645[/C][C]0.395943[/C][/ROW]
[ROW][C]27[/C][C]0.141369[/C][C]1.4417[/C][C]0.076197[/C][/ROW]
[ROW][C]28[/C][C]0.115882[/C][C]1.1818[/C][C]0.119997[/C][/ROW]
[ROW][C]29[/C][C]0.10386[/C][C]1.0592[/C][C]0.145988[/C][/ROW]
[ROW][C]30[/C][C]0.147466[/C][C]1.5039[/C][C]0.067824[/C][/ROW]
[ROW][C]31[/C][C]0.1201[/C][C]1.2248[/C][C]0.111713[/C][/ROW]
[ROW][C]32[/C][C]0.06906[/C][C]0.7043[/C][C]0.241419[/C][/ROW]
[ROW][C]33[/C][C]0.031269[/C][C]0.3189[/C][C]0.375229[/C][/ROW]
[ROW][C]34[/C][C]-0.034243[/C][C]-0.3492[/C][C]0.363817[/C][/ROW]
[ROW][C]35[/C][C]0.042483[/C][C]0.4332[/C][C]0.332868[/C][/ROW]
[ROW][C]36[/C][C]-0.003367[/C][C]-0.0343[/C][C]0.486336[/C][/ROW]
[ROW][C]37[/C][C]-0.09902[/C][C]-1.0098[/C][C]0.157466[/C][/ROW]
[ROW][C]38[/C][C]-0.130885[/C][C]-1.3348[/C][C]0.092433[/C][/ROW]
[ROW][C]39[/C][C]-0.097349[/C][C]-0.9928[/C][C]0.161563[/C][/ROW]
[ROW][C]40[/C][C]-0.161464[/C][C]-1.6466[/C][C]0.051327[/C][/ROW]
[ROW][C]41[/C][C]-0.206778[/C][C]-2.1087[/C][C]0.018685[/C][/ROW]
[ROW][C]42[/C][C]-0.167628[/C][C]-1.7095[/C][C]0.045172[/C][/ROW]
[ROW][C]43[/C][C]-0.190527[/C][C]-1.943[/C][C]0.02736[/C][/ROW]
[ROW][C]44[/C][C]-0.202509[/C][C]-2.0652[/C][C]0.020696[/C][/ROW]
[ROW][C]45[/C][C]-0.193945[/C][C]-1.9779[/C][C]0.025295[/C][/ROW]
[ROW][C]46[/C][C]-0.246234[/C][C]-2.5111[/C][C]0.006787[/C][/ROW]
[ROW][C]47[/C][C]-0.293843[/C][C]-2.9966[/C][C]0.001707[/C][/ROW]
[ROW][C]48[/C][C]-0.260998[/C][C]-2.6617[/C][C]0.004505[/C][/ROW]
[ROW][C]49[/C][C]-0.201759[/C][C]-2.0575[/C][C]0.021068[/C][/ROW]
[ROW][C]50[/C][C]-0.203638[/C][C]-2.0767[/C][C]0.020147[/C][/ROW]
[ROW][C]51[/C][C]-0.250947[/C][C]-2.5592[/C][C]0.005966[/C][/ROW]
[ROW][C]52[/C][C]-0.184106[/C][C]-1.8775[/C][C]0.031625[/C][/ROW]
[ROW][C]53[/C][C]-0.151599[/C][C]-1.546[/C][C]0.06257[/C][/ROW]
[ROW][C]54[/C][C]-0.200554[/C][C]-2.0453[/C][C]0.021677[/C][/ROW]
[ROW][C]55[/C][C]-0.222194[/C][C]-2.2659[/C][C]0.012763[/C][/ROW]
[ROW][C]56[/C][C]-0.163849[/C][C]-1.6709[/C][C]0.048871[/C][/ROW]
[ROW][C]57[/C][C]-0.157086[/C][C]-1.602[/C][C]0.056098[/C][/ROW]
[ROW][C]58[/C][C]-0.144599[/C][C]-1.4746[/C][C]0.071666[/C][/ROW]
[ROW][C]59[/C][C]-0.12772[/C][C]-1.3025[/C][C]0.097813[/C][/ROW]
[ROW][C]60[/C][C]-0.171193[/C][C]-1.7458[/C][C]0.041897[/C][/ROW]
[/TABLE]
Source: https://freestatistics.org/blog/index.php?pk=302953&T=1

Globally Unique Identifier (entire table): ba.freestatistics.org/blog/index.php?pk=302953&T=1

As an alternative you can also use a QR Code:  

The GUIDs for individual cells are displayed in the table below:

Autocorrelation Function
Time lag kACF(k)T-STATP-value
10.583285.94830
20.5574495.68490
30.6050076.16990
40.4629134.72084e-06
50.4664614.7573e-06
60.4601444.69264e-06
70.3514193.58380.000259
80.459444.68544e-06
90.3081833.14290.00109
100.30633.12370.001157
110.2882412.93950.002025
120.1323571.34980.090008
130.2434562.48280.007318
140.3229333.29330.000677
150.1474721.50390.067815
160.1601181.63290.052758
170.2007142.04690.021595
180.0536420.5470.292762
190.1219151.24330.108278
200.0798830.81460.208567
210.0962330.98140.164339
220.174371.77820.039144
230.0851980.86890.193465
240.0469530.47880.316533
250.1369561.39670.082741
260.0259410.26450.395943
270.1413691.44170.076197
280.1158821.18180.119997
290.103861.05920.145988
300.1474661.50390.067824
310.12011.22480.111713
320.069060.70430.241419
330.0312690.31890.375229
34-0.034243-0.34920.363817
350.0424830.43320.332868
36-0.003367-0.03430.486336
37-0.09902-1.00980.157466
38-0.130885-1.33480.092433
39-0.097349-0.99280.161563
40-0.161464-1.64660.051327
41-0.206778-2.10870.018685
42-0.167628-1.70950.045172
43-0.190527-1.9430.02736
44-0.202509-2.06520.020696
45-0.193945-1.97790.025295
46-0.246234-2.51110.006787
47-0.293843-2.99660.001707
48-0.260998-2.66170.004505
49-0.201759-2.05750.021068
50-0.203638-2.07670.020147
51-0.250947-2.55920.005966
52-0.184106-1.87750.031625
53-0.151599-1.5460.06257
54-0.200554-2.04530.021677
55-0.222194-2.26590.012763
56-0.163849-1.67090.048871
57-0.157086-1.6020.056098
58-0.144599-1.47460.071666
59-0.12772-1.30250.097813
60-0.171193-1.74580.041897


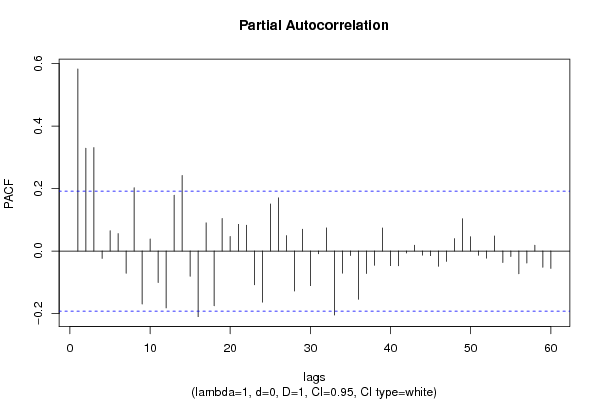
Partial Autocorrelation Function
Time lag kPACF(k)T-STATP-value
10.583285.94830
20.3292483.35770.000549
30.3312623.37820.000514
4-0.023511-0.23980.405493
50.0648860.66170.25481
60.0557860.56890.285324
7-0.071223-0.72630.234631
80.2028392.06860.020534
9-0.169944-1.73310.043021
100.0384480.39210.347897
11-0.100838-1.02830.153086
12-0.182171-1.85780.033014
130.1785071.82040.035785
140.2421672.46960.007576
15-0.080597-0.82190.206497
16-0.210259-2.14420.017172
170.0902940.92080.179637
18-0.175604-1.79080.038116
190.1043891.06460.144769
200.0463910.47310.318566
210.0854870.87180.192663
220.0824450.84080.201201
23-0.108194-1.10340.136206
24-0.163839-1.67080.04888
250.1504371.53420.064014
260.170251.73620.042743
270.0494090.50390.307706
28-0.128006-1.30540.097317
290.0698910.71280.238797
30-0.110928-1.13120.130276
31-0.0088-0.08970.464331
320.0740770.75540.225847
33-0.204775-2.08830.019606
34-0.070758-0.72160.236083
35-0.014355-0.14640.441946
36-0.154471-1.57530.059112
37-0.071875-0.7330.232607
38-0.045399-0.4630.322171
390.0735740.75030.227382
40-0.046746-0.47670.317283
41-0.047054-0.47990.316169
42-0.006124-0.06250.47516
430.0187650.19140.424306
44-0.013121-0.13380.446907
45-0.014834-0.15130.440023
46-0.04891-0.49880.309491
47-0.033196-0.33850.367823
480.0396180.4040.343513
490.1034351.05480.146973
500.0457660.46670.320836
51-0.013528-0.1380.445269
52-0.022838-0.23290.408147
530.0484160.49380.311261
54-0.036701-0.37430.354481
55-0.017527-0.17870.429245
56-0.073072-0.74520.228918
57-0.038328-0.39090.348348
580.0183350.1870.426021
59-0.05202-0.53050.298449
60-0.055625-0.56730.285877

\begin{tabular}{lllllllll}
\hline
Partial Autocorrelation Function \tabularnewline
Time lag k & PACF(k) & T-STAT & P-value \tabularnewline
1 & 0.58328 & 5.9483 & 0 \tabularnewline
2 & 0.329248 & 3.3577 & 0.000549 \tabularnewline
3 & 0.331262 & 3.3782 & 0.000514 \tabularnewline
4 & -0.023511 & -0.2398 & 0.405493 \tabularnewline
5 & 0.064886 & 0.6617 & 0.25481 \tabularnewline
6 & 0.055786 & 0.5689 & 0.285324 \tabularnewline
7 & -0.071223 & -0.7263 & 0.234631 \tabularnewline
8 & 0.202839 & 2.0686 & 0.020534 \tabularnewline
9 & -0.169944 & -1.7331 & 0.043021 \tabularnewline
10 & 0.038448 & 0.3921 & 0.347897 \tabularnewline
11 & -0.100838 & -1.0283 & 0.153086 \tabularnewline
12 & -0.182171 & -1.8578 & 0.033014 \tabularnewline
13 & 0.178507 & 1.8204 & 0.035785 \tabularnewline
14 & 0.242167 & 2.4696 & 0.007576 \tabularnewline
15 & -0.080597 & -0.8219 & 0.206497 \tabularnewline
16 & -0.210259 & -2.1442 & 0.017172 \tabularnewline
17 & 0.090294 & 0.9208 & 0.179637 \tabularnewline
18 & -0.175604 & -1.7908 & 0.038116 \tabularnewline
19 & 0.104389 & 1.0646 & 0.144769 \tabularnewline
20 & 0.046391 & 0.4731 & 0.318566 \tabularnewline
21 & 0.085487 & 0.8718 & 0.192663 \tabularnewline
22 & 0.082445 & 0.8408 & 0.201201 \tabularnewline
23 & -0.108194 & -1.1034 & 0.136206 \tabularnewline
24 & -0.163839 & -1.6708 & 0.04888 \tabularnewline
25 & 0.150437 & 1.5342 & 0.064014 \tabularnewline
26 & 0.17025 & 1.7362 & 0.042743 \tabularnewline
27 & 0.049409 & 0.5039 & 0.307706 \tabularnewline
28 & -0.128006 & -1.3054 & 0.097317 \tabularnewline
29 & 0.069891 & 0.7128 & 0.238797 \tabularnewline
30 & -0.110928 & -1.1312 & 0.130276 \tabularnewline
31 & -0.0088 & -0.0897 & 0.464331 \tabularnewline
32 & 0.074077 & 0.7554 & 0.225847 \tabularnewline
33 & -0.204775 & -2.0883 & 0.019606 \tabularnewline
34 & -0.070758 & -0.7216 & 0.236083 \tabularnewline
35 & -0.014355 & -0.1464 & 0.441946 \tabularnewline
36 & -0.154471 & -1.5753 & 0.059112 \tabularnewline
37 & -0.071875 & -0.733 & 0.232607 \tabularnewline
38 & -0.045399 & -0.463 & 0.322171 \tabularnewline
39 & 0.073574 & 0.7503 & 0.227382 \tabularnewline
40 & -0.046746 & -0.4767 & 0.317283 \tabularnewline
41 & -0.047054 & -0.4799 & 0.316169 \tabularnewline
42 & -0.006124 & -0.0625 & 0.47516 \tabularnewline
43 & 0.018765 & 0.1914 & 0.424306 \tabularnewline
44 & -0.013121 & -0.1338 & 0.446907 \tabularnewline
45 & -0.014834 & -0.1513 & 0.440023 \tabularnewline
46 & -0.04891 & -0.4988 & 0.309491 \tabularnewline
47 & -0.033196 & -0.3385 & 0.367823 \tabularnewline
48 & 0.039618 & 0.404 & 0.343513 \tabularnewline
49 & 0.103435 & 1.0548 & 0.146973 \tabularnewline
50 & 0.045766 & 0.4667 & 0.320836 \tabularnewline
51 & -0.013528 & -0.138 & 0.445269 \tabularnewline
52 & -0.022838 & -0.2329 & 0.408147 \tabularnewline
53 & 0.048416 & 0.4938 & 0.311261 \tabularnewline
54 & -0.036701 & -0.3743 & 0.354481 \tabularnewline
55 & -0.017527 & -0.1787 & 0.429245 \tabularnewline
56 & -0.073072 & -0.7452 & 0.228918 \tabularnewline
57 & -0.038328 & -0.3909 & 0.348348 \tabularnewline
58 & 0.018335 & 0.187 & 0.426021 \tabularnewline
59 & -0.05202 & -0.5305 & 0.298449 \tabularnewline
60 & -0.055625 & -0.5673 & 0.285877 \tabularnewline
\hline
\end{tabular}
%Source: https://freestatistics.org/blog/index.php?pk=302953&T=2

[TABLE]
[ROW][C]Partial Autocorrelation Function[/C][/ROW]
[ROW][C]Time lag k[/C][C]PACF(k)[/C][C]T-STAT[/C][C]P-value[/C][/ROW]
[ROW][C]1[/C][C]0.58328[/C][C]5.9483[/C][C]0[/C][/ROW]
[ROW][C]2[/C][C]0.329248[/C][C]3.3577[/C][C]0.000549[/C][/ROW]
[ROW][C]3[/C][C]0.331262[/C][C]3.3782[/C][C]0.000514[/C][/ROW]
[ROW][C]4[/C][C]-0.023511[/C][C]-0.2398[/C][C]0.405493[/C][/ROW]
[ROW][C]5[/C][C]0.064886[/C][C]0.6617[/C][C]0.25481[/C][/ROW]
[ROW][C]6[/C][C]0.055786[/C][C]0.5689[/C][C]0.285324[/C][/ROW]
[ROW][C]7[/C][C]-0.071223[/C][C]-0.7263[/C][C]0.234631[/C][/ROW]
[ROW][C]8[/C][C]0.202839[/C][C]2.0686[/C][C]0.020534[/C][/ROW]
[ROW][C]9[/C][C]-0.169944[/C][C]-1.7331[/C][C]0.043021[/C][/ROW]
[ROW][C]10[/C][C]0.038448[/C][C]0.3921[/C][C]0.347897[/C][/ROW]
[ROW][C]11[/C][C]-0.100838[/C][C]-1.0283[/C][C]0.153086[/C][/ROW]
[ROW][C]12[/C][C]-0.182171[/C][C]-1.8578[/C][C]0.033014[/C][/ROW]
[ROW][C]13[/C][C]0.178507[/C][C]1.8204[/C][C]0.035785[/C][/ROW]
[ROW][C]14[/C][C]0.242167[/C][C]2.4696[/C][C]0.007576[/C][/ROW]
[ROW][C]15[/C][C]-0.080597[/C][C]-0.8219[/C][C]0.206497[/C][/ROW]
[ROW][C]16[/C][C]-0.210259[/C][C]-2.1442[/C][C]0.017172[/C][/ROW]
[ROW][C]17[/C][C]0.090294[/C][C]0.9208[/C][C]0.179637[/C][/ROW]
[ROW][C]18[/C][C]-0.175604[/C][C]-1.7908[/C][C]0.038116[/C][/ROW]
[ROW][C]19[/C][C]0.104389[/C][C]1.0646[/C][C]0.144769[/C][/ROW]
[ROW][C]20[/C][C]0.046391[/C][C]0.4731[/C][C]0.318566[/C][/ROW]
[ROW][C]21[/C][C]0.085487[/C][C]0.8718[/C][C]0.192663[/C][/ROW]
[ROW][C]22[/C][C]0.082445[/C][C]0.8408[/C][C]0.201201[/C][/ROW]
[ROW][C]23[/C][C]-0.108194[/C][C]-1.1034[/C][C]0.136206[/C][/ROW]
[ROW][C]24[/C][C]-0.163839[/C][C]-1.6708[/C][C]0.04888[/C][/ROW]
[ROW][C]25[/C][C]0.150437[/C][C]1.5342[/C][C]0.064014[/C][/ROW]
[ROW][C]26[/C][C]0.17025[/C][C]1.7362[/C][C]0.042743[/C][/ROW]
[ROW][C]27[/C][C]0.049409[/C][C]0.5039[/C][C]0.307706[/C][/ROW]
[ROW][C]28[/C][C]-0.128006[/C][C]-1.3054[/C][C]0.097317[/C][/ROW]
[ROW][C]29[/C][C]0.069891[/C][C]0.7128[/C][C]0.238797[/C][/ROW]
[ROW][C]30[/C][C]-0.110928[/C][C]-1.1312[/C][C]0.130276[/C][/ROW]
[ROW][C]31[/C][C]-0.0088[/C][C]-0.0897[/C][C]0.464331[/C][/ROW]
[ROW][C]32[/C][C]0.074077[/C][C]0.7554[/C][C]0.225847[/C][/ROW]
[ROW][C]33[/C][C]-0.204775[/C][C]-2.0883[/C][C]0.019606[/C][/ROW]
[ROW][C]34[/C][C]-0.070758[/C][C]-0.7216[/C][C]0.236083[/C][/ROW]
[ROW][C]35[/C][C]-0.014355[/C][C]-0.1464[/C][C]0.441946[/C][/ROW]
[ROW][C]36[/C][C]-0.154471[/C][C]-1.5753[/C][C]0.059112[/C][/ROW]
[ROW][C]37[/C][C]-0.071875[/C][C]-0.733[/C][C]0.232607[/C][/ROW]
[ROW][C]38[/C][C]-0.045399[/C][C]-0.463[/C][C]0.322171[/C][/ROW]
[ROW][C]39[/C][C]0.073574[/C][C]0.7503[/C][C]0.227382[/C][/ROW]
[ROW][C]40[/C][C]-0.046746[/C][C]-0.4767[/C][C]0.317283[/C][/ROW]
[ROW][C]41[/C][C]-0.047054[/C][C]-0.4799[/C][C]0.316169[/C][/ROW]
[ROW][C]42[/C][C]-0.006124[/C][C]-0.0625[/C][C]0.47516[/C][/ROW]
[ROW][C]43[/C][C]0.018765[/C][C]0.1914[/C][C]0.424306[/C][/ROW]
[ROW][C]44[/C][C]-0.013121[/C][C]-0.1338[/C][C]0.446907[/C][/ROW]
[ROW][C]45[/C][C]-0.014834[/C][C]-0.1513[/C][C]0.440023[/C][/ROW]
[ROW][C]46[/C][C]-0.04891[/C][C]-0.4988[/C][C]0.309491[/C][/ROW]
[ROW][C]47[/C][C]-0.033196[/C][C]-0.3385[/C][C]0.367823[/C][/ROW]
[ROW][C]48[/C][C]0.039618[/C][C]0.404[/C][C]0.343513[/C][/ROW]
[ROW][C]49[/C][C]0.103435[/C][C]1.0548[/C][C]0.146973[/C][/ROW]
[ROW][C]50[/C][C]0.045766[/C][C]0.4667[/C][C]0.320836[/C][/ROW]
[ROW][C]51[/C][C]-0.013528[/C][C]-0.138[/C][C]0.445269[/C][/ROW]
[ROW][C]52[/C][C]-0.022838[/C][C]-0.2329[/C][C]0.408147[/C][/ROW]
[ROW][C]53[/C][C]0.048416[/C][C]0.4938[/C][C]0.311261[/C][/ROW]
[ROW][C]54[/C][C]-0.036701[/C][C]-0.3743[/C][C]0.354481[/C][/ROW]
[ROW][C]55[/C][C]-0.017527[/C][C]-0.1787[/C][C]0.429245[/C][/ROW]
[ROW][C]56[/C][C]-0.073072[/C][C]-0.7452[/C][C]0.228918[/C][/ROW]
[ROW][C]57[/C][C]-0.038328[/C][C]-0.3909[/C][C]0.348348[/C][/ROW]
[ROW][C]58[/C][C]0.018335[/C][C]0.187[/C][C]0.426021[/C][/ROW]
[ROW][C]59[/C][C]-0.05202[/C][C]-0.5305[/C][C]0.298449[/C][/ROW]
[ROW][C]60[/C][C]-0.055625[/C][C]-0.5673[/C][C]0.285877[/C][/ROW]
[/TABLE]
Source: https://freestatistics.org/blog/index.php?pk=302953&T=2

Globally Unique Identifier (entire table): ba.freestatistics.org/blog/index.php?pk=302953&T=2

As an alternative you can also use a QR Code:  

The GUIDs for individual cells are displayed in the table below:

Partial Autocorrelation Function
Time lag kPACF(k)T-STATP-value
10.583285.94830
20.3292483.35770.000549
30.3312623.37820.000514
4-0.023511-0.23980.405493
50.0648860.66170.25481
60.0557860.56890.285324
7-0.071223-0.72630.234631
80.2028392.06860.020534
9-0.169944-1.73310.043021
100.0384480.39210.347897
11-0.100838-1.02830.153086
12-0.182171-1.85780.033014
130.1785071.82040.035785
140.2421672.46960.007576
15-0.080597-0.82190.206497
16-0.210259-2.14420.017172
170.0902940.92080.179637
18-0.175604-1.79080.038116
190.1043891.06460.144769
200.0463910.47310.318566
210.0854870.87180.192663
220.0824450.84080.201201
23-0.108194-1.10340.136206
24-0.163839-1.67080.04888
250.1504371.53420.064014
260.170251.73620.042743
270.0494090.50390.307706
28-0.128006-1.30540.097317
290.0698910.71280.238797
30-0.110928-1.13120.130276
31-0.0088-0.08970.464331
320.0740770.75540.225847
33-0.204775-2.08830.019606
34-0.070758-0.72160.236083
35-0.014355-0.14640.441946
36-0.154471-1.57530.059112
37-0.071875-0.7330.232607
38-0.045399-0.4630.322171
390.0735740.75030.227382
40-0.046746-0.47670.317283
41-0.047054-0.47990.316169
42-0.006124-0.06250.47516
430.0187650.19140.424306
44-0.013121-0.13380.446907
45-0.014834-0.15130.440023
46-0.04891-0.49880.309491
47-0.033196-0.33850.367823
480.0396180.4040.343513
490.1034351.05480.146973
500.0457660.46670.320836
51-0.013528-0.1380.445269
52-0.022838-0.23290.408147
530.0484160.49380.311261
54-0.036701-0.37430.354481
55-0.017527-0.17870.429245
56-0.073072-0.74520.228918
57-0.038328-0.39090.348348
580.0183350.1870.426021
59-0.05202-0.53050.298449
60-0.055625-0.56730.285877


Parameters (Session):
par2 = grey ; par3 = FALSE ; par4 = 5-point Likert ;
Parameters (R input):
par1 = 60 ; par2 = 1 ; par3 = 0 ; par4 = 1 ; par5 = 12 ; par6 = White Noise ; par7 = 0.95 ; par8 = ;
R code (references can be found in the software module):
par8 <- ''
par7 <- '0,95'
par6 <- 'White Noise'
par5 <- '12'
par4 <- '1'
par3 <- '0'
par2 <- '1'
par1 <- '60'
if (par1 == 'Default') {
par1 = 10*log10(length(x))
} else {
par1 <- as.numeric(par1)
}
par2 <- as.numeric(par2)
par3 <- as.numeric(par3)
par4 <- as.numeric(par4)
par5 <- as.numeric(par5)
if (par6 == 'White Noise') par6 <- 'white' else par6 <- 'ma'
par7 <- as.numeric(par7)
if (par8 != '') par8 <- as.numeric(par8)
x <- na.omit(x)
ox <- x
if (par8 == '') {
if (par2 == 0) {
x <- log(x)
} else {
x <- (x ^ par2 - 1) / par2
}
} else {
x <- log(x,base=par8)
}
if (par3 > 0) x <- diff(x,lag=1,difference=par3)
if (par4 > 0) x <- diff(x,lag=par5,difference=par4)
bitmap(file='picts.png')
op <- par(mfrow=c(2,1))
plot(ox,type='l',main='Original Time Series',xlab='time',ylab='value')
if (par8=='') {
mytitle <- paste('Working Time Series (lambda=',par2,', d=',par3,', D=',par4,')',sep='')
mysub <- paste('(lambda=',par2,', d=',par3,', D=',par4,', CI=', par7, ', CI type=',par6,')',sep='')
} else {
mytitle <- paste('Working Time Series (base=',par8,', d=',par3,', D=',par4,')',sep='')
mysub <- paste('(base=',par8,', d=',par3,', D=',par4,', CI=', par7, ', CI type=',par6,')',sep='')
}
plot(x,type='l', main=mytitle,xlab='time',ylab='value')
par(op)
dev.off()
bitmap(file='pic1.png')
racf <- acf(x, par1, main='Autocorrelation', xlab='time lag', ylab='ACF', ci.type=par6, ci=par7, sub=mysub)
dev.off()
bitmap(file='pic2.png')
rpacf <- pacf(x,par1,main='Partial Autocorrelation',xlab='lags',ylab='PACF',sub=mysub)
dev.off()
(myacf <- c(racf$acf))
(mypacf <- c(rpacf$acf))
lengthx <- length(x)
sqrtn <- sqrt(lengthx)
load(file='createtable')
a<-table.start()
a<-table.row.start(a)
a<-table.element(a,'Autocorrelation Function',4,TRUE)
a<-table.row.end(a)
a<-table.row.start(a)
a<-table.element(a,'Time lag k',header=TRUE)
a<-table.element(a,'ACF(k)',header=TRUE)
a<-table.element(a,'T-STAT',header=TRUE)
a<-table.element(a,'P-value',header=TRUE)
a<-table.row.end(a)
for (i in 2:(par1+1)) {
a<-table.row.start(a)
a<-table.element(a,i-1,header=TRUE)
a<-table.element(a,round(myacf[i],6))
mytstat <- myacf[i]*sqrtn
a<-table.element(a,round(mytstat,4))
a<-table.element(a,round(1-pt(abs(mytstat),lengthx),6))
a<-table.row.end(a)
}
a<-table.end(a)
table.save(a,file='mytable.tab')
a<-table.start()
a<-table.row.start(a)
a<-table.element(a,'Partial Autocorrelation Function',4,TRUE)
a<-table.row.end(a)
a<-table.row.start(a)
a<-table.element(a,'Time lag k',header=TRUE)
a<-table.element(a,'PACF(k)',header=TRUE)
a<-table.element(a,'T-STAT',header=TRUE)
a<-table.element(a,'P-value',header=TRUE)
a<-table.row.end(a)
for (i in 1:par1) {
a<-table.row.start(a)
a<-table.element(a,i,header=TRUE)
a<-table.element(a,round(mypacf[i],6))
mytstat <- mypacf[i]*sqrtn
a<-table.element(a,round(mytstat,4))
a<-table.element(a,round(1-pt(abs(mytstat),lengthx),6))
a<-table.row.end(a)
}
a<-table.end(a)
table.save(a,file='mytable1.tab')