Free Statistics

of Irreproducible Research!

Author's title

Author*The author of this computation has been verified*
R Software Modulerwasp_autocorrelation.wasp
Title produced by software(Partial) Autocorrelation Function
Date of computationFri, 23 Dec 2016 10:36:09 +0100
Cite this page as followsStatistical Computations at FreeStatistics.org, Office for Research Development and Education, URL https://freestatistics.org/blog/index.php?v=date/2016/Dec/23/t1482485784q0w46dihlz3fnd2.htm/, Retrieved Fri, 01 Nov 2024 03:29:47 +0000
Statistical Computations at FreeStatistics.org, Office for Research Development and Education, URL https://freestatistics.org/blog/index.php?pk=302818, Retrieved Fri, 01 Nov 2024 03:29:47 +0000
QR Codes:

Original text written by user:
IsPrivate?No (this computation is public)
User-defined keywords
Estimated Impact104
Family? (F = Feedback message, R = changed R code, M = changed R Module, P = changed Parameters, D = changed Data)
-       [(Partial) Autocorrelation Function] [ACF N2583] [2016-12-23 09:36:09] [11b61e09f442d73f657668491c17a736] [Current]
Feedback Forum

Post a new message
Dataseries X:
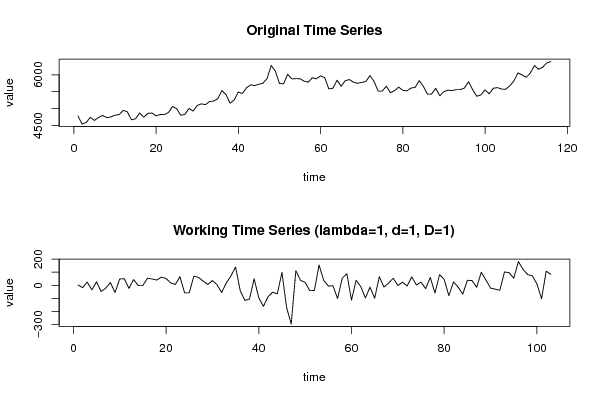
4782
4540
4588
4740
4646
4736
4794
4730
4752
4804
4818
4948
4906
4666
4696
4872
4742
4858
4868
4782
4824
4820
4882
5062
4996
4800
4828
5002
4926
5090
5140
5116
5210
5224
5292
5538
5414
5160
5258
5492
5448
5618
5704
5684
5722
5754
5894
6280
6114
5744
5736
6020
5880
5888
5886
5812
5784
5914
5884
5972
5918
5586
5600
5842
5662
5826
5862
5782
5750
5778
5802
5978
5810
5516
5520
5664
5470
5534
5636
5542
5526
5608
5630
5830
5656
5426
5432
5600
5380
5504
5546
5534
5562
5564
5612
5798
5556
5364
5406
5558
5438
5602
5622
5580
5570
5674
5818
6058
5998
5928
6052
6276
6166
6226
6354
6396


Summary of computational transaction
Raw Input view raw input (R code)
Raw Outputview raw output of R engine
Computing time1 seconds
R ServerBig Analytics Cloud Computing Center

\begin{tabular}{lllllllll}
\hline
Summary of computational transaction \tabularnewline
Raw Input view raw input (R code)  \tabularnewline
Raw Outputview raw output of R engine  \tabularnewline
Computing time1 seconds \tabularnewline
R ServerBig Analytics Cloud Computing Center \tabularnewline
\hline
\end{tabular}
%Source: https://freestatistics.org/blog/index.php?pk=302818&T=0

[TABLE]
[ROW]
Summary of computational transaction[/C][/ROW] [ROW]Raw Input[/C] view raw input (R code) [/C][/ROW] [ROW]Raw Output[/C]view raw output of R engine [/C][/ROW] [ROW]Computing time[/C]1 seconds[/C][/ROW] [ROW]R Server[/C]Big Analytics Cloud Computing Center[/C][/ROW] [/TABLE] Source: https://freestatistics.org/blog/index.php?pk=302818&T=0

Globally Unique Identifier (entire table): ba.freestatistics.org/blog/index.php?pk=302818&T=0

As an alternative you can also use a QR Code:  

The GUIDs for individual cells are displayed in the table below:

Summary of computational transaction
Raw Input view raw input (R code)
Raw Outputview raw output of R engine
Computing time1 seconds
R ServerBig Analytics Cloud Computing Center


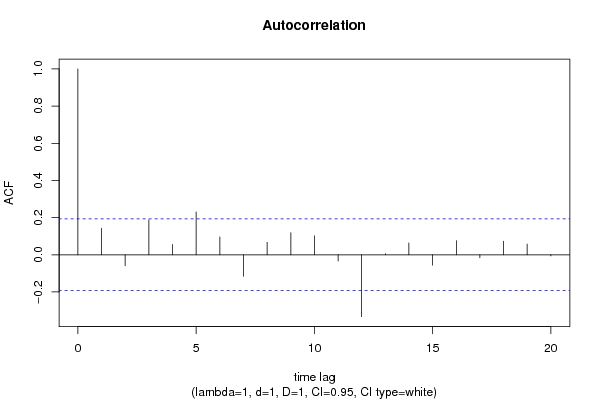
Autocorrelation Function
Time lag kACF(k)T-STATP-value
10.1431911.45320.074601
2-0.058745-0.59620.276176
30.188031.90830.029569
40.0554580.56280.287385
50.230642.34070.010586
60.0962930.97730.165363
7-0.115337-1.17050.122242
80.0668720.67870.249432
90.1190381.20810.114887
100.1020741.03590.151328
11-0.033444-0.33940.367492
12-0.332672-3.37620.000519
130.0060060.0610.475756
140.0632970.64240.261021
15-0.05551-0.56340.287206
160.0753710.76490.22303
17-0.015842-0.16080.436291
180.0734730.74570.228782
190.0576760.58530.279798
20-0.005882-0.05970.476255

\begin{tabular}{lllllllll}
\hline
Autocorrelation Function \tabularnewline
Time lag k & ACF(k) & T-STAT & P-value \tabularnewline
1 & 0.143191 & 1.4532 & 0.074601 \tabularnewline
2 & -0.058745 & -0.5962 & 0.276176 \tabularnewline
3 & 0.18803 & 1.9083 & 0.029569 \tabularnewline
4 & 0.055458 & 0.5628 & 0.287385 \tabularnewline
5 & 0.23064 & 2.3407 & 0.010586 \tabularnewline
6 & 0.096293 & 0.9773 & 0.165363 \tabularnewline
7 & -0.115337 & -1.1705 & 0.122242 \tabularnewline
8 & 0.066872 & 0.6787 & 0.249432 \tabularnewline
9 & 0.119038 & 1.2081 & 0.114887 \tabularnewline
10 & 0.102074 & 1.0359 & 0.151328 \tabularnewline
11 & -0.033444 & -0.3394 & 0.367492 \tabularnewline
12 & -0.332672 & -3.3762 & 0.000519 \tabularnewline
13 & 0.006006 & 0.061 & 0.475756 \tabularnewline
14 & 0.063297 & 0.6424 & 0.261021 \tabularnewline
15 & -0.05551 & -0.5634 & 0.287206 \tabularnewline
16 & 0.075371 & 0.7649 & 0.22303 \tabularnewline
17 & -0.015842 & -0.1608 & 0.436291 \tabularnewline
18 & 0.073473 & 0.7457 & 0.228782 \tabularnewline
19 & 0.057676 & 0.5853 & 0.279798 \tabularnewline
20 & -0.005882 & -0.0597 & 0.476255 \tabularnewline
\hline
\end{tabular}
%Source: https://freestatistics.org/blog/index.php?pk=302818&T=1

[TABLE]
[ROW][C]Autocorrelation Function[/C][/ROW]
[ROW][C]Time lag k[/C][C]ACF(k)[/C][C]T-STAT[/C][C]P-value[/C][/ROW]
[ROW][C]1[/C][C]0.143191[/C][C]1.4532[/C][C]0.074601[/C][/ROW]
[ROW][C]2[/C][C]-0.058745[/C][C]-0.5962[/C][C]0.276176[/C][/ROW]
[ROW][C]3[/C][C]0.18803[/C][C]1.9083[/C][C]0.029569[/C][/ROW]
[ROW][C]4[/C][C]0.055458[/C][C]0.5628[/C][C]0.287385[/C][/ROW]
[ROW][C]5[/C][C]0.23064[/C][C]2.3407[/C][C]0.010586[/C][/ROW]
[ROW][C]6[/C][C]0.096293[/C][C]0.9773[/C][C]0.165363[/C][/ROW]
[ROW][C]7[/C][C]-0.115337[/C][C]-1.1705[/C][C]0.122242[/C][/ROW]
[ROW][C]8[/C][C]0.066872[/C][C]0.6787[/C][C]0.249432[/C][/ROW]
[ROW][C]9[/C][C]0.119038[/C][C]1.2081[/C][C]0.114887[/C][/ROW]
[ROW][C]10[/C][C]0.102074[/C][C]1.0359[/C][C]0.151328[/C][/ROW]
[ROW][C]11[/C][C]-0.033444[/C][C]-0.3394[/C][C]0.367492[/C][/ROW]
[ROW][C]12[/C][C]-0.332672[/C][C]-3.3762[/C][C]0.000519[/C][/ROW]
[ROW][C]13[/C][C]0.006006[/C][C]0.061[/C][C]0.475756[/C][/ROW]
[ROW][C]14[/C][C]0.063297[/C][C]0.6424[/C][C]0.261021[/C][/ROW]
[ROW][C]15[/C][C]-0.05551[/C][C]-0.5634[/C][C]0.287206[/C][/ROW]
[ROW][C]16[/C][C]0.075371[/C][C]0.7649[/C][C]0.22303[/C][/ROW]
[ROW][C]17[/C][C]-0.015842[/C][C]-0.1608[/C][C]0.436291[/C][/ROW]
[ROW][C]18[/C][C]0.073473[/C][C]0.7457[/C][C]0.228782[/C][/ROW]
[ROW][C]19[/C][C]0.057676[/C][C]0.5853[/C][C]0.279798[/C][/ROW]
[ROW][C]20[/C][C]-0.005882[/C][C]-0.0597[/C][C]0.476255[/C][/ROW]
[/TABLE]
Source: https://freestatistics.org/blog/index.php?pk=302818&T=1

Globally Unique Identifier (entire table): ba.freestatistics.org/blog/index.php?pk=302818&T=1

As an alternative you can also use a QR Code:  

The GUIDs for individual cells are displayed in the table below:

Autocorrelation Function
Time lag kACF(k)T-STATP-value
10.1431911.45320.074601
2-0.058745-0.59620.276176
30.188031.90830.029569
40.0554580.56280.287385
50.230642.34070.010586
60.0962930.97730.165363
7-0.115337-1.17050.122242
80.0668720.67870.249432
90.1190381.20810.114887
100.1020741.03590.151328
11-0.033444-0.33940.367492
12-0.332672-3.37620.000519
130.0060060.0610.475756
140.0632970.64240.261021
15-0.05551-0.56340.287206
160.0753710.76490.22303
17-0.015842-0.16080.436291
180.0734730.74570.228782
190.0576760.58530.279798
20-0.005882-0.05970.476255


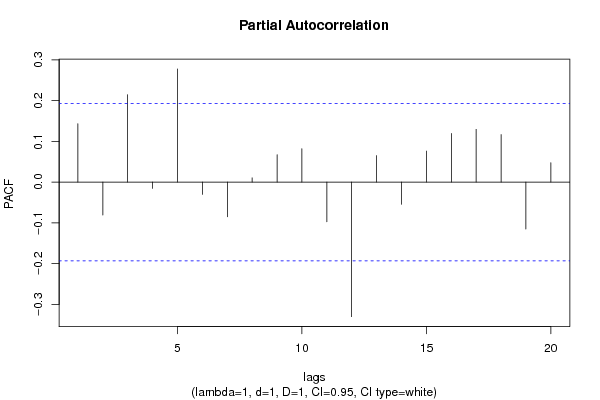
Partial Autocorrelation Function
Time lag kPACF(k)T-STATP-value
10.1431911.45320.074601
2-0.080907-0.82110.206737
30.214482.17670.015892
4-0.015428-0.15660.437943
50.2776222.81760.002901
6-0.030103-0.30550.380295
7-0.084862-0.86130.195548
80.010380.10530.458152
90.0669320.67930.249239
100.0818320.83050.204086
11-0.09754-0.98990.162266
12-0.330179-3.35090.000563
130.0649890.65960.255501
14-0.054313-0.55120.29134
150.075990.77120.221172
160.1194261.2120.114134
170.1293271.31250.09613
180.1164871.18220.119922
19-0.115197-1.16910.122527
200.0473960.4810.315762

\begin{tabular}{lllllllll}
\hline
Partial Autocorrelation Function \tabularnewline
Time lag k & PACF(k) & T-STAT & P-value \tabularnewline
1 & 0.143191 & 1.4532 & 0.074601 \tabularnewline
2 & -0.080907 & -0.8211 & 0.206737 \tabularnewline
3 & 0.21448 & 2.1767 & 0.015892 \tabularnewline
4 & -0.015428 & -0.1566 & 0.437943 \tabularnewline
5 & 0.277622 & 2.8176 & 0.002901 \tabularnewline
6 & -0.030103 & -0.3055 & 0.380295 \tabularnewline
7 & -0.084862 & -0.8613 & 0.195548 \tabularnewline
8 & 0.01038 & 0.1053 & 0.458152 \tabularnewline
9 & 0.066932 & 0.6793 & 0.249239 \tabularnewline
10 & 0.081832 & 0.8305 & 0.204086 \tabularnewline
11 & -0.09754 & -0.9899 & 0.162266 \tabularnewline
12 & -0.330179 & -3.3509 & 0.000563 \tabularnewline
13 & 0.064989 & 0.6596 & 0.255501 \tabularnewline
14 & -0.054313 & -0.5512 & 0.29134 \tabularnewline
15 & 0.07599 & 0.7712 & 0.221172 \tabularnewline
16 & 0.119426 & 1.212 & 0.114134 \tabularnewline
17 & 0.129327 & 1.3125 & 0.09613 \tabularnewline
18 & 0.116487 & 1.1822 & 0.119922 \tabularnewline
19 & -0.115197 & -1.1691 & 0.122527 \tabularnewline
20 & 0.047396 & 0.481 & 0.315762 \tabularnewline
\hline
\end{tabular}
%Source: https://freestatistics.org/blog/index.php?pk=302818&T=2

[TABLE]
[ROW][C]Partial Autocorrelation Function[/C][/ROW]
[ROW][C]Time lag k[/C][C]PACF(k)[/C][C]T-STAT[/C][C]P-value[/C][/ROW]
[ROW][C]1[/C][C]0.143191[/C][C]1.4532[/C][C]0.074601[/C][/ROW]
[ROW][C]2[/C][C]-0.080907[/C][C]-0.8211[/C][C]0.206737[/C][/ROW]
[ROW][C]3[/C][C]0.21448[/C][C]2.1767[/C][C]0.015892[/C][/ROW]
[ROW][C]4[/C][C]-0.015428[/C][C]-0.1566[/C][C]0.437943[/C][/ROW]
[ROW][C]5[/C][C]0.277622[/C][C]2.8176[/C][C]0.002901[/C][/ROW]
[ROW][C]6[/C][C]-0.030103[/C][C]-0.3055[/C][C]0.380295[/C][/ROW]
[ROW][C]7[/C][C]-0.084862[/C][C]-0.8613[/C][C]0.195548[/C][/ROW]
[ROW][C]8[/C][C]0.01038[/C][C]0.1053[/C][C]0.458152[/C][/ROW]
[ROW][C]9[/C][C]0.066932[/C][C]0.6793[/C][C]0.249239[/C][/ROW]
[ROW][C]10[/C][C]0.081832[/C][C]0.8305[/C][C]0.204086[/C][/ROW]
[ROW][C]11[/C][C]-0.09754[/C][C]-0.9899[/C][C]0.162266[/C][/ROW]
[ROW][C]12[/C][C]-0.330179[/C][C]-3.3509[/C][C]0.000563[/C][/ROW]
[ROW][C]13[/C][C]0.064989[/C][C]0.6596[/C][C]0.255501[/C][/ROW]
[ROW][C]14[/C][C]-0.054313[/C][C]-0.5512[/C][C]0.29134[/C][/ROW]
[ROW][C]15[/C][C]0.07599[/C][C]0.7712[/C][C]0.221172[/C][/ROW]
[ROW][C]16[/C][C]0.119426[/C][C]1.212[/C][C]0.114134[/C][/ROW]
[ROW][C]17[/C][C]0.129327[/C][C]1.3125[/C][C]0.09613[/C][/ROW]
[ROW][C]18[/C][C]0.116487[/C][C]1.1822[/C][C]0.119922[/C][/ROW]
[ROW][C]19[/C][C]-0.115197[/C][C]-1.1691[/C][C]0.122527[/C][/ROW]
[ROW][C]20[/C][C]0.047396[/C][C]0.481[/C][C]0.315762[/C][/ROW]
[/TABLE]
Source: https://freestatistics.org/blog/index.php?pk=302818&T=2

Globally Unique Identifier (entire table): ba.freestatistics.org/blog/index.php?pk=302818&T=2

As an alternative you can also use a QR Code:  

The GUIDs for individual cells are displayed in the table below:

Partial Autocorrelation Function
Time lag kPACF(k)T-STATP-value
10.1431911.45320.074601
2-0.080907-0.82110.206737
30.214482.17670.015892
4-0.015428-0.15660.437943
50.2776222.81760.002901
6-0.030103-0.30550.380295
7-0.084862-0.86130.195548
80.010380.10530.458152
90.0669320.67930.249239
100.0818320.83050.204086
11-0.09754-0.98990.162266
12-0.330179-3.35090.000563
130.0649890.65960.255501
14-0.054313-0.55120.29134
150.075990.77120.221172
160.1194261.2120.114134
170.1293271.31250.09613
180.1164871.18220.119922
19-0.115197-1.16910.122527
200.0473960.4810.315762


Parameters (Session):
par1 = 12 ;
Parameters (R input):
par1 = Default ; par2 = 1 ; par3 = 1 ; par4 = 1 ; par5 = 12 ; par6 = White Noise ; par7 = 0.95 ; par8 = ;
R code (references can be found in the software module):
if (par1 == 'Default') {
par1 = 10*log10(length(x))
} else {
par1 <- as.numeric(par1)
}
par2 <- as.numeric(par2)
par3 <- as.numeric(par3)
par4 <- as.numeric(par4)
par5 <- as.numeric(par5)
if (par6 == 'White Noise') par6 <- 'white' else par6 <- 'ma'
par7 <- as.numeric(par7)
if (par8 != '') par8 <- as.numeric(par8)
x <- na.omit(x)
ox <- x
if (par8 == '') {
if (par2 == 0) {
x <- log(x)
} else {
x <- (x ^ par2 - 1) / par2
}
} else {
x <- log(x,base=par8)
}
if (par3 > 0) x <- diff(x,lag=1,difference=par3)
if (par4 > 0) x <- diff(x,lag=par5,difference=par4)
bitmap(file='picts.png')
op <- par(mfrow=c(2,1))
plot(ox,type='l',main='Original Time Series',xlab='time',ylab='value')
if (par8=='') {
mytitle <- paste('Working Time Series (lambda=',par2,', d=',par3,', D=',par4,')',sep='')
mysub <- paste('(lambda=',par2,', d=',par3,', D=',par4,', CI=', par7, ', CI type=',par6,')',sep='')
} else {
mytitle <- paste('Working Time Series (base=',par8,', d=',par3,', D=',par4,')',sep='')
mysub <- paste('(base=',par8,', d=',par3,', D=',par4,', CI=', par7, ', CI type=',par6,')',sep='')
}
plot(x,type='l', main=mytitle,xlab='time',ylab='value')
par(op)
dev.off()
bitmap(file='pic1.png')
racf <- acf(x, par1, main='Autocorrelation', xlab='time lag', ylab='ACF', ci.type=par6, ci=par7, sub=mysub)
dev.off()
bitmap(file='pic2.png')
rpacf <- pacf(x,par1,main='Partial Autocorrelation',xlab='lags',ylab='PACF',sub=mysub)
dev.off()
(myacf <- c(racf$acf))
(mypacf <- c(rpacf$acf))
lengthx <- length(x)
sqrtn <- sqrt(lengthx)
load(file='createtable')
a<-table.start()
a<-table.row.start(a)
a<-table.element(a,'Autocorrelation Function',4,TRUE)
a<-table.row.end(a)
a<-table.row.start(a)
a<-table.element(a,'Time lag k',header=TRUE)
a<-table.element(a,'ACF(k)',header=TRUE)
a<-table.element(a,'T-STAT',header=TRUE)
a<-table.element(a,'P-value',header=TRUE)
a<-table.row.end(a)
for (i in 2:(par1+1)) {
a<-table.row.start(a)
a<-table.element(a,i-1,header=TRUE)
a<-table.element(a,round(myacf[i],6))
mytstat <- myacf[i]*sqrtn
a<-table.element(a,round(mytstat,4))
a<-table.element(a,round(1-pt(abs(mytstat),lengthx),6))
a<-table.row.end(a)
}
a<-table.end(a)
table.save(a,file='mytable.tab')
a<-table.start()
a<-table.row.start(a)
a<-table.element(a,'Partial Autocorrelation Function',4,TRUE)
a<-table.row.end(a)
a<-table.row.start(a)
a<-table.element(a,'Time lag k',header=TRUE)
a<-table.element(a,'PACF(k)',header=TRUE)
a<-table.element(a,'T-STAT',header=TRUE)
a<-table.element(a,'P-value',header=TRUE)
a<-table.row.end(a)
for (i in 1:par1) {
a<-table.row.start(a)
a<-table.element(a,i,header=TRUE)
a<-table.element(a,round(mypacf[i],6))
mytstat <- mypacf[i]*sqrtn
a<-table.element(a,round(mytstat,4))
a<-table.element(a,round(1-pt(abs(mytstat),lengthx),6))
a<-table.row.end(a)
}
a<-table.end(a)
table.save(a,file='mytable1.tab')