Free Statistics

of Irreproducible Research!

Author's title

Author*The author of this computation has been verified*
R Software Modulerwasp_arimabackwardselection.wasp
Title produced by softwareARIMA Backward Selection
Date of computationFri, 23 Dec 2016 09:52:47 +0100
Cite this page as followsStatistical Computations at FreeStatistics.org, Office for Research Development and Education, URL https://freestatistics.org/blog/index.php?v=date/2016/Dec/23/t1482484348zx10qjuxfle0nre.htm/, Retrieved Fri, 01 Nov 2024 03:34:46 +0000
Statistical Computations at FreeStatistics.org, Office for Research Development and Education, URL https://freestatistics.org/blog/index.php?pk=302795, Retrieved Fri, 01 Nov 2024 03:34:46 +0000
QR Codes:

Original text written by user:
IsPrivate?No (this computation is public)
User-defined keywords
Estimated Impact101
Family? (F = Feedback message, R = changed R code, M = changed R Module, P = changed Parameters, D = changed Data)
-       [ARIMA Backward Selection] [ARIMA Backward Se...] [2016-12-23 08:52:47] [02b5df5aa2382aa6805f6181aa5e25f1] [Current]
Feedback Forum

Post a new message
Dataseries X:
3800
4150
4200
3650
3750
4250
2700
3950
4400
4500
4500
4050
4250
4450
4500
3950
4300
4500
2800
4300
4750
4900
5000
4500
4500
4800
4450
4550
4150
4750
2950
4650
4950
5050
5300
4650
4600
4950
4950
4400
4550
4900
3100
4800
5200
5350
5450
4700
4800
5200
5200
4550
4800
5200
3350
5050
5550
5650
5700
5100
5200
5500
5200
5700
5200
5800
3700
5450
5950
6000
6200
5500
5550
6100
6150
5500
5700
6000
3750
5900
6350
6350
6500
5750
5850
6300
6550
5450
5750
6600
3850
6000
6750
6750
6850
6100
6400
6750
5800
6750
5850
6800
3800
6400
6800
7000
7300
6300
6500
6950
7100
6100
6550
6800


Summary of computational transaction
Raw Input view raw input (R code)
Raw Outputview raw output of R engine
Computing time5 seconds
R ServerBig Analytics Cloud Computing Center

\begin{tabular}{lllllllll}
\hline
Summary of computational transaction \tabularnewline
Raw Input view raw input (R code)  \tabularnewline
Raw Outputview raw output of R engine  \tabularnewline
Computing time5 seconds \tabularnewline
R ServerBig Analytics Cloud Computing Center \tabularnewline
\hline
\end{tabular}
%Source: https://freestatistics.org/blog/index.php?pk=302795&T=0

[TABLE]
[ROW]
Summary of computational transaction[/C][/ROW] [ROW]Raw Input[/C] view raw input (R code) [/C][/ROW] [ROW]Raw Output[/C]view raw output of R engine [/C][/ROW] [ROW]Computing time[/C]5 seconds[/C][/ROW] [ROW]R Server[/C]Big Analytics Cloud Computing Center[/C][/ROW] [/TABLE] Source: https://freestatistics.org/blog/index.php?pk=302795&T=0

Globally Unique Identifier (entire table): ba.freestatistics.org/blog/index.php?pk=302795&T=0

As an alternative you can also use a QR Code:  

The GUIDs for individual cells are displayed in the table below:

Summary of computational transaction
Raw Input view raw input (R code)
Raw Outputview raw output of R engine
Computing time5 seconds
R ServerBig Analytics Cloud Computing Center


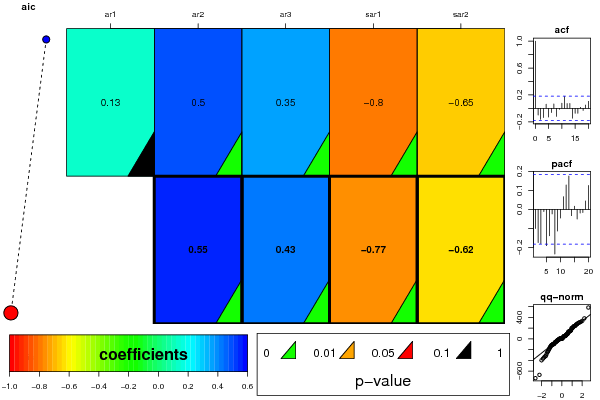
ARIMA Parameter Estimation and Backward Selection
Iterationar1ar2ar3sar1sar2
Estimates ( 1 )0.12980.50050.3501-0.8028-0.6531
(p-val)(0.1843 )(0 )(3e-04 )(0 )(0 )
Estimates ( 2 )00.54680.4311-0.7729-0.6232
(p-val)(NA )(0 )(0 )(0 )(0 )
Estimates ( 3 )NANANANANA
(p-val)(NA )(NA )(NA )(NA )(NA )
Estimates ( 4 )NANANANANA
(p-val)(NA )(NA )(NA )(NA )(NA )
Estimates ( 5 )NANANANANA
(p-val)(NA )(NA )(NA )(NA )(NA )
Estimates ( 6 )NANANANANA
(p-val)(NA )(NA )(NA )(NA )(NA )
Estimates ( 7 )NANANANANA
(p-val)(NA )(NA )(NA )(NA )(NA )
Estimates ( 8 )NANANANANA
(p-val)(NA )(NA )(NA )(NA )(NA )
Estimates ( 9 )NANANANANA
(p-val)(NA )(NA )(NA )(NA )(NA )

\begin{tabular}{lllllllll}
\hline
ARIMA Parameter Estimation and Backward Selection \tabularnewline
Iteration & ar1 & ar2 & ar3 & sar1 & sar2 \tabularnewline
Estimates ( 1 ) & 0.1298 & 0.5005 & 0.3501 & -0.8028 & -0.6531 \tabularnewline
(p-val) & (0.1843 ) & (0 ) & (3e-04 ) & (0 ) & (0 ) \tabularnewline
Estimates ( 2 ) & 0 & 0.5468 & 0.4311 & -0.7729 & -0.6232 \tabularnewline
(p-val) & (NA ) & (0 ) & (0 ) & (0 ) & (0 ) \tabularnewline
Estimates ( 3 ) & NA & NA & NA & NA & NA \tabularnewline
(p-val) & (NA ) & (NA ) & (NA ) & (NA ) & (NA ) \tabularnewline
Estimates ( 4 ) & NA & NA & NA & NA & NA \tabularnewline
(p-val) & (NA ) & (NA ) & (NA ) & (NA ) & (NA ) \tabularnewline
Estimates ( 5 ) & NA & NA & NA & NA & NA \tabularnewline
(p-val) & (NA ) & (NA ) & (NA ) & (NA ) & (NA ) \tabularnewline
Estimates ( 6 ) & NA & NA & NA & NA & NA \tabularnewline
(p-val) & (NA ) & (NA ) & (NA ) & (NA ) & (NA ) \tabularnewline
Estimates ( 7 ) & NA & NA & NA & NA & NA \tabularnewline
(p-val) & (NA ) & (NA ) & (NA ) & (NA ) & (NA ) \tabularnewline
Estimates ( 8 ) & NA & NA & NA & NA & NA \tabularnewline
(p-val) & (NA ) & (NA ) & (NA ) & (NA ) & (NA ) \tabularnewline
Estimates ( 9 ) & NA & NA & NA & NA & NA \tabularnewline
(p-val) & (NA ) & (NA ) & (NA ) & (NA ) & (NA ) \tabularnewline
\hline
\end{tabular}
%Source: https://freestatistics.org/blog/index.php?pk=302795&T=1

[TABLE]
[ROW][C]ARIMA Parameter Estimation and Backward Selection[/C][/ROW]
[ROW][C]Iteration[/C][C]ar1[/C][C]ar2[/C][C]ar3[/C][C]sar1[/C][C]sar2[/C][/ROW]
[ROW][C]Estimates ( 1 )[/C][C]0.1298[/C][C]0.5005[/C][C]0.3501[/C][C]-0.8028[/C][C]-0.6531[/C][/ROW]
[ROW][C](p-val)[/C][C](0.1843 )[/C][C](0 )[/C][C](3e-04 )[/C][C](0 )[/C][C](0 )[/C][/ROW]
[ROW][C]Estimates ( 2 )[/C][C]0[/C][C]0.5468[/C][C]0.4311[/C][C]-0.7729[/C][C]-0.6232[/C][/ROW]
[ROW][C](p-val)[/C][C](NA )[/C][C](0 )[/C][C](0 )[/C][C](0 )[/C][C](0 )[/C][/ROW]
[ROW][C]Estimates ( 3 )[/C][C]NA[/C][C]NA[/C][C]NA[/C][C]NA[/C][C]NA[/C][/ROW]
[ROW][C](p-val)[/C][C](NA )[/C][C](NA )[/C][C](NA )[/C][C](NA )[/C][C](NA )[/C][/ROW]
[ROW][C]Estimates ( 4 )[/C][C]NA[/C][C]NA[/C][C]NA[/C][C]NA[/C][C]NA[/C][/ROW]
[ROW][C](p-val)[/C][C](NA )[/C][C](NA )[/C][C](NA )[/C][C](NA )[/C][C](NA )[/C][/ROW]
[ROW][C]Estimates ( 5 )[/C][C]NA[/C][C]NA[/C][C]NA[/C][C]NA[/C][C]NA[/C][/ROW]
[ROW][C](p-val)[/C][C](NA )[/C][C](NA )[/C][C](NA )[/C][C](NA )[/C][C](NA )[/C][/ROW]
[ROW][C]Estimates ( 6 )[/C][C]NA[/C][C]NA[/C][C]NA[/C][C]NA[/C][C]NA[/C][/ROW]
[ROW][C](p-val)[/C][C](NA )[/C][C](NA )[/C][C](NA )[/C][C](NA )[/C][C](NA )[/C][/ROW]
[ROW][C]Estimates ( 7 )[/C][C]NA[/C][C]NA[/C][C]NA[/C][C]NA[/C][C]NA[/C][/ROW]
[ROW][C](p-val)[/C][C](NA )[/C][C](NA )[/C][C](NA )[/C][C](NA )[/C][C](NA )[/C][/ROW]
[ROW][C]Estimates ( 8 )[/C][C]NA[/C][C]NA[/C][C]NA[/C][C]NA[/C][C]NA[/C][/ROW]
[ROW][C](p-val)[/C][C](NA )[/C][C](NA )[/C][C](NA )[/C][C](NA )[/C][C](NA )[/C][/ROW]
[ROW][C]Estimates ( 9 )[/C][C]NA[/C][C]NA[/C][C]NA[/C][C]NA[/C][C]NA[/C][/ROW]
[ROW][C](p-val)[/C][C](NA )[/C][C](NA )[/C][C](NA )[/C][C](NA )[/C][C](NA )[/C][/ROW]
[/TABLE]
Source: https://freestatistics.org/blog/index.php?pk=302795&T=1

Globally Unique Identifier (entire table): ba.freestatistics.org/blog/index.php?pk=302795&T=1

As an alternative you can also use a QR Code:  

The GUIDs for individual cells are displayed in the table below:

ARIMA Parameter Estimation and Backward Selection
Iterationar1ar2ar3sar1sar2
Estimates ( 1 )0.12980.50050.3501-0.8028-0.6531
(p-val)(0.1843 )(0 )(3e-04 )(0 )(0 )
Estimates ( 2 )00.54680.4311-0.7729-0.6232
(p-val)(NA )(0 )(0 )(0 )(0 )
Estimates ( 3 )NANANANANA
(p-val)(NA )(NA )(NA )(NA )(NA )
Estimates ( 4 )NANANANANA
(p-val)(NA )(NA )(NA )(NA )(NA )
Estimates ( 5 )NANANANANA
(p-val)(NA )(NA )(NA )(NA )(NA )
Estimates ( 6 )NANANANANA
(p-val)(NA )(NA )(NA )(NA )(NA )
Estimates ( 7 )NANANANANA
(p-val)(NA )(NA )(NA )(NA )(NA )
Estimates ( 8 )NANANANANA
(p-val)(NA )(NA )(NA )(NA )(NA )
Estimates ( 9 )NANANANANA
(p-val)(NA )(NA )(NA )(NA )(NA )


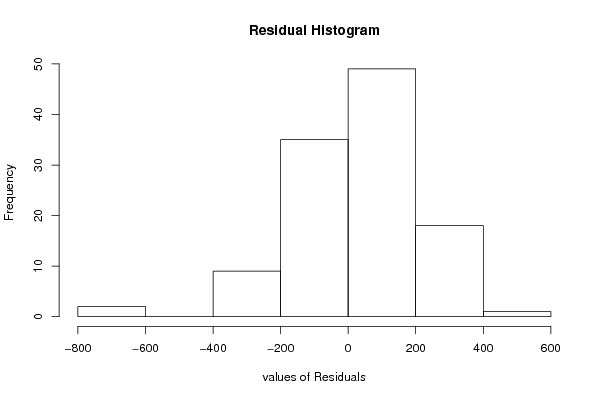
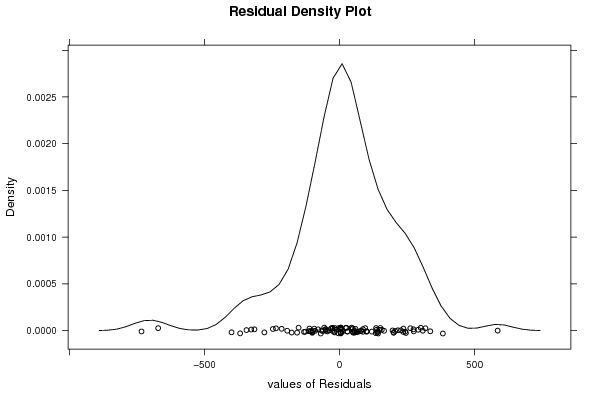
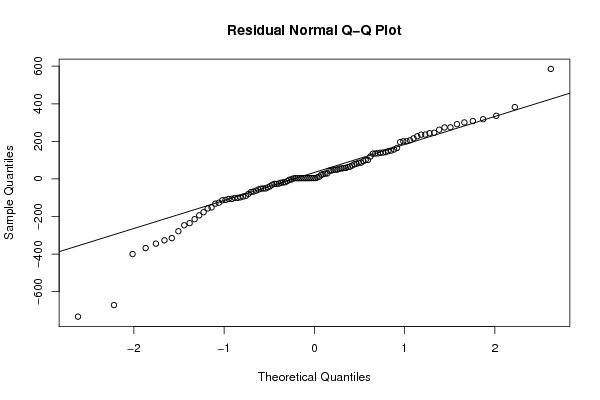
Estimated ARIMA Residuals
Value
4.04988635601438
200.128544764042
25.3455733629124
-12.0517921717416
-3.32448228633865
200.359695104304
-17.6986976975548
-177.070093286367
44.6321615455857
139.120436995858
134.119377606013
147.822161633021
65.3181805366416
-56.6413922907025
-25.1478814687587
-278.282655191834
261.894929780943
-131.704001442763
-18.4576437221995
-111.488505669327
227.037480908984
71.7361652652435
-4.28462722415898
140.322068210923
-20.4741763280959
-101.369670853645
-26.5339969688944
58.4606968653933
-79.4445872677949
22.5870427163622
-62.6087416904545
-235.426827211737
135.121627431528
205.550562339149
151.027938903416
78.1023512148791
-193.748647326429
-214.424602816098
57.8849178378525
156.433108487835
-113.982144451836
-100.944148123011
94.726044062837
8.24777306118131
80.4147044852488
164.78809012152
86.573729134926
-67.2896779061694
-93.6712585200621
48.91505063981
49.8223000744911
-52.0911458282708
585.254932991989
236.246304032456
55.5008974795646
-315.070034024992
-157.172983705038
100.243212281386
100.395108225757
29.373404030931
-39.2525519930741
28.7173523699939
243.165014352342
317.740439746521
-106.557695548596
-30.9276243981349
-50.9292413623607
-399.871023463398
86.3666623110802
273.784950278701
62.9067633268405
-45.1198751665252
-26.2384330253117
11.8984358246171
48.9683970509259
335.807490238186
-344.546314385183
-246.680353122714
382.354424077064
-326.814737988102
-151.633274626389
300.589554472328
291.321379024351
54.6905571336565
-106.310672486491
136.434321640186
142.531602266292
-733.031066172237
245.756006309673
-126.735821208131
119.469377682395
-671.425461777233
196.066464383268
215.994966106878
308.09890272452
235.564189947085
-97.7247132909661
-90.0451974430935
-50.8036863090174
274.620531458159
-367.971087613153
43.80784495014
-69.5643620951523

\begin{tabular}{lllllllll}
\hline
Estimated ARIMA Residuals \tabularnewline
Value \tabularnewline
4.04988635601438 \tabularnewline
200.128544764042 \tabularnewline
25.3455733629124 \tabularnewline
-12.0517921717416 \tabularnewline
-3.32448228633865 \tabularnewline
200.359695104304 \tabularnewline
-17.6986976975548 \tabularnewline
-177.070093286367 \tabularnewline
44.6321615455857 \tabularnewline
139.120436995858 \tabularnewline
134.119377606013 \tabularnewline
147.822161633021 \tabularnewline
65.3181805366416 \tabularnewline
-56.6413922907025 \tabularnewline
-25.1478814687587 \tabularnewline
-278.282655191834 \tabularnewline
261.894929780943 \tabularnewline
-131.704001442763 \tabularnewline
-18.4576437221995 \tabularnewline
-111.488505669327 \tabularnewline
227.037480908984 \tabularnewline
71.7361652652435 \tabularnewline
-4.28462722415898 \tabularnewline
140.322068210923 \tabularnewline
-20.4741763280959 \tabularnewline
-101.369670853645 \tabularnewline
-26.5339969688944 \tabularnewline
58.4606968653933 \tabularnewline
-79.4445872677949 \tabularnewline
22.5870427163622 \tabularnewline
-62.6087416904545 \tabularnewline
-235.426827211737 \tabularnewline
135.121627431528 \tabularnewline
205.550562339149 \tabularnewline
151.027938903416 \tabularnewline
78.1023512148791 \tabularnewline
-193.748647326429 \tabularnewline
-214.424602816098 \tabularnewline
57.8849178378525 \tabularnewline
156.433108487835 \tabularnewline
-113.982144451836 \tabularnewline
-100.944148123011 \tabularnewline
94.726044062837 \tabularnewline
8.24777306118131 \tabularnewline
80.4147044852488 \tabularnewline
164.78809012152 \tabularnewline
86.573729134926 \tabularnewline
-67.2896779061694 \tabularnewline
-93.6712585200621 \tabularnewline
48.91505063981 \tabularnewline
49.8223000744911 \tabularnewline
-52.0911458282708 \tabularnewline
585.254932991989 \tabularnewline
236.246304032456 \tabularnewline
55.5008974795646 \tabularnewline
-315.070034024992 \tabularnewline
-157.172983705038 \tabularnewline
100.243212281386 \tabularnewline
100.395108225757 \tabularnewline
29.373404030931 \tabularnewline
-39.2525519930741 \tabularnewline
28.7173523699939 \tabularnewline
243.165014352342 \tabularnewline
317.740439746521 \tabularnewline
-106.557695548596 \tabularnewline
-30.9276243981349 \tabularnewline
-50.9292413623607 \tabularnewline
-399.871023463398 \tabularnewline
86.3666623110802 \tabularnewline
273.784950278701 \tabularnewline
62.9067633268405 \tabularnewline
-45.1198751665252 \tabularnewline
-26.2384330253117 \tabularnewline
11.8984358246171 \tabularnewline
48.9683970509259 \tabularnewline
335.807490238186 \tabularnewline
-344.546314385183 \tabularnewline
-246.680353122714 \tabularnewline
382.354424077064 \tabularnewline
-326.814737988102 \tabularnewline
-151.633274626389 \tabularnewline
300.589554472328 \tabularnewline
291.321379024351 \tabularnewline
54.6905571336565 \tabularnewline
-106.310672486491 \tabularnewline
136.434321640186 \tabularnewline
142.531602266292 \tabularnewline
-733.031066172237 \tabularnewline
245.756006309673 \tabularnewline
-126.735821208131 \tabularnewline
119.469377682395 \tabularnewline
-671.425461777233 \tabularnewline
196.066464383268 \tabularnewline
215.994966106878 \tabularnewline
308.09890272452 \tabularnewline
235.564189947085 \tabularnewline
-97.7247132909661 \tabularnewline
-90.0451974430935 \tabularnewline
-50.8036863090174 \tabularnewline
274.620531458159 \tabularnewline
-367.971087613153 \tabularnewline
43.80784495014 \tabularnewline
-69.5643620951523 \tabularnewline
\hline
\end{tabular}
%Source: https://freestatistics.org/blog/index.php?pk=302795&T=2

[TABLE]
[ROW][C]Estimated ARIMA Residuals[/C][/ROW]
[ROW][C]Value[/C][/ROW]
[ROW][C]4.04988635601438[/C][/ROW]
[ROW][C]200.128544764042[/C][/ROW]
[ROW][C]25.3455733629124[/C][/ROW]
[ROW][C]-12.0517921717416[/C][/ROW]
[ROW][C]-3.32448228633865[/C][/ROW]
[ROW][C]200.359695104304[/C][/ROW]
[ROW][C]-17.6986976975548[/C][/ROW]
[ROW][C]-177.070093286367[/C][/ROW]
[ROW][C]44.6321615455857[/C][/ROW]
[ROW][C]139.120436995858[/C][/ROW]
[ROW][C]134.119377606013[/C][/ROW]
[ROW][C]147.822161633021[/C][/ROW]
[ROW][C]65.3181805366416[/C][/ROW]
[ROW][C]-56.6413922907025[/C][/ROW]
[ROW][C]-25.1478814687587[/C][/ROW]
[ROW][C]-278.282655191834[/C][/ROW]
[ROW][C]261.894929780943[/C][/ROW]
[ROW][C]-131.704001442763[/C][/ROW]
[ROW][C]-18.4576437221995[/C][/ROW]
[ROW][C]-111.488505669327[/C][/ROW]
[ROW][C]227.037480908984[/C][/ROW]
[ROW][C]71.7361652652435[/C][/ROW]
[ROW][C]-4.28462722415898[/C][/ROW]
[ROW][C]140.322068210923[/C][/ROW]
[ROW][C]-20.4741763280959[/C][/ROW]
[ROW][C]-101.369670853645[/C][/ROW]
[ROW][C]-26.5339969688944[/C][/ROW]
[ROW][C]58.4606968653933[/C][/ROW]
[ROW][C]-79.4445872677949[/C][/ROW]
[ROW][C]22.5870427163622[/C][/ROW]
[ROW][C]-62.6087416904545[/C][/ROW]
[ROW][C]-235.426827211737[/C][/ROW]
[ROW][C]135.121627431528[/C][/ROW]
[ROW][C]205.550562339149[/C][/ROW]
[ROW][C]151.027938903416[/C][/ROW]
[ROW][C]78.1023512148791[/C][/ROW]
[ROW][C]-193.748647326429[/C][/ROW]
[ROW][C]-214.424602816098[/C][/ROW]
[ROW][C]57.8849178378525[/C][/ROW]
[ROW][C]156.433108487835[/C][/ROW]
[ROW][C]-113.982144451836[/C][/ROW]
[ROW][C]-100.944148123011[/C][/ROW]
[ROW][C]94.726044062837[/C][/ROW]
[ROW][C]8.24777306118131[/C][/ROW]
[ROW][C]80.4147044852488[/C][/ROW]
[ROW][C]164.78809012152[/C][/ROW]
[ROW][C]86.573729134926[/C][/ROW]
[ROW][C]-67.2896779061694[/C][/ROW]
[ROW][C]-93.6712585200621[/C][/ROW]
[ROW][C]48.91505063981[/C][/ROW]
[ROW][C]49.8223000744911[/C][/ROW]
[ROW][C]-52.0911458282708[/C][/ROW]
[ROW][C]585.254932991989[/C][/ROW]
[ROW][C]236.246304032456[/C][/ROW]
[ROW][C]55.5008974795646[/C][/ROW]
[ROW][C]-315.070034024992[/C][/ROW]
[ROW][C]-157.172983705038[/C][/ROW]
[ROW][C]100.243212281386[/C][/ROW]
[ROW][C]100.395108225757[/C][/ROW]
[ROW][C]29.373404030931[/C][/ROW]
[ROW][C]-39.2525519930741[/C][/ROW]
[ROW][C]28.7173523699939[/C][/ROW]
[ROW][C]243.165014352342[/C][/ROW]
[ROW][C]317.740439746521[/C][/ROW]
[ROW][C]-106.557695548596[/C][/ROW]
[ROW][C]-30.9276243981349[/C][/ROW]
[ROW][C]-50.9292413623607[/C][/ROW]
[ROW][C]-399.871023463398[/C][/ROW]
[ROW][C]86.3666623110802[/C][/ROW]
[ROW][C]273.784950278701[/C][/ROW]
[ROW][C]62.9067633268405[/C][/ROW]
[ROW][C]-45.1198751665252[/C][/ROW]
[ROW][C]-26.2384330253117[/C][/ROW]
[ROW][C]11.8984358246171[/C][/ROW]
[ROW][C]48.9683970509259[/C][/ROW]
[ROW][C]335.807490238186[/C][/ROW]
[ROW][C]-344.546314385183[/C][/ROW]
[ROW][C]-246.680353122714[/C][/ROW]
[ROW][C]382.354424077064[/C][/ROW]
[ROW][C]-326.814737988102[/C][/ROW]
[ROW][C]-151.633274626389[/C][/ROW]
[ROW][C]300.589554472328[/C][/ROW]
[ROW][C]291.321379024351[/C][/ROW]
[ROW][C]54.6905571336565[/C][/ROW]
[ROW][C]-106.310672486491[/C][/ROW]
[ROW][C]136.434321640186[/C][/ROW]
[ROW][C]142.531602266292[/C][/ROW]
[ROW][C]-733.031066172237[/C][/ROW]
[ROW][C]245.756006309673[/C][/ROW]
[ROW][C]-126.735821208131[/C][/ROW]
[ROW][C]119.469377682395[/C][/ROW]
[ROW][C]-671.425461777233[/C][/ROW]
[ROW][C]196.066464383268[/C][/ROW]
[ROW][C]215.994966106878[/C][/ROW]
[ROW][C]308.09890272452[/C][/ROW]
[ROW][C]235.564189947085[/C][/ROW]
[ROW][C]-97.7247132909661[/C][/ROW]
[ROW][C]-90.0451974430935[/C][/ROW]
[ROW][C]-50.8036863090174[/C][/ROW]
[ROW][C]274.620531458159[/C][/ROW]
[ROW][C]-367.971087613153[/C][/ROW]
[ROW][C]43.80784495014[/C][/ROW]
[ROW][C]-69.5643620951523[/C][/ROW]
[/TABLE]
Source: https://freestatistics.org/blog/index.php?pk=302795&T=2

Globally Unique Identifier (entire table): ba.freestatistics.org/blog/index.php?pk=302795&T=2

As an alternative you can also use a QR Code:  

The GUIDs for individual cells are displayed in the table below:

Estimated ARIMA Residuals
Value
4.04988635601438
200.128544764042
25.3455733629124
-12.0517921717416
-3.32448228633865
200.359695104304
-17.6986976975548
-177.070093286367
44.6321615455857
139.120436995858
134.119377606013
147.822161633021
65.3181805366416
-56.6413922907025
-25.1478814687587
-278.282655191834
261.894929780943
-131.704001442763
-18.4576437221995
-111.488505669327
227.037480908984
71.7361652652435
-4.28462722415898
140.322068210923
-20.4741763280959
-101.369670853645
-26.5339969688944
58.4606968653933
-79.4445872677949
22.5870427163622
-62.6087416904545
-235.426827211737
135.121627431528
205.550562339149
151.027938903416
78.1023512148791
-193.748647326429
-214.424602816098
57.8849178378525
156.433108487835
-113.982144451836
-100.944148123011
94.726044062837
8.24777306118131
80.4147044852488
164.78809012152
86.573729134926
-67.2896779061694
-93.6712585200621
48.91505063981
49.8223000744911
-52.0911458282708
585.254932991989
236.246304032456
55.5008974795646
-315.070034024992
-157.172983705038
100.243212281386
100.395108225757
29.373404030931
-39.2525519930741
28.7173523699939
243.165014352342
317.740439746521
-106.557695548596
-30.9276243981349
-50.9292413623607
-399.871023463398
86.3666623110802
273.784950278701
62.9067633268405
-45.1198751665252
-26.2384330253117
11.8984358246171
48.9683970509259
335.807490238186
-344.546314385183
-246.680353122714
382.354424077064
-326.814737988102
-151.633274626389
300.589554472328
291.321379024351
54.6905571336565
-106.310672486491
136.434321640186
142.531602266292
-733.031066172237
245.756006309673
-126.735821208131
119.469377682395
-671.425461777233
196.066464383268
215.994966106878
308.09890272452
235.564189947085
-97.7247132909661
-90.0451974430935
-50.8036863090174
274.620531458159
-367.971087613153
43.80784495014
-69.5643620951523


Parameters (Session):
par1 = FALSE ; par2 = 1 ; par3 = 0 ; par4 = 1 ; par5 = 12 ; par6 = 3 ; par7 = 0 ; par8 = 2 ; par9 = 0 ;
Parameters (R input):
par1 = FALSE ; par2 = 1 ; par3 = 0 ; par4 = 1 ; par5 = 12 ; par6 = 3 ; par7 = 0 ; par8 = 2 ; par9 = 0 ;
R code (references can be found in the software module):
library(lattice)
if (par1 == 'TRUE') par1 <- TRUE
if (par1 == 'FALSE') par1 <- FALSE
par2 <- as.numeric(par2) #Box-Cox lambda transformation parameter
par3 <- as.numeric(par3) #degree of non-seasonal differencing
par4 <- as.numeric(par4) #degree of seasonal differencing
par5 <- as.numeric(par5) #seasonal period
par6 <- as.numeric(par6) #degree (p) of the non-seasonal AR(p) polynomial
par7 <- as.numeric(par7) #degree (q) of the non-seasonal MA(q) polynomial
par8 <- as.numeric(par8) #degree (P) of the seasonal AR(P) polynomial
par9 <- as.numeric(par9) #degree (Q) of the seasonal MA(Q) polynomial
armaGR <- function(arima.out, names, n){
try1 <- arima.out$coef
try2 <- sqrt(diag(arima.out$var.coef))
try.data.frame <- data.frame(matrix(NA,ncol=4,nrow=length(names)))
dimnames(try.data.frame) <- list(names,c('coef','std','tstat','pv'))
try.data.frame[,1] <- try1
for(i in 1:length(try2)) try.data.frame[which(rownames(try.data.frame)==names(try2)[i]),2] <- try2[i]
try.data.frame[,3] <- try.data.frame[,1] / try.data.frame[,2]
try.data.frame[,4] <- round((1-pt(abs(try.data.frame[,3]),df=n-(length(try2)+1)))*2,5)
vector <- rep(NA,length(names))
vector[is.na(try.data.frame[,4])] <- 0
maxi <- which.max(try.data.frame[,4])
continue <- max(try.data.frame[,4],na.rm=TRUE) > .05
vector[maxi] <- 0
list(summary=try.data.frame,next.vector=vector,continue=continue)
}
arimaSelect <- function(series, order=c(13,0,0), seasonal=list(order=c(2,0,0),period=12), include.mean=F){
nrc <- order[1]+order[3]+seasonal$order[1]+seasonal$order[3]
coeff <- matrix(NA, nrow=nrc*2, ncol=nrc)
pval <- matrix(NA, nrow=nrc*2, ncol=nrc)
mylist <- rep(list(NULL), nrc)
names <- NULL
if(order[1] > 0) names <- paste('ar',1:order[1],sep='')
if(order[3] > 0) names <- c( names , paste('ma',1:order[3],sep='') )
if(seasonal$order[1] > 0) names <- c(names, paste('sar',1:seasonal$order[1],sep=''))
if(seasonal$order[3] > 0) names <- c(names, paste('sma',1:seasonal$order[3],sep=''))
arima.out <- arima(series, order=order, seasonal=seasonal, include.mean=include.mean, method='ML')
mylist[[1]] <- arima.out
last.arma <- armaGR(arima.out, names, length(series))
mystop <- FALSE
i <- 1
coeff[i,] <- last.arma[[1]][,1]
pval [i,] <- last.arma[[1]][,4]
i <- 2
aic <- arima.out$aic
while(!mystop){
mylist[[i]] <- arima.out
arima.out <- arima(series, order=order, seasonal=seasonal, include.mean=include.mean, method='ML', fixed=last.arma$next.vector)
aic <- c(aic, arima.out$aic)
last.arma <- armaGR(arima.out, names, length(series))
mystop <- !last.arma$continue
coeff[i,] <- last.arma[[1]][,1]
pval [i,] <- last.arma[[1]][,4]
i <- i+1
}
list(coeff, pval, mylist, aic=aic)
}
arimaSelectplot <- function(arimaSelect.out,noms,choix){
noms <- names(arimaSelect.out[[3]][[1]]$coef)
coeff <- arimaSelect.out[[1]]
k <- min(which(is.na(coeff[,1])))-1
coeff <- coeff[1:k,]
pval <- arimaSelect.out[[2]][1:k,]
aic <- arimaSelect.out$aic[1:k]
coeff[coeff==0] <- NA
n <- ncol(coeff)
if(missing(choix)) choix <- k
layout(matrix(c(1,1,1,2,
3,3,3,2,
3,3,3,4,
5,6,7,7),nr=4),
widths=c(10,35,45,15),
heights=c(30,30,15,15))
couleurs <- rainbow(75)[1:50]#(50)
ticks <- pretty(coeff)
par(mar=c(1,1,3,1))
plot(aic,k:1-.5,type='o',pch=21,bg='blue',cex=2,axes=F,lty=2,xpd=NA)
points(aic[choix],k-choix+.5,pch=21,cex=4,bg=2,xpd=NA)
title('aic',line=2)
par(mar=c(3,0,0,0))
plot(0,axes=F,xlab='',ylab='',xlim=range(ticks),ylim=c(.1,1))
rect(xleft = min(ticks) + (0:49)/50*(max(ticks)-min(ticks)),
xright = min(ticks) + (1:50)/50*(max(ticks)-min(ticks)),
ytop = rep(1,50),
ybottom= rep(0,50),col=couleurs,border=NA)
axis(1,ticks)
rect(xleft=min(ticks),xright=max(ticks),ytop=1,ybottom=0)
text(mean(coeff,na.rm=T),.5,'coefficients',cex=2,font=2)
par(mar=c(1,1,3,1))
image(1:n,1:k,t(coeff[k:1,]),axes=F,col=couleurs,zlim=range(ticks))
for(i in 1:n) for(j in 1:k) if(!is.na(coeff[j,i])) {
if(pval[j,i]<.01) symb = 'green'
else if( (pval[j,i]<.05) & (pval[j,i]>=.01)) symb = 'orange'
else if( (pval[j,i]<.1) & (pval[j,i]>=.05)) symb = 'red'
else symb = 'black'
polygon(c(i+.5 ,i+.2 ,i+.5 ,i+.5),
c(k-j+0.5,k-j+0.5,k-j+0.8,k-j+0.5),
col=symb)
if(j==choix) {
rect(xleft=i-.5,
xright=i+.5,
ybottom=k-j+1.5,
ytop=k-j+.5,
lwd=4)
text(i,
k-j+1,
round(coeff[j,i],2),
cex=1.2,
font=2)
}
else{
rect(xleft=i-.5,xright=i+.5,ybottom=k-j+1.5,ytop=k-j+.5)
text(i,k-j+1,round(coeff[j,i],2),cex=1.2,font=1)
}
}
axis(3,1:n,noms)
par(mar=c(0.5,0,0,0.5))
plot(0,axes=F,xlab='',ylab='',type='n',xlim=c(0,8),ylim=c(-.2,.8))
cols <- c('green','orange','red','black')
niv <- c('0','0.01','0.05','0.1')
for(i in 0:3){
polygon(c(1+2*i ,1+2*i ,1+2*i-.5 ,1+2*i),
c(.4 ,.7 , .4 , .4),
col=cols[i+1])
text(2*i,0.5,niv[i+1],cex=1.5)
}
text(8,.5,1,cex=1.5)
text(4,0,'p-value',cex=2)
box()
residus <- arimaSelect.out[[3]][[choix]]$res
par(mar=c(1,2,4,1))
acf(residus,main='')
title('acf',line=.5)
par(mar=c(1,2,4,1))
pacf(residus,main='')
title('pacf',line=.5)
par(mar=c(2,2,4,1))
qqnorm(residus,main='')
title('qq-norm',line=.5)
qqline(residus)
residus
}
if (par2 == 0) x <- log(x)
if (par2 != 0) x <- x^par2
(selection <- arimaSelect(x, order=c(par6,par3,par7), seasonal=list(order=c(par8,par4,par9), period=par5)))
bitmap(file='test1.png')
resid <- arimaSelectplot(selection)
dev.off()
resid
bitmap(file='test2.png')
acf(resid,length(resid)/2, main='Residual Autocorrelation Function')
dev.off()
bitmap(file='test3.png')
pacf(resid,length(resid)/2, main='Residual Partial Autocorrelation Function')
dev.off()
bitmap(file='test4.png')
cpgram(resid, main='Residual Cumulative Periodogram')
dev.off()
bitmap(file='test5.png')
hist(resid, main='Residual Histogram', xlab='values of Residuals')
dev.off()
bitmap(file='test6.png')
densityplot(~resid,col='black',main='Residual Density Plot', xlab='values of Residuals')
dev.off()
bitmap(file='test7.png')
qqnorm(resid, main='Residual Normal Q-Q Plot')
qqline(resid)
dev.off()
ncols <- length(selection[[1]][1,])
nrows <- length(selection[[2]][,1])-1
load(file='createtable')
a<-table.start()
a<-table.row.start(a)
a<-table.element(a,'ARIMA Parameter Estimation and Backward Selection', ncols+1,TRUE)
a<-table.row.end(a)
a<-table.row.start(a)
a<-table.element(a,'Iteration', header=TRUE)
for (i in 1:ncols) {
a<-table.element(a,names(selection[[3]][[1]]$coef)[i],header=TRUE)
}
a<-table.row.end(a)
for (j in 1:nrows) {
a<-table.row.start(a)
mydum <- 'Estimates ('
mydum <- paste(mydum,j)
mydum <- paste(mydum,')')
a<-table.element(a,mydum, header=TRUE)
for (i in 1:ncols) {
a<-table.element(a,round(selection[[1]][j,i],4))
}
a<-table.row.end(a)
a<-table.row.start(a)
a<-table.element(a,'(p-val)', header=TRUE)
for (i in 1:ncols) {
mydum <- '('
mydum <- paste(mydum,round(selection[[2]][j,i],4),sep='')
mydum <- paste(mydum,')')
a<-table.element(a,mydum)
}
a<-table.row.end(a)
}
a<-table.end(a)
table.save(a,file='mytable.tab')
a<-table.start()
a<-table.row.start(a)
a<-table.element(a,'Estimated ARIMA Residuals', 1,TRUE)
a<-table.row.end(a)
a<-table.row.start(a)
a<-table.element(a,'Value', 1,TRUE)
a<-table.row.end(a)
for (i in (par4*par5+par3):length(resid)) {
a<-table.row.start(a)
a<-table.element(a,resid[i])
a<-table.row.end(a)
}
a<-table.end(a)
table.save(a,file='mytable1.tab')