Free Statistics

of Irreproducible Research!

Author's title

Author*The author of this computation has been verified*
R Software Modulerwasp_univariatedataseries.wasp
Title produced by softwareUnivariate Data Series
Date of computationFri, 23 Dec 2016 09:10:48 +0100
Cite this page as followsStatistical Computations at FreeStatistics.org, Office for Research Development and Education, URL https://freestatistics.org/blog/index.php?v=date/2016/Dec/23/t1482480817mixzn066g47wmm5.htm/, Retrieved Fri, 01 Nov 2024 03:34:24 +0000
Statistical Computations at FreeStatistics.org, Office for Research Development and Education, URL https://freestatistics.org/blog/index.php?pk=302775, Retrieved Fri, 01 Nov 2024 03:34:24 +0000
QR Codes:

Original text written by user:
IsPrivate?No (this computation is public)
User-defined keywords
Estimated Impact130
Family? (F = Feedback message, R = changed R code, M = changed R Module, P = changed Parameters, D = changed Data)
-       [Univariate Data Series] [plot & describ N2737] [2016-12-23 08:10:48] [11b61e09f442d73f657668491c17a736] [Current]
Feedback Forum

Post a new message
Dataseries X:
9916
9474
9172
7766
6660
6458
5890
5732
4770
4614
4872
5256
6442
6128
5630
5112
4448
4266
4492
4236
3988
4084
4354
5062
6472
6454
6020
5520
4662
4612
4836
4514
4256
4228
4370
5510
6304
6288
6156
5602
4808
4774
4960
4762
4490
4202
4450
5420
6004
6094
5896
4980
4212
4212
4084
4068
3564
3250
3524
4362
5322
5416
5126
4284
3722
3756
3726
3844
3234
3160
3510
3898
5230
5154
4972
4416
3856
3710
4050
4020
3486
3638
3922
4442
6034
5786
5452
5000
4468
4250
4698
4388
4186
4368
4812
5850
7772
7940
7894
7510
6324
6152
6326
5772
5366
5354
5468
6876
8096
8100
7916
6970
6124
6008
5956
5910


Summary of computational transaction
Raw Input view raw input (R code)
Raw Outputview raw output of R engine
Computing time0 seconds
R ServerBig Analytics Cloud Computing Center

\begin{tabular}{lllllllll}
\hline
Summary of computational transaction \tabularnewline
Raw Input view raw input (R code)  \tabularnewline
Raw Outputview raw output of R engine  \tabularnewline
Computing time0 seconds \tabularnewline
R ServerBig Analytics Cloud Computing Center \tabularnewline
\hline
\end{tabular}
%Source: https://freestatistics.org/blog/index.php?pk=302775&T=0

[TABLE]
[ROW]
Summary of computational transaction[/C][/ROW] [ROW]Raw Input[/C] view raw input (R code) [/C][/ROW] [ROW]Raw Output[/C]view raw output of R engine [/C][/ROW] [ROW]Computing time[/C]0 seconds[/C][/ROW] [ROW]R Server[/C]Big Analytics Cloud Computing Center[/C][/ROW] [/TABLE] Source: https://freestatistics.org/blog/index.php?pk=302775&T=0

Globally Unique Identifier (entire table): ba.freestatistics.org/blog/index.php?pk=302775&T=0

As an alternative you can also use a QR Code:  

The GUIDs for individual cells are displayed in the table below:

Summary of computational transaction
Raw Input view raw input (R code)
Raw Outputview raw output of R engine
Computing time0 seconds
R ServerBig Analytics Cloud Computing Center


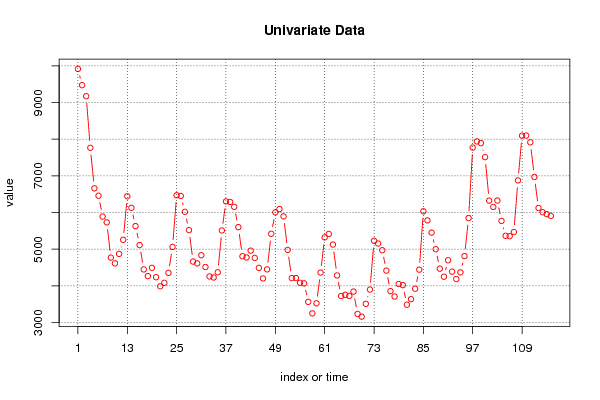
Univariate Dataseries
Name of dataseriesN2737
Source
Description
Number of observations116

\begin{tabular}{lllllllll}
\hline
Univariate Dataseries \tabularnewline
Name of dataseries & N2737 \tabularnewline
Source &  \tabularnewline
Description &  \tabularnewline
Number of observations & 116 \tabularnewline
\hline
\end{tabular}
%Source: https://freestatistics.org/blog/index.php?pk=302775&T=1

[TABLE]
[ROW][C]Univariate Dataseries[/C][/ROW]
[ROW][C]Name of dataseries[/C][C]N2737[/C][/ROW]
[ROW][C]Source[/C][C][/C][/ROW]
[ROW][C]Description[/C][C][/C][/ROW]
[ROW][C]Number of observations[/C][C]116[/C][/ROW]
[/TABLE]
Source: https://freestatistics.org/blog/index.php?pk=302775&T=1

Globally Unique Identifier (entire table): ba.freestatistics.org/blog/index.php?pk=302775&T=1

As an alternative you can also use a QR Code:  

The GUIDs for individual cells are displayed in the table below:

Univariate Dataseries
Name of dataseriesN2737
Source
Description
Number of observations116


Summary Statistics of dataseries x
> summary(x)
   Min. 1st Qu.  Median    Mean 3rd Qu.    Max. 
   3160    4254    4976    5257    6011    9916 

\begin{tabular}{lllllllll}
\hline
Summary Statistics of dataseries x \tabularnewline
> summary(x)
   Min. 1st Qu.  Median    Mean 3rd Qu.    Max. 
   3160    4254    4976    5257    6011    9916 
\tabularnewline \hline \end{tabular} %Source: https://freestatistics.org/blog/index.php?pk=302775&T=2

[TABLE]
[ROW][C]Summary Statistics of dataseries x[/C][/ROW]
[ROW][C]
> summary(x)
   Min. 1st Qu.  Median    Mean 3rd Qu.    Max. 
   3160    4254    4976    5257    6011    9916 
[/C][/ROW] [/TABLE] Source: https://freestatistics.org/blog/index.php?pk=302775&T=2

Globally Unique Identifier (entire table): ba.freestatistics.org/blog/index.php?pk=302775&T=2

As an alternative you can also use a QR Code:  

The GUIDs for individual cells are displayed in the table below:

Summary Statistics of dataseries x
> summary(x)
   Min. 1st Qu.  Median    Mean 3rd Qu.    Max. 
   3160    4254    4976    5257    6011    9916 


Parameters (Session):
par1 = N2737 ; par4 = 12 ;
Parameters (R input):
par1 = N2737 ; par2 = ; par3 = ; par4 = 12 ;
R code (references can be found in the software module):
if (par4 != 'No season') {
par4 <- as.numeric(par4)
if (par4 < 4) par4 <- 12
}
summary(x)
n <- length(x)
bitmap(file='test1.png')
if (par4=='No season') {
plot(x,col=2,type='b',main=main,xlab=xlab,ylab=ylab,xaxt='n')
axis(1,at=seq(1,n,10))
}
if (par4!='No season') {
plot(x,col=2,type='b',main=main,xlab=xlab,ylab=ylab,xaxt='n')
axis(1,at=seq(1,n,par4))
grid(nx=0,ny=NULL,col='black')
abline(v=seq(1,n,par4),col='black',lty='dotted')
}
dev.off()
load(file='createtable')
a<-table.start()
a<-table.row.start(a)
a<-table.element(a,'Univariate Dataseries',2,TRUE)
a<-table.row.end(a)
a<-table.row.start(a)
a<-table.element(a,'Name of dataseries',header=TRUE)
a<-table.element(a,par1)
a<-table.row.end(a)
a<-table.row.start(a)
a<-table.element(a,'Source',header=TRUE)
a<-table.element(a,par2)
a<-table.row.end(a)
a<-table.row.start(a)
a<-table.element(a,'Description',header=TRUE)
a<-table.element(a,par3)
a<-table.row.end(a)
a<-table.row.start(a)
a<-table.element(a,'Number of observations',header=TRUE)
a<-table.element(a,length(x))
a<-table.row.end(a)
a<-table.end(a)
table.save(a,file='mytable.tab')
a<-table.start()
a<-table.row.start(a)
a<-table.element(a,'Summary Statistics of dataseries x',1,TRUE)
a<-table.row.end(a)
a<-table.row.start(a)
a<-table.element(a,paste('
',RC.texteval('summary(x)'),'
',sep=''))
a<-table.row.end(a)
a<-table.end(a)
table.save(a,file='mytable1.tab')