Free Statistics

of Irreproducible Research!

Author's title

Author*The author of this computation has been verified*
R Software Modulerwasp_autocorrelation.wasp
Title produced by software(Partial) Autocorrelation Function
Date of computationFri, 23 Dec 2016 08:37:58 +0100
Cite this page as followsStatistical Computations at FreeStatistics.org, Office for Research Development and Education, URL https://freestatistics.org/blog/index.php?v=date/2016/Dec/23/t1482478952hiapd1or0748z5p.htm/, Retrieved Fri, 01 Nov 2024 03:37:22 +0000
Statistical Computations at FreeStatistics.org, Office for Research Development and Education, URL https://freestatistics.org/blog/index.php?pk=302751, Retrieved Fri, 01 Nov 2024 03:37:22 +0000
QR Codes:

Original text written by user:
IsPrivate?No (this computation is public)
User-defined keywords
Estimated Impact129
Family? (F = Feedback message, R = changed R code, M = changed R Module, P = changed Parameters, D = changed Data)
-       [(Partial) Autocorrelation Function] [] [2016-12-23 07:37:58] [0b5bf205c55efce49027552c8371b570] [Current]
Feedback Forum

Post a new message
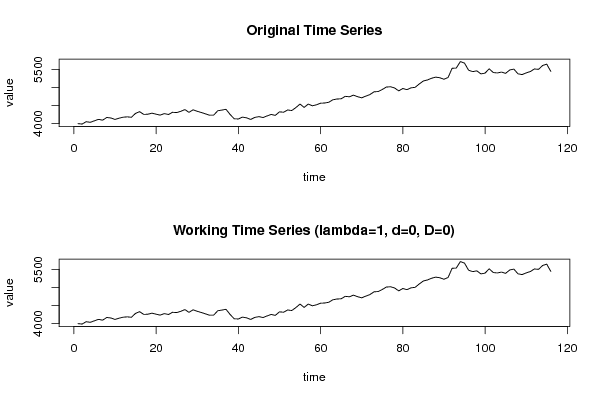
Dataseries X:
3996.1
3984.2
4049
4032.8
4074.1
4114.4
4091.4
4166.6
4152.5
4112.7
4145.9
4174.4
4183.6
4172.5
4280.3
4327.4
4251.2
4256.5
4285.7
4257.4
4231.9
4274.3
4248.3
4310.5
4301.9
4336.5
4385.1
4310.4
4378.8
4338
4304.2
4266.9
4230.1
4230.6
4353.2
4371.2
4393.2
4250.2
4129.5
4124.9
4177.1
4156.9
4111.9
4167.4
4190.7
4165
4209.8
4250
4224.8
4322.7
4311.7
4373.8
4358.9
4441.2
4538.9
4444.8
4537.8
4490.2
4517.3
4561.9
4567
4588.3
4656.8
4677.7
4684.2
4752.8
4738.9
4785.6
4742.7
4711.4
4758.1
4800.5
4877.3
4885
4941.4
5009.4
5017.5
4984.1
4903.9
4968.6
4937.3
4987.1
5001.9
5094.6
5177.8
5206.1
5253.1
5284.3
5266.8
5225.1
5272.8
5529.8
5535.2
5715.9
5672.2
5475.7
5435.3
5458.5
5373.3
5395.3
5515
5410.9
5400.2
5424.2
5388.5
5482.1
5506.9
5377.2
5353.5
5401.1
5438.1
5510.2
5499
5606.5
5644
5440.7


Summary of computational transaction
Raw Input view raw input (R code)
Raw Outputview raw output of R engine
Computing time1 seconds
R ServerBig Analytics Cloud Computing Center

\begin{tabular}{lllllllll}
\hline
Summary of computational transaction \tabularnewline
Raw Input view raw input (R code)  \tabularnewline
Raw Outputview raw output of R engine  \tabularnewline
Computing time1 seconds \tabularnewline
R ServerBig Analytics Cloud Computing Center \tabularnewline
\hline
\end{tabular}
%Source: https://freestatistics.org/blog/index.php?pk=302751&T=0

[TABLE]
[ROW]
Summary of computational transaction[/C][/ROW] [ROW]Raw Input[/C] view raw input (R code) [/C][/ROW] [ROW]Raw Output[/C]view raw output of R engine [/C][/ROW] [ROW]Computing time[/C]1 seconds[/C][/ROW] [ROW]R Server[/C]Big Analytics Cloud Computing Center[/C][/ROW] [/TABLE] Source: https://freestatistics.org/blog/index.php?pk=302751&T=0

Globally Unique Identifier (entire table): ba.freestatistics.org/blog/index.php?pk=302751&T=0

As an alternative you can also use a QR Code:  

The GUIDs for individual cells are displayed in the table below:

Summary of computational transaction
Raw Input view raw input (R code)
Raw Outputview raw output of R engine
Computing time1 seconds
R ServerBig Analytics Cloud Computing Center


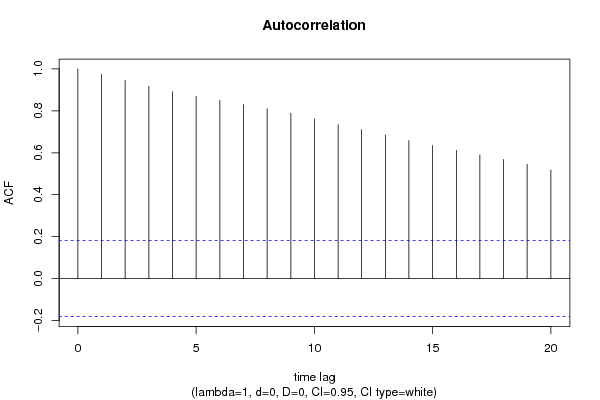
Autocorrelation Function
Time lag kACF(k)T-STATP-value
10.97495410.50060
20.94475910.17540
30.9176689.88360
40.8913839.60050
50.8687949.35720
60.8493589.14790
70.8293088.93190
80.8103398.72760
90.7888888.49660
100.7608638.19470
110.7342087.90770
120.7099747.64670
130.6841247.36820
140.6581717.08870
150.633886.82710
160.6105916.57630
170.589336.34730
180.5682826.12060
190.5441145.86030
200.5178795.57770

\begin{tabular}{lllllllll}
\hline
Autocorrelation Function \tabularnewline
Time lag k & ACF(k) & T-STAT & P-value \tabularnewline
1 & 0.974954 & 10.5006 & 0 \tabularnewline
2 & 0.944759 & 10.1754 & 0 \tabularnewline
3 & 0.917668 & 9.8836 & 0 \tabularnewline
4 & 0.891383 & 9.6005 & 0 \tabularnewline
5 & 0.868794 & 9.3572 & 0 \tabularnewline
6 & 0.849358 & 9.1479 & 0 \tabularnewline
7 & 0.829308 & 8.9319 & 0 \tabularnewline
8 & 0.810339 & 8.7276 & 0 \tabularnewline
9 & 0.788888 & 8.4966 & 0 \tabularnewline
10 & 0.760863 & 8.1947 & 0 \tabularnewline
11 & 0.734208 & 7.9077 & 0 \tabularnewline
12 & 0.709974 & 7.6467 & 0 \tabularnewline
13 & 0.684124 & 7.3682 & 0 \tabularnewline
14 & 0.658171 & 7.0887 & 0 \tabularnewline
15 & 0.63388 & 6.8271 & 0 \tabularnewline
16 & 0.610591 & 6.5763 & 0 \tabularnewline
17 & 0.58933 & 6.3473 & 0 \tabularnewline
18 & 0.568282 & 6.1206 & 0 \tabularnewline
19 & 0.544114 & 5.8603 & 0 \tabularnewline
20 & 0.517879 & 5.5777 & 0 \tabularnewline
\hline
\end{tabular}
%Source: https://freestatistics.org/blog/index.php?pk=302751&T=1

[TABLE]
[ROW][C]Autocorrelation Function[/C][/ROW]
[ROW][C]Time lag k[/C][C]ACF(k)[/C][C]T-STAT[/C][C]P-value[/C][/ROW]
[ROW][C]1[/C][C]0.974954[/C][C]10.5006[/C][C]0[/C][/ROW]
[ROW][C]2[/C][C]0.944759[/C][C]10.1754[/C][C]0[/C][/ROW]
[ROW][C]3[/C][C]0.917668[/C][C]9.8836[/C][C]0[/C][/ROW]
[ROW][C]4[/C][C]0.891383[/C][C]9.6005[/C][C]0[/C][/ROW]
[ROW][C]5[/C][C]0.868794[/C][C]9.3572[/C][C]0[/C][/ROW]
[ROW][C]6[/C][C]0.849358[/C][C]9.1479[/C][C]0[/C][/ROW]
[ROW][C]7[/C][C]0.829308[/C][C]8.9319[/C][C]0[/C][/ROW]
[ROW][C]8[/C][C]0.810339[/C][C]8.7276[/C][C]0[/C][/ROW]
[ROW][C]9[/C][C]0.788888[/C][C]8.4966[/C][C]0[/C][/ROW]
[ROW][C]10[/C][C]0.760863[/C][C]8.1947[/C][C]0[/C][/ROW]
[ROW][C]11[/C][C]0.734208[/C][C]7.9077[/C][C]0[/C][/ROW]
[ROW][C]12[/C][C]0.709974[/C][C]7.6467[/C][C]0[/C][/ROW]
[ROW][C]13[/C][C]0.684124[/C][C]7.3682[/C][C]0[/C][/ROW]
[ROW][C]14[/C][C]0.658171[/C][C]7.0887[/C][C]0[/C][/ROW]
[ROW][C]15[/C][C]0.63388[/C][C]6.8271[/C][C]0[/C][/ROW]
[ROW][C]16[/C][C]0.610591[/C][C]6.5763[/C][C]0[/C][/ROW]
[ROW][C]17[/C][C]0.58933[/C][C]6.3473[/C][C]0[/C][/ROW]
[ROW][C]18[/C][C]0.568282[/C][C]6.1206[/C][C]0[/C][/ROW]
[ROW][C]19[/C][C]0.544114[/C][C]5.8603[/C][C]0[/C][/ROW]
[ROW][C]20[/C][C]0.517879[/C][C]5.5777[/C][C]0[/C][/ROW]
[/TABLE]
Source: https://freestatistics.org/blog/index.php?pk=302751&T=1

Globally Unique Identifier (entire table): ba.freestatistics.org/blog/index.php?pk=302751&T=1

As an alternative you can also use a QR Code:  

The GUIDs for individual cells are displayed in the table below:

Autocorrelation Function
Time lag kACF(k)T-STATP-value
10.97495410.50060
20.94475910.17540
30.9176689.88360
40.8913839.60050
50.8687949.35720
60.8493589.14790
70.8293088.93190
80.8103398.72760
90.7888888.49660
100.7608638.19470
110.7342087.90770
120.7099747.64670
130.6841247.36820
140.6581717.08870
150.633886.82710
160.6105916.57630
170.589336.34730
180.5682826.12060
190.5441145.86030
200.5178795.57770


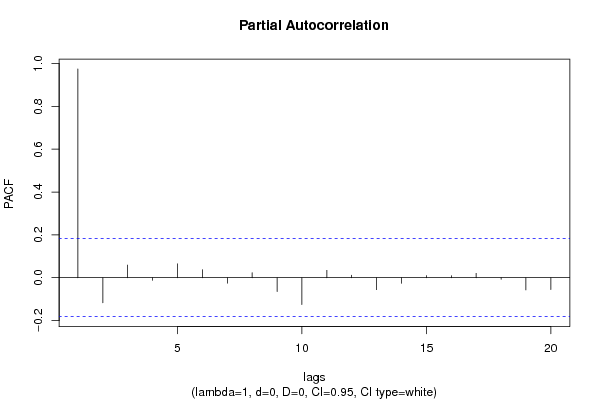
Partial Autocorrelation Function
Time lag kPACF(k)T-STATP-value
10.97495410.50060
2-0.116761-1.25750.10554
30.058630.63150.264491
4-0.012101-0.13030.448267
50.0646830.69670.243704
60.0372130.40080.344652
7-0.025358-0.27310.392626
80.0228860.24650.402869
9-0.06422-0.69170.245262
10-0.12521-1.34860.090053
110.0342190.36860.356566
120.011720.12620.449883
13-0.055785-0.60080.274567
14-0.026387-0.28420.388384
150.0097870.10540.458115
160.0088720.09560.462019
170.0201130.21660.414441
18-0.007495-0.08070.467902
19-0.057028-0.61420.27014
20-0.055212-0.59470.276616

\begin{tabular}{lllllllll}
\hline
Partial Autocorrelation Function \tabularnewline
Time lag k & PACF(k) & T-STAT & P-value \tabularnewline
1 & 0.974954 & 10.5006 & 0 \tabularnewline
2 & -0.116761 & -1.2575 & 0.10554 \tabularnewline
3 & 0.05863 & 0.6315 & 0.264491 \tabularnewline
4 & -0.012101 & -0.1303 & 0.448267 \tabularnewline
5 & 0.064683 & 0.6967 & 0.243704 \tabularnewline
6 & 0.037213 & 0.4008 & 0.344652 \tabularnewline
7 & -0.025358 & -0.2731 & 0.392626 \tabularnewline
8 & 0.022886 & 0.2465 & 0.402869 \tabularnewline
9 & -0.06422 & -0.6917 & 0.245262 \tabularnewline
10 & -0.12521 & -1.3486 & 0.090053 \tabularnewline
11 & 0.034219 & 0.3686 & 0.356566 \tabularnewline
12 & 0.01172 & 0.1262 & 0.449883 \tabularnewline
13 & -0.055785 & -0.6008 & 0.274567 \tabularnewline
14 & -0.026387 & -0.2842 & 0.388384 \tabularnewline
15 & 0.009787 & 0.1054 & 0.458115 \tabularnewline
16 & 0.008872 & 0.0956 & 0.462019 \tabularnewline
17 & 0.020113 & 0.2166 & 0.414441 \tabularnewline
18 & -0.007495 & -0.0807 & 0.467902 \tabularnewline
19 & -0.057028 & -0.6142 & 0.27014 \tabularnewline
20 & -0.055212 & -0.5947 & 0.276616 \tabularnewline
\hline
\end{tabular}
%Source: https://freestatistics.org/blog/index.php?pk=302751&T=2

[TABLE]
[ROW][C]Partial Autocorrelation Function[/C][/ROW]
[ROW][C]Time lag k[/C][C]PACF(k)[/C][C]T-STAT[/C][C]P-value[/C][/ROW]
[ROW][C]1[/C][C]0.974954[/C][C]10.5006[/C][C]0[/C][/ROW]
[ROW][C]2[/C][C]-0.116761[/C][C]-1.2575[/C][C]0.10554[/C][/ROW]
[ROW][C]3[/C][C]0.05863[/C][C]0.6315[/C][C]0.264491[/C][/ROW]
[ROW][C]4[/C][C]-0.012101[/C][C]-0.1303[/C][C]0.448267[/C][/ROW]
[ROW][C]5[/C][C]0.064683[/C][C]0.6967[/C][C]0.243704[/C][/ROW]
[ROW][C]6[/C][C]0.037213[/C][C]0.4008[/C][C]0.344652[/C][/ROW]
[ROW][C]7[/C][C]-0.025358[/C][C]-0.2731[/C][C]0.392626[/C][/ROW]
[ROW][C]8[/C][C]0.022886[/C][C]0.2465[/C][C]0.402869[/C][/ROW]
[ROW][C]9[/C][C]-0.06422[/C][C]-0.6917[/C][C]0.245262[/C][/ROW]
[ROW][C]10[/C][C]-0.12521[/C][C]-1.3486[/C][C]0.090053[/C][/ROW]
[ROW][C]11[/C][C]0.034219[/C][C]0.3686[/C][C]0.356566[/C][/ROW]
[ROW][C]12[/C][C]0.01172[/C][C]0.1262[/C][C]0.449883[/C][/ROW]
[ROW][C]13[/C][C]-0.055785[/C][C]-0.6008[/C][C]0.274567[/C][/ROW]
[ROW][C]14[/C][C]-0.026387[/C][C]-0.2842[/C][C]0.388384[/C][/ROW]
[ROW][C]15[/C][C]0.009787[/C][C]0.1054[/C][C]0.458115[/C][/ROW]
[ROW][C]16[/C][C]0.008872[/C][C]0.0956[/C][C]0.462019[/C][/ROW]
[ROW][C]17[/C][C]0.020113[/C][C]0.2166[/C][C]0.414441[/C][/ROW]
[ROW][C]18[/C][C]-0.007495[/C][C]-0.0807[/C][C]0.467902[/C][/ROW]
[ROW][C]19[/C][C]-0.057028[/C][C]-0.6142[/C][C]0.27014[/C][/ROW]
[ROW][C]20[/C][C]-0.055212[/C][C]-0.5947[/C][C]0.276616[/C][/ROW]
[/TABLE]
Source: https://freestatistics.org/blog/index.php?pk=302751&T=2

Globally Unique Identifier (entire table): ba.freestatistics.org/blog/index.php?pk=302751&T=2

As an alternative you can also use a QR Code:  

The GUIDs for individual cells are displayed in the table below:

Partial Autocorrelation Function
Time lag kPACF(k)T-STATP-value
10.97495410.50060
2-0.116761-1.25750.10554
30.058630.63150.264491
4-0.012101-0.13030.448267
50.0646830.69670.243704
60.0372130.40080.344652
7-0.025358-0.27310.392626
80.0228860.24650.402869
9-0.06422-0.69170.245262
10-0.12521-1.34860.090053
110.0342190.36860.356566
120.011720.12620.449883
13-0.055785-0.60080.274567
14-0.026387-0.28420.388384
150.0097870.10540.458115
160.0088720.09560.462019
170.0201130.21660.414441
18-0.007495-0.08070.467902
19-0.057028-0.61420.27014
20-0.055212-0.59470.276616


Parameters (Session):
par1 = Default ; par2 = 1 ; par3 = 0 ; par4 = 0 ; par5 = 12 ; par6 = White Noise ; par7 = 0.95 ;
Parameters (R input):
par1 = Default ; par2 = 1 ; par3 = 0 ; par4 = 0 ; par5 = 12 ; par6 = White Noise ; par7 = 0.95 ; par8 = ;
R code (references can be found in the software module):
par8 <- ''
par7 <- '0.95'
par6 <- 'White Noise'
par5 <- '12'
par4 <- '0'
par3 <- '1'
par2 <- '1'
par1 <- 'Default'
if (par1 == 'Default') {
par1 = 10*log10(length(x))
} else {
par1 <- as.numeric(par1)
}
par2 <- as.numeric(par2)
par3 <- as.numeric(par3)
par4 <- as.numeric(par4)
par5 <- as.numeric(par5)
if (par6 == 'White Noise') par6 <- 'white' else par6 <- 'ma'
par7 <- as.numeric(par7)
if (par8 != '') par8 <- as.numeric(par8)
x <- na.omit(x)
ox <- x
if (par8 == '') {
if (par2 == 0) {
x <- log(x)
} else {
x <- (x ^ par2 - 1) / par2
}
} else {
x <- log(x,base=par8)
}
if (par3 > 0) x <- diff(x,lag=1,difference=par3)
if (par4 > 0) x <- diff(x,lag=par5,difference=par4)
bitmap(file='picts.png')
op <- par(mfrow=c(2,1))
plot(ox,type='l',main='Original Time Series',xlab='time',ylab='value')
if (par8=='') {
mytitle <- paste('Working Time Series (lambda=',par2,', d=',par3,', D=',par4,')',sep='')
mysub <- paste('(lambda=',par2,', d=',par3,', D=',par4,', CI=', par7, ', CI type=',par6,')',sep='')
} else {
mytitle <- paste('Working Time Series (base=',par8,', d=',par3,', D=',par4,')',sep='')
mysub <- paste('(base=',par8,', d=',par3,', D=',par4,', CI=', par7, ', CI type=',par6,')',sep='')
}
plot(x,type='l', main=mytitle,xlab='time',ylab='value')
par(op)
dev.off()
bitmap(file='pic1.png')
racf <- acf(x, par1, main='Autocorrelation', xlab='time lag', ylab='ACF', ci.type=par6, ci=par7, sub=mysub)
dev.off()
bitmap(file='pic2.png')
rpacf <- pacf(x,par1,main='Partial Autocorrelation',xlab='lags',ylab='PACF',sub=mysub)
dev.off()
(myacf <- c(racf$acf))
(mypacf <- c(rpacf$acf))
lengthx <- length(x)
sqrtn <- sqrt(lengthx)
load(file='createtable')
a<-table.start()
a<-table.row.start(a)
a<-table.element(a,'Autocorrelation Function',4,TRUE)
a<-table.row.end(a)
a<-table.row.start(a)
a<-table.element(a,'Time lag k',header=TRUE)
a<-table.element(a,'ACF(k)',header=TRUE)
a<-table.element(a,'T-STAT',header=TRUE)
a<-table.element(a,'P-value',header=TRUE)
a<-table.row.end(a)
for (i in 2:(par1+1)) {
a<-table.row.start(a)
a<-table.element(a,i-1,header=TRUE)
a<-table.element(a,round(myacf[i],6))
mytstat <- myacf[i]*sqrtn
a<-table.element(a,round(mytstat,4))
a<-table.element(a,round(1-pt(abs(mytstat),lengthx),6))
a<-table.row.end(a)
}
a<-table.end(a)
table.save(a,file='mytable.tab')
a<-table.start()
a<-table.row.start(a)
a<-table.element(a,'Partial Autocorrelation Function',4,TRUE)
a<-table.row.end(a)
a<-table.row.start(a)
a<-table.element(a,'Time lag k',header=TRUE)
a<-table.element(a,'PACF(k)',header=TRUE)
a<-table.element(a,'T-STAT',header=TRUE)
a<-table.element(a,'P-value',header=TRUE)
a<-table.row.end(a)
for (i in 1:par1) {
a<-table.row.start(a)
a<-table.element(a,i,header=TRUE)
a<-table.element(a,round(mypacf[i],6))
mytstat <- mypacf[i]*sqrtn
a<-table.element(a,round(mytstat,4))
a<-table.element(a,round(1-pt(abs(mytstat),lengthx),6))
a<-table.row.end(a)
}
a<-table.end(a)
table.save(a,file='mytable1.tab')