Free Statistics

of Irreproducible Research!

Author's title

Author*The author of this computation has been verified*
R Software Modulerwasp_autocorrelation.wasp
Title produced by software(Partial) Autocorrelation Function
Date of computationThu, 22 Dec 2016 21:00:26 +0100
Cite this page as followsStatistical Computations at FreeStatistics.org, Office for Research Development and Education, URL https://freestatistics.org/blog/index.php?v=date/2016/Dec/22/t1482437731l9qf973beq2xmxt.htm/, Retrieved Fri, 01 Nov 2024 03:28:59 +0000
Statistical Computations at FreeStatistics.org, Office for Research Development and Education, URL https://freestatistics.org/blog/index.php?pk=302675, Retrieved Fri, 01 Nov 2024 03:28:59 +0000
QR Codes:

Original text written by user:
IsPrivate?No (this computation is public)
User-defined keywords
Estimated Impact114
Family? (F = Feedback message, R = changed R code, M = changed R Module, P = changed Parameters, D = changed Data)
-     [(Partial) Autocorrelation Function] [ACF1] [2016-12-22 17:08:50] [267314984f6394bb93cd815224aa34ba]
- R  D    [(Partial) Autocorrelation Function] [acf5] [2016-12-22 20:00:26] [636d0f72197ac5e1dae4a755427db02a] [Current]
Feedback Forum

Post a new message
Dataseries X:
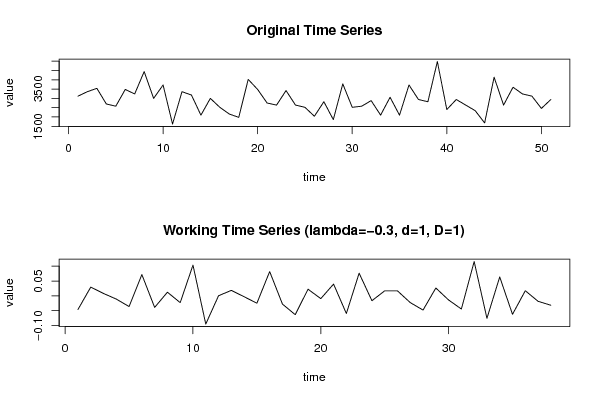
3120
3360
3540
2700
2580
3480
3240
4440
3000
3720
1620
3360
3180
2100
3000
2520
2160
1980
4020
3480
2750
2640
3420
2640
2520
2040
2820
1860
3780
2520
2580
2880
2100
3060
2100
3720
2940
2820
4980
2400
2940
2640
2340
1680
4140
2640
3600
3240
3120
2460
2940


Summary of computational transaction
Raw Input view raw input (R code)
Raw Outputview raw output of R engine
Computing time1 seconds
R ServerBig Analytics Cloud Computing Center
R Framework error message
Warning: there are blank lines in the 'Data' field.
Please, use NA for missing data - blank lines are simply
 deleted and are NOT treated as missing values.

\begin{tabular}{lllllllll}
\hline
Summary of computational transaction \tabularnewline
Raw Input view raw input (R code)  \tabularnewline
Raw Outputview raw output of R engine  \tabularnewline
Computing time1 seconds \tabularnewline
R ServerBig Analytics Cloud Computing Center \tabularnewline
R Framework error message & 
Warning: there are blank lines in the 'Data' field.
Please, use NA for missing data - blank lines are simply
 deleted and are NOT treated as missing values.
\tabularnewline \hline \end{tabular} %Source: https://freestatistics.org/blog/index.php?pk=302675&T=0

[TABLE]
[ROW]
Summary of computational transaction[/C][/ROW] [ROW]Raw Input[/C] view raw input (R code) [/C][/ROW] [ROW]Raw Output[/C]view raw output of R engine [/C][/ROW] [ROW]Computing time[/C]1 seconds[/C][/ROW] [ROW]R Server[/C]Big Analytics Cloud Computing Center[/C][/ROW] [ROW]R Framework error message[/C][C]
Warning: there are blank lines in the 'Data' field.
Please, use NA for missing data - blank lines are simply
 deleted and are NOT treated as missing values.
[/C][/ROW] [/TABLE] Source: https://freestatistics.org/blog/index.php?pk=302675&T=0

Globally Unique Identifier (entire table): ba.freestatistics.org/blog/index.php?pk=302675&T=0

As an alternative you can also use a QR Code:  

The GUIDs for individual cells are displayed in the table below:

Summary of computational transaction
Raw Input view raw input (R code)
Raw Outputview raw output of R engine
Computing time1 seconds
R ServerBig Analytics Cloud Computing Center
R Framework error message
Warning: there are blank lines in the 'Data' field.
Please, use NA for missing data - blank lines are simply
 deleted and are NOT treated as missing values.


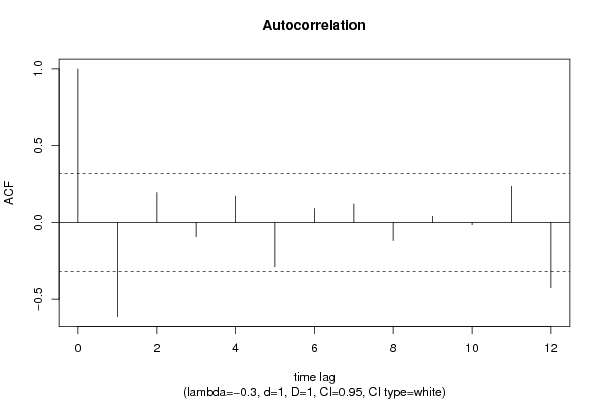
Autocorrelation Function
Time lag kACF(k)T-STATP-value
1-0.613519-3.7820.000268
20.1946251.19970.118832
3-0.092295-0.56890.28637
40.1718791.05950.148023
5-0.288584-1.7790.041624
60.0915030.56410.288012
70.1204670.74260.231143
8-0.11752-0.72440.236616
90.0407570.25120.40149
10-0.014163-0.08730.465442
110.236431.45740.076604
12-0.424769-2.61850.006308

\begin{tabular}{lllllllll}
\hline
Autocorrelation Function \tabularnewline
Time lag k & ACF(k) & T-STAT & P-value \tabularnewline
1 & -0.613519 & -3.782 & 0.000268 \tabularnewline
2 & 0.194625 & 1.1997 & 0.118832 \tabularnewline
3 & -0.092295 & -0.5689 & 0.28637 \tabularnewline
4 & 0.171879 & 1.0595 & 0.148023 \tabularnewline
5 & -0.288584 & -1.779 & 0.041624 \tabularnewline
6 & 0.091503 & 0.5641 & 0.288012 \tabularnewline
7 & 0.120467 & 0.7426 & 0.231143 \tabularnewline
8 & -0.11752 & -0.7244 & 0.236616 \tabularnewline
9 & 0.040757 & 0.2512 & 0.40149 \tabularnewline
10 & -0.014163 & -0.0873 & 0.465442 \tabularnewline
11 & 0.23643 & 1.4574 & 0.076604 \tabularnewline
12 & -0.424769 & -2.6185 & 0.006308 \tabularnewline
\hline
\end{tabular}
%Source: https://freestatistics.org/blog/index.php?pk=302675&T=1

[TABLE]
[ROW][C]Autocorrelation Function[/C][/ROW]
[ROW][C]Time lag k[/C][C]ACF(k)[/C][C]T-STAT[/C][C]P-value[/C][/ROW]
[ROW][C]1[/C][C]-0.613519[/C][C]-3.782[/C][C]0.000268[/C][/ROW]
[ROW][C]2[/C][C]0.194625[/C][C]1.1997[/C][C]0.118832[/C][/ROW]
[ROW][C]3[/C][C]-0.092295[/C][C]-0.5689[/C][C]0.28637[/C][/ROW]
[ROW][C]4[/C][C]0.171879[/C][C]1.0595[/C][C]0.148023[/C][/ROW]
[ROW][C]5[/C][C]-0.288584[/C][C]-1.779[/C][C]0.041624[/C][/ROW]
[ROW][C]6[/C][C]0.091503[/C][C]0.5641[/C][C]0.288012[/C][/ROW]
[ROW][C]7[/C][C]0.120467[/C][C]0.7426[/C][C]0.231143[/C][/ROW]
[ROW][C]8[/C][C]-0.11752[/C][C]-0.7244[/C][C]0.236616[/C][/ROW]
[ROW][C]9[/C][C]0.040757[/C][C]0.2512[/C][C]0.40149[/C][/ROW]
[ROW][C]10[/C][C]-0.014163[/C][C]-0.0873[/C][C]0.465442[/C][/ROW]
[ROW][C]11[/C][C]0.23643[/C][C]1.4574[/C][C]0.076604[/C][/ROW]
[ROW][C]12[/C][C]-0.424769[/C][C]-2.6185[/C][C]0.006308[/C][/ROW]
[/TABLE]
Source: https://freestatistics.org/blog/index.php?pk=302675&T=1

Globally Unique Identifier (entire table): ba.freestatistics.org/blog/index.php?pk=302675&T=1

As an alternative you can also use a QR Code:  

The GUIDs for individual cells are displayed in the table below:

Autocorrelation Function
Time lag kACF(k)T-STATP-value
1-0.613519-3.7820.000268
20.1946251.19970.118832
3-0.092295-0.56890.28637
40.1718791.05950.148023
5-0.288584-1.7790.041624
60.0915030.56410.288012
70.1204670.74260.231143
8-0.11752-0.72440.236616
90.0407570.25120.40149
10-0.014163-0.08730.465442
110.236431.45740.076604
12-0.424769-2.61850.006308


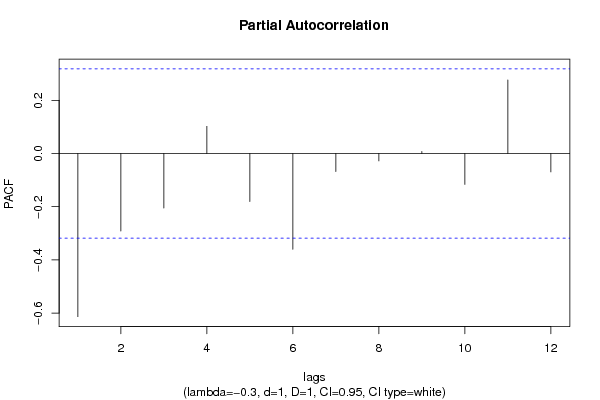
Partial Autocorrelation Function
Time lag kPACF(k)T-STATP-value
1-0.613519-3.7820.000268
2-0.291505-1.7970.040147
3-0.204915-1.26320.10711
40.1021680.62980.266295
5-0.180641-1.11350.136234
6-0.360207-2.22050.016213
7-0.067468-0.41590.339912
8-0.027854-0.17170.43229
90.0076490.04720.481319
10-0.116092-0.71560.239294
110.2766051.70510.048169
12-0.069242-0.42680.335954

\begin{tabular}{lllllllll}
\hline
Partial Autocorrelation Function \tabularnewline
Time lag k & PACF(k) & T-STAT & P-value \tabularnewline
1 & -0.613519 & -3.782 & 0.000268 \tabularnewline
2 & -0.291505 & -1.797 & 0.040147 \tabularnewline
3 & -0.204915 & -1.2632 & 0.10711 \tabularnewline
4 & 0.102168 & 0.6298 & 0.266295 \tabularnewline
5 & -0.180641 & -1.1135 & 0.136234 \tabularnewline
6 & -0.360207 & -2.2205 & 0.016213 \tabularnewline
7 & -0.067468 & -0.4159 & 0.339912 \tabularnewline
8 & -0.027854 & -0.1717 & 0.43229 \tabularnewline
9 & 0.007649 & 0.0472 & 0.481319 \tabularnewline
10 & -0.116092 & -0.7156 & 0.239294 \tabularnewline
11 & 0.276605 & 1.7051 & 0.048169 \tabularnewline
12 & -0.069242 & -0.4268 & 0.335954 \tabularnewline
\hline
\end{tabular}
%Source: https://freestatistics.org/blog/index.php?pk=302675&T=2

[TABLE]
[ROW][C]Partial Autocorrelation Function[/C][/ROW]
[ROW][C]Time lag k[/C][C]PACF(k)[/C][C]T-STAT[/C][C]P-value[/C][/ROW]
[ROW][C]1[/C][C]-0.613519[/C][C]-3.782[/C][C]0.000268[/C][/ROW]
[ROW][C]2[/C][C]-0.291505[/C][C]-1.797[/C][C]0.040147[/C][/ROW]
[ROW][C]3[/C][C]-0.204915[/C][C]-1.2632[/C][C]0.10711[/C][/ROW]
[ROW][C]4[/C][C]0.102168[/C][C]0.6298[/C][C]0.266295[/C][/ROW]
[ROW][C]5[/C][C]-0.180641[/C][C]-1.1135[/C][C]0.136234[/C][/ROW]
[ROW][C]6[/C][C]-0.360207[/C][C]-2.2205[/C][C]0.016213[/C][/ROW]
[ROW][C]7[/C][C]-0.067468[/C][C]-0.4159[/C][C]0.339912[/C][/ROW]
[ROW][C]8[/C][C]-0.027854[/C][C]-0.1717[/C][C]0.43229[/C][/ROW]
[ROW][C]9[/C][C]0.007649[/C][C]0.0472[/C][C]0.481319[/C][/ROW]
[ROW][C]10[/C][C]-0.116092[/C][C]-0.7156[/C][C]0.239294[/C][/ROW]
[ROW][C]11[/C][C]0.276605[/C][C]1.7051[/C][C]0.048169[/C][/ROW]
[ROW][C]12[/C][C]-0.069242[/C][C]-0.4268[/C][C]0.335954[/C][/ROW]
[/TABLE]
Source: https://freestatistics.org/blog/index.php?pk=302675&T=2

Globally Unique Identifier (entire table): ba.freestatistics.org/blog/index.php?pk=302675&T=2

As an alternative you can also use a QR Code:  

The GUIDs for individual cells are displayed in the table below:

Partial Autocorrelation Function
Time lag kPACF(k)T-STATP-value
1-0.613519-3.7820.000268
2-0.291505-1.7970.040147
3-0.204915-1.26320.10711
40.1021680.62980.266295
5-0.180641-1.11350.136234
6-0.360207-2.22050.016213
7-0.067468-0.41590.339912
8-0.027854-0.17170.43229
90.0076490.04720.481319
10-0.116092-0.71560.239294
110.2766051.70510.048169
12-0.069242-0.42680.335954


Parameters (Session):
par1 = 12 ; par2 = -0.3 ; par3 = 0 ; par4 = 1 ; par5 = 12 ; par6 = 3 ; par7 = 1 ; par8 = 2 ; par9 = 0 ; par10 = FALSE ;
Parameters (R input):
par1 = 12 ; par2 = -0.3 ; par3 = 1 ; par4 = 1 ; par5 = 12 ; par6 = White Noise ; par7 = 0.95 ; par8 = ;
R code (references can be found in the software module):
if (par1 == 'Default') {
par1 = 10*log10(length(x))
} else {
par1 <- as.numeric(par1)
}
par2 <- as.numeric(par2)
par3 <- as.numeric(par3)
par4 <- as.numeric(par4)
par5 <- as.numeric(par5)
if (par6 == 'White Noise') par6 <- 'white' else par6 <- 'ma'
par7 <- as.numeric(par7)
if (par8 != '') par8 <- as.numeric(par8)
x <- na.omit(x)
ox <- x
if (par8 == '') {
if (par2 == 0) {
x <- log(x)
} else {
x <- (x ^ par2 - 1) / par2
}
} else {
x <- log(x,base=par8)
}
if (par3 > 0) x <- diff(x,lag=1,difference=par3)
if (par4 > 0) x <- diff(x,lag=par5,difference=par4)
bitmap(file='picts.png')
op <- par(mfrow=c(2,1))
plot(ox,type='l',main='Original Time Series',xlab='time',ylab='value')
if (par8=='') {
mytitle <- paste('Working Time Series (lambda=',par2,', d=',par3,', D=',par4,')',sep='')
mysub <- paste('(lambda=',par2,', d=',par3,', D=',par4,', CI=', par7, ', CI type=',par6,')',sep='')
} else {
mytitle <- paste('Working Time Series (base=',par8,', d=',par3,', D=',par4,')',sep='')
mysub <- paste('(base=',par8,', d=',par3,', D=',par4,', CI=', par7, ', CI type=',par6,')',sep='')
}
plot(x,type='l', main=mytitle,xlab='time',ylab='value')
par(op)
dev.off()
bitmap(file='pic1.png')
racf <- acf(x, par1, main='Autocorrelation', xlab='time lag', ylab='ACF', ci.type=par6, ci=par7, sub=mysub)
dev.off()
bitmap(file='pic2.png')
rpacf <- pacf(x,par1,main='Partial Autocorrelation',xlab='lags',ylab='PACF',sub=mysub)
dev.off()
(myacf <- c(racf$acf))
(mypacf <- c(rpacf$acf))
lengthx <- length(x)
sqrtn <- sqrt(lengthx)
load(file='createtable')
a<-table.start()
a<-table.row.start(a)
a<-table.element(a,'Autocorrelation Function',4,TRUE)
a<-table.row.end(a)
a<-table.row.start(a)
a<-table.element(a,'Time lag k',header=TRUE)
a<-table.element(a,'ACF(k)',header=TRUE)
a<-table.element(a,'T-STAT',header=TRUE)
a<-table.element(a,'P-value',header=TRUE)
a<-table.row.end(a)
for (i in 2:(par1+1)) {
a<-table.row.start(a)
a<-table.element(a,i-1,header=TRUE)
a<-table.element(a,round(myacf[i],6))
mytstat <- myacf[i]*sqrtn
a<-table.element(a,round(mytstat,4))
a<-table.element(a,round(1-pt(abs(mytstat),lengthx),6))
a<-table.row.end(a)
}
a<-table.end(a)
table.save(a,file='mytable.tab')
a<-table.start()
a<-table.row.start(a)
a<-table.element(a,'Partial Autocorrelation Function',4,TRUE)
a<-table.row.end(a)
a<-table.row.start(a)
a<-table.element(a,'Time lag k',header=TRUE)
a<-table.element(a,'PACF(k)',header=TRUE)
a<-table.element(a,'T-STAT',header=TRUE)
a<-table.element(a,'P-value',header=TRUE)
a<-table.row.end(a)
for (i in 1:par1) {
a<-table.row.start(a)
a<-table.element(a,i,header=TRUE)
a<-table.element(a,round(mypacf[i],6))
mytstat <- mypacf[i]*sqrtn
a<-table.element(a,round(mytstat,4))
a<-table.element(a,round(1-pt(abs(mytstat),lengthx),6))
a<-table.row.end(a)
}
a<-table.end(a)
table.save(a,file='mytable1.tab')