Free Statistics

of Irreproducible Research!

Author's title

Author*The author of this computation has been verified*
R Software Modulerwasp_autocorrelation.wasp
Title produced by software(Partial) Autocorrelation Function
Date of computationThu, 22 Dec 2016 15:31:07 +0100
Cite this page as followsStatistical Computations at FreeStatistics.org, Office for Research Development and Education, URL https://freestatistics.org/blog/index.php?v=date/2016/Dec/22/t1482417131rsl90zm2wq802a5.htm/, Retrieved Fri, 01 Nov 2024 03:40:55 +0000
Statistical Computations at FreeStatistics.org, Office for Research Development and Education, URL https://freestatistics.org/blog/index.php?pk=302544, Retrieved Fri, 01 Nov 2024 03:40:55 +0000
QR Codes:

Original text written by user:
IsPrivate?No (this computation is public)
User-defined keywords
Estimated Impact136
Family? (F = Feedback message, R = changed R code, M = changed R Module, P = changed Parameters, D = changed Data)
-       [(Partial) Autocorrelation Function] [Correlation] [2016-12-22 14:31:07] [bdfd14aa8be2a979baab2700abeed4b0] [Current]
Feedback Forum

Post a new message
Dataseries X:
4861
3665
6683
6824
7811
7242
7458
7856
6477
7577
5999
4628
4144
3778
4320
4948
5132
5460
5598
5583
5917
6458
5079
4486
3763
3531
5014
5162
4880
4720
4631
4315
4268
4172
3432
2705
2359
2729
4043
4301
4576
4984
4854
4847
5038
4950
4566
3943
3328
3106
4821
4876
5691
6576
5850
6499
6244
5855
5304
4035
4167
4791
5215
5949
6459
6680
6413
6626
6642
6529
5691
4743
3535
3314
5564
6287
6738
6355
6745
7005
6575
6719
5196
4304
4967
4175
5579
7009
6997
7062
7214
6918
6874
7175
5375
4675
4422
4567
5971
6560
6415
6727
7077
6589
6800
6982
6118
4500
3195
4482
6619
6237
6520
7043
6188
6774
6118
6308
5230
4587
4976
4561
5456
5691
6163
6133


Summary of computational transaction
Raw Input view raw input (R code)
Raw Outputview raw output of R engine
Computing time2 seconds
R ServerBig Analytics Cloud Computing Center

\begin{tabular}{lllllllll}
\hline
Summary of computational transaction \tabularnewline
Raw Input view raw input (R code)  \tabularnewline
Raw Outputview raw output of R engine  \tabularnewline
Computing time2 seconds \tabularnewline
R ServerBig Analytics Cloud Computing Center \tabularnewline
\hline
\end{tabular}
%Source: https://freestatistics.org/blog/index.php?pk=302544&T=0

[TABLE]
[ROW]
Summary of computational transaction[/C][/ROW] [ROW]Raw Input[/C] view raw input (R code) [/C][/ROW] [ROW]Raw Output[/C]view raw output of R engine [/C][/ROW] [ROW]Computing time[/C]2 seconds[/C][/ROW] [ROW]R Server[/C]Big Analytics Cloud Computing Center[/C][/ROW] [/TABLE] Source: https://freestatistics.org/blog/index.php?pk=302544&T=0

Globally Unique Identifier (entire table): ba.freestatistics.org/blog/index.php?pk=302544&T=0

As an alternative you can also use a QR Code:  

The GUIDs for individual cells are displayed in the table below:

Summary of computational transaction
Raw Input view raw input (R code)
Raw Outputview raw output of R engine
Computing time2 seconds
R ServerBig Analytics Cloud Computing Center


Autocorrelation Function
Time lag kACF(k)T-STATP-value
10.7854218.81630
20.5231935.87280
30.2656852.98230.001718
40.0477010.53540.296644
5-0.036208-0.40640.342557
6-0.105672-1.18620.118894
7-0.098889-1.110.13455
8-0.047943-0.53820.29571
90.1100121.23490.109587
100.3390233.80550.00011
110.5519876.1960
120.6432047.21990
130.52295.86950
140.3105393.48580.000338
150.067590.75870.224727
16-0.11057-1.24110.10843
17-0.166728-1.87150.031796
18-0.197134-2.21280.014355
19-0.188934-2.12080.01795
20-0.144042-1.61690.054204
21-0.002673-0.030.488057
220.1967782.20880.014497
230.370664.16072.9e-05
240.4129474.63534e-06
250.2709593.04150.001432
260.0722780.81130.209358
27-0.152739-1.71450.044448
28-0.300692-3.37530.00049
29-0.353816-3.97166e-05
30-0.381124-4.27811.8e-05
31-0.334435-3.7540.000132
32-0.268828-3.01760.001542
33-0.133105-1.49410.068825
340.0781620.87740.190978
350.2419812.71620.003766
360.2947883.3090.000611
370.1851692.07850.019846
380.0045390.05090.479723
39-0.179687-2.0170.022911
40-0.296363-3.32670.000576
41-0.332499-3.73230.000143
42-0.352574-3.95766.3e-05
43-0.309036-3.46890.000358
44-0.24902-2.79520.002999
45-0.126589-1.4210.078899
460.0528210.59290.277151
470.1703391.91210.02907
480.2384792.67690.00421

\begin{tabular}{lllllllll}
\hline
Autocorrelation Function \tabularnewline
Time lag k & ACF(k) & T-STAT & P-value \tabularnewline
1 & 0.785421 & 8.8163 & 0 \tabularnewline
2 & 0.523193 & 5.8728 & 0 \tabularnewline
3 & 0.265685 & 2.9823 & 0.001718 \tabularnewline
4 & 0.047701 & 0.5354 & 0.296644 \tabularnewline
5 & -0.036208 & -0.4064 & 0.342557 \tabularnewline
6 & -0.105672 & -1.1862 & 0.118894 \tabularnewline
7 & -0.098889 & -1.11 & 0.13455 \tabularnewline
8 & -0.047943 & -0.5382 & 0.29571 \tabularnewline
9 & 0.110012 & 1.2349 & 0.109587 \tabularnewline
10 & 0.339023 & 3.8055 & 0.00011 \tabularnewline
11 & 0.551987 & 6.196 & 0 \tabularnewline
12 & 0.643204 & 7.2199 & 0 \tabularnewline
13 & 0.5229 & 5.8695 & 0 \tabularnewline
14 & 0.310539 & 3.4858 & 0.000338 \tabularnewline
15 & 0.06759 & 0.7587 & 0.224727 \tabularnewline
16 & -0.11057 & -1.2411 & 0.10843 \tabularnewline
17 & -0.166728 & -1.8715 & 0.031796 \tabularnewline
18 & -0.197134 & -2.2128 & 0.014355 \tabularnewline
19 & -0.188934 & -2.1208 & 0.01795 \tabularnewline
20 & -0.144042 & -1.6169 & 0.054204 \tabularnewline
21 & -0.002673 & -0.03 & 0.488057 \tabularnewline
22 & 0.196778 & 2.2088 & 0.014497 \tabularnewline
23 & 0.37066 & 4.1607 & 2.9e-05 \tabularnewline
24 & 0.412947 & 4.6353 & 4e-06 \tabularnewline
25 & 0.270959 & 3.0415 & 0.001432 \tabularnewline
26 & 0.072278 & 0.8113 & 0.209358 \tabularnewline
27 & -0.152739 & -1.7145 & 0.044448 \tabularnewline
28 & -0.300692 & -3.3753 & 0.00049 \tabularnewline
29 & -0.353816 & -3.9716 & 6e-05 \tabularnewline
30 & -0.381124 & -4.2781 & 1.8e-05 \tabularnewline
31 & -0.334435 & -3.754 & 0.000132 \tabularnewline
32 & -0.268828 & -3.0176 & 0.001542 \tabularnewline
33 & -0.133105 & -1.4941 & 0.068825 \tabularnewline
34 & 0.078162 & 0.8774 & 0.190978 \tabularnewline
35 & 0.241981 & 2.7162 & 0.003766 \tabularnewline
36 & 0.294788 & 3.309 & 0.000611 \tabularnewline
37 & 0.185169 & 2.0785 & 0.019846 \tabularnewline
38 & 0.004539 & 0.0509 & 0.479723 \tabularnewline
39 & -0.179687 & -2.017 & 0.022911 \tabularnewline
40 & -0.296363 & -3.3267 & 0.000576 \tabularnewline
41 & -0.332499 & -3.7323 & 0.000143 \tabularnewline
42 & -0.352574 & -3.9576 & 6.3e-05 \tabularnewline
43 & -0.309036 & -3.4689 & 0.000358 \tabularnewline
44 & -0.24902 & -2.7952 & 0.002999 \tabularnewline
45 & -0.126589 & -1.421 & 0.078899 \tabularnewline
46 & 0.052821 & 0.5929 & 0.277151 \tabularnewline
47 & 0.170339 & 1.9121 & 0.02907 \tabularnewline
48 & 0.238479 & 2.6769 & 0.00421 \tabularnewline
\hline
\end{tabular}
%Source: https://freestatistics.org/blog/index.php?pk=302544&T=1

[TABLE]
[ROW][C]Autocorrelation Function[/C][/ROW]
[ROW][C]Time lag k[/C][C]ACF(k)[/C][C]T-STAT[/C][C]P-value[/C][/ROW]
[ROW][C]1[/C][C]0.785421[/C][C]8.8163[/C][C]0[/C][/ROW]
[ROW][C]2[/C][C]0.523193[/C][C]5.8728[/C][C]0[/C][/ROW]
[ROW][C]3[/C][C]0.265685[/C][C]2.9823[/C][C]0.001718[/C][/ROW]
[ROW][C]4[/C][C]0.047701[/C][C]0.5354[/C][C]0.296644[/C][/ROW]
[ROW][C]5[/C][C]-0.036208[/C][C]-0.4064[/C][C]0.342557[/C][/ROW]
[ROW][C]6[/C][C]-0.105672[/C][C]-1.1862[/C][C]0.118894[/C][/ROW]
[ROW][C]7[/C][C]-0.098889[/C][C]-1.11[/C][C]0.13455[/C][/ROW]
[ROW][C]8[/C][C]-0.047943[/C][C]-0.5382[/C][C]0.29571[/C][/ROW]
[ROW][C]9[/C][C]0.110012[/C][C]1.2349[/C][C]0.109587[/C][/ROW]
[ROW][C]10[/C][C]0.339023[/C][C]3.8055[/C][C]0.00011[/C][/ROW]
[ROW][C]11[/C][C]0.551987[/C][C]6.196[/C][C]0[/C][/ROW]
[ROW][C]12[/C][C]0.643204[/C][C]7.2199[/C][C]0[/C][/ROW]
[ROW][C]13[/C][C]0.5229[/C][C]5.8695[/C][C]0[/C][/ROW]
[ROW][C]14[/C][C]0.310539[/C][C]3.4858[/C][C]0.000338[/C][/ROW]
[ROW][C]15[/C][C]0.06759[/C][C]0.7587[/C][C]0.224727[/C][/ROW]
[ROW][C]16[/C][C]-0.11057[/C][C]-1.2411[/C][C]0.10843[/C][/ROW]
[ROW][C]17[/C][C]-0.166728[/C][C]-1.8715[/C][C]0.031796[/C][/ROW]
[ROW][C]18[/C][C]-0.197134[/C][C]-2.2128[/C][C]0.014355[/C][/ROW]
[ROW][C]19[/C][C]-0.188934[/C][C]-2.1208[/C][C]0.01795[/C][/ROW]
[ROW][C]20[/C][C]-0.144042[/C][C]-1.6169[/C][C]0.054204[/C][/ROW]
[ROW][C]21[/C][C]-0.002673[/C][C]-0.03[/C][C]0.488057[/C][/ROW]
[ROW][C]22[/C][C]0.196778[/C][C]2.2088[/C][C]0.014497[/C][/ROW]
[ROW][C]23[/C][C]0.37066[/C][C]4.1607[/C][C]2.9e-05[/C][/ROW]
[ROW][C]24[/C][C]0.412947[/C][C]4.6353[/C][C]4e-06[/C][/ROW]
[ROW][C]25[/C][C]0.270959[/C][C]3.0415[/C][C]0.001432[/C][/ROW]
[ROW][C]26[/C][C]0.072278[/C][C]0.8113[/C][C]0.209358[/C][/ROW]
[ROW][C]27[/C][C]-0.152739[/C][C]-1.7145[/C][C]0.044448[/C][/ROW]
[ROW][C]28[/C][C]-0.300692[/C][C]-3.3753[/C][C]0.00049[/C][/ROW]
[ROW][C]29[/C][C]-0.353816[/C][C]-3.9716[/C][C]6e-05[/C][/ROW]
[ROW][C]30[/C][C]-0.381124[/C][C]-4.2781[/C][C]1.8e-05[/C][/ROW]
[ROW][C]31[/C][C]-0.334435[/C][C]-3.754[/C][C]0.000132[/C][/ROW]
[ROW][C]32[/C][C]-0.268828[/C][C]-3.0176[/C][C]0.001542[/C][/ROW]
[ROW][C]33[/C][C]-0.133105[/C][C]-1.4941[/C][C]0.068825[/C][/ROW]
[ROW][C]34[/C][C]0.078162[/C][C]0.8774[/C][C]0.190978[/C][/ROW]
[ROW][C]35[/C][C]0.241981[/C][C]2.7162[/C][C]0.003766[/C][/ROW]
[ROW][C]36[/C][C]0.294788[/C][C]3.309[/C][C]0.000611[/C][/ROW]
[ROW][C]37[/C][C]0.185169[/C][C]2.0785[/C][C]0.019846[/C][/ROW]
[ROW][C]38[/C][C]0.004539[/C][C]0.0509[/C][C]0.479723[/C][/ROW]
[ROW][C]39[/C][C]-0.179687[/C][C]-2.017[/C][C]0.022911[/C][/ROW]
[ROW][C]40[/C][C]-0.296363[/C][C]-3.3267[/C][C]0.000576[/C][/ROW]
[ROW][C]41[/C][C]-0.332499[/C][C]-3.7323[/C][C]0.000143[/C][/ROW]
[ROW][C]42[/C][C]-0.352574[/C][C]-3.9576[/C][C]6.3e-05[/C][/ROW]
[ROW][C]43[/C][C]-0.309036[/C][C]-3.4689[/C][C]0.000358[/C][/ROW]
[ROW][C]44[/C][C]-0.24902[/C][C]-2.7952[/C][C]0.002999[/C][/ROW]
[ROW][C]45[/C][C]-0.126589[/C][C]-1.421[/C][C]0.078899[/C][/ROW]
[ROW][C]46[/C][C]0.052821[/C][C]0.5929[/C][C]0.277151[/C][/ROW]
[ROW][C]47[/C][C]0.170339[/C][C]1.9121[/C][C]0.02907[/C][/ROW]
[ROW][C]48[/C][C]0.238479[/C][C]2.6769[/C][C]0.00421[/C][/ROW]
[/TABLE]
Source: https://freestatistics.org/blog/index.php?pk=302544&T=1

Globally Unique Identifier (entire table): ba.freestatistics.org/blog/index.php?pk=302544&T=1

As an alternative you can also use a QR Code:  

The GUIDs for individual cells are displayed in the table below:

Autocorrelation Function
Time lag kACF(k)T-STATP-value
10.7854218.81630
20.5231935.87280
30.2656852.98230.001718
40.0477010.53540.296644
5-0.036208-0.40640.342557
6-0.105672-1.18620.118894
7-0.098889-1.110.13455
8-0.047943-0.53820.29571
90.1100121.23490.109587
100.3390233.80550.00011
110.5519876.1960
120.6432047.21990
130.52295.86950
140.3105393.48580.000338
150.067590.75870.224727
16-0.11057-1.24110.10843
17-0.166728-1.87150.031796
18-0.197134-2.21280.014355
19-0.188934-2.12080.01795
20-0.144042-1.61690.054204
21-0.002673-0.030.488057
220.1967782.20880.014497
230.370664.16072.9e-05
240.4129474.63534e-06
250.2709593.04150.001432
260.0722780.81130.209358
27-0.152739-1.71450.044448
28-0.300692-3.37530.00049
29-0.353816-3.97166e-05
30-0.381124-4.27811.8e-05
31-0.334435-3.7540.000132
32-0.268828-3.01760.001542
33-0.133105-1.49410.068825
340.0781620.87740.190978
350.2419812.71620.003766
360.2947883.3090.000611
370.1851692.07850.019846
380.0045390.05090.479723
39-0.179687-2.0170.022911
40-0.296363-3.32670.000576
41-0.332499-3.73230.000143
42-0.352574-3.95766.3e-05
43-0.309036-3.46890.000358
44-0.24902-2.79520.002999
45-0.126589-1.4210.078899
460.0528210.59290.277151
470.1703391.91210.02907
480.2384792.67690.00421


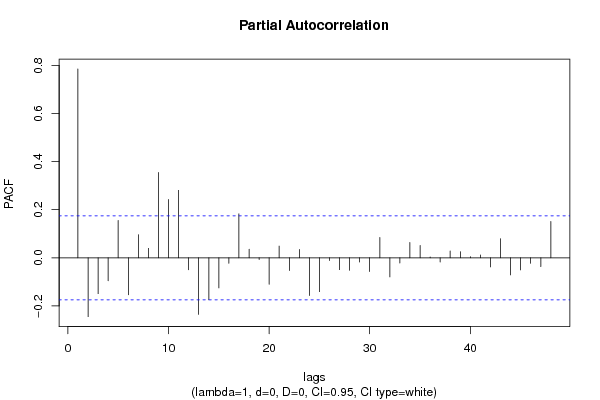
Partial Autocorrelation Function
Time lag kPACF(k)T-STATP-value
10.7854218.81630
2-0.244558-2.74520.003466
3-0.148961-1.67210.048495
4-0.09529-1.06960.143417
50.1553941.74430.041773
6-0.153875-1.72720.043288
70.096061.07830.141487
80.0393140.44130.329877
90.3549153.98395.7e-05
100.2425662.72280.003696
110.2806473.15030.001019
12-0.049245-0.55280.290701
13-0.235142-2.63950.004676
14-0.174123-1.95450.026427
15-0.124987-1.4030.081542
16-0.022812-0.25610.39916
170.1829892.0540.02102
180.0360280.40440.343298
19-0.007121-0.07990.46821
20-0.109624-1.23050.110397
210.0486780.54640.292874
22-0.052827-0.5930.277127
230.0347850.39050.348426
24-0.156653-1.75840.040552
25-0.140569-1.57790.05855
26-0.011069-0.12420.450659
27-0.049177-0.5520.29096
28-0.05135-0.57640.282686
29-0.017121-0.19220.423953
30-0.056816-0.63780.262394
310.0848180.95210.17144
32-0.07915-0.88850.187994
33-0.021438-0.24060.40511
340.0640670.71920.236689
350.0510880.57350.283679
360.003310.03720.48521
37-0.017008-0.19090.424452
380.0283470.31820.375434
390.0256260.28760.387045
400.0046980.05270.479015
410.0116560.13080.448055
42-0.037737-0.42360.336289
430.0796820.89440.186399
44-0.070796-0.79470.214145
45-0.05023-0.56380.286935
46-0.02246-0.25210.40068
47-0.036424-0.40890.341669
480.1512111.69730.04605

\begin{tabular}{lllllllll}
\hline
Partial Autocorrelation Function \tabularnewline
Time lag k & PACF(k) & T-STAT & P-value \tabularnewline
1 & 0.785421 & 8.8163 & 0 \tabularnewline
2 & -0.244558 & -2.7452 & 0.003466 \tabularnewline
3 & -0.148961 & -1.6721 & 0.048495 \tabularnewline
4 & -0.09529 & -1.0696 & 0.143417 \tabularnewline
5 & 0.155394 & 1.7443 & 0.041773 \tabularnewline
6 & -0.153875 & -1.7272 & 0.043288 \tabularnewline
7 & 0.09606 & 1.0783 & 0.141487 \tabularnewline
8 & 0.039314 & 0.4413 & 0.329877 \tabularnewline
9 & 0.354915 & 3.9839 & 5.7e-05 \tabularnewline
10 & 0.242566 & 2.7228 & 0.003696 \tabularnewline
11 & 0.280647 & 3.1503 & 0.001019 \tabularnewline
12 & -0.049245 & -0.5528 & 0.290701 \tabularnewline
13 & -0.235142 & -2.6395 & 0.004676 \tabularnewline
14 & -0.174123 & -1.9545 & 0.026427 \tabularnewline
15 & -0.124987 & -1.403 & 0.081542 \tabularnewline
16 & -0.022812 & -0.2561 & 0.39916 \tabularnewline
17 & 0.182989 & 2.054 & 0.02102 \tabularnewline
18 & 0.036028 & 0.4044 & 0.343298 \tabularnewline
19 & -0.007121 & -0.0799 & 0.46821 \tabularnewline
20 & -0.109624 & -1.2305 & 0.110397 \tabularnewline
21 & 0.048678 & 0.5464 & 0.292874 \tabularnewline
22 & -0.052827 & -0.593 & 0.277127 \tabularnewline
23 & 0.034785 & 0.3905 & 0.348426 \tabularnewline
24 & -0.156653 & -1.7584 & 0.040552 \tabularnewline
25 & -0.140569 & -1.5779 & 0.05855 \tabularnewline
26 & -0.011069 & -0.1242 & 0.450659 \tabularnewline
27 & -0.049177 & -0.552 & 0.29096 \tabularnewline
28 & -0.05135 & -0.5764 & 0.282686 \tabularnewline
29 & -0.017121 & -0.1922 & 0.423953 \tabularnewline
30 & -0.056816 & -0.6378 & 0.262394 \tabularnewline
31 & 0.084818 & 0.9521 & 0.17144 \tabularnewline
32 & -0.07915 & -0.8885 & 0.187994 \tabularnewline
33 & -0.021438 & -0.2406 & 0.40511 \tabularnewline
34 & 0.064067 & 0.7192 & 0.236689 \tabularnewline
35 & 0.051088 & 0.5735 & 0.283679 \tabularnewline
36 & 0.00331 & 0.0372 & 0.48521 \tabularnewline
37 & -0.017008 & -0.1909 & 0.424452 \tabularnewline
38 & 0.028347 & 0.3182 & 0.375434 \tabularnewline
39 & 0.025626 & 0.2876 & 0.387045 \tabularnewline
40 & 0.004698 & 0.0527 & 0.479015 \tabularnewline
41 & 0.011656 & 0.1308 & 0.448055 \tabularnewline
42 & -0.037737 & -0.4236 & 0.336289 \tabularnewline
43 & 0.079682 & 0.8944 & 0.186399 \tabularnewline
44 & -0.070796 & -0.7947 & 0.214145 \tabularnewline
45 & -0.05023 & -0.5638 & 0.286935 \tabularnewline
46 & -0.02246 & -0.2521 & 0.40068 \tabularnewline
47 & -0.036424 & -0.4089 & 0.341669 \tabularnewline
48 & 0.151211 & 1.6973 & 0.04605 \tabularnewline
\hline
\end{tabular}
%Source: https://freestatistics.org/blog/index.php?pk=302544&T=2

[TABLE]
[ROW][C]Partial Autocorrelation Function[/C][/ROW]
[ROW][C]Time lag k[/C][C]PACF(k)[/C][C]T-STAT[/C][C]P-value[/C][/ROW]
[ROW][C]1[/C][C]0.785421[/C][C]8.8163[/C][C]0[/C][/ROW]
[ROW][C]2[/C][C]-0.244558[/C][C]-2.7452[/C][C]0.003466[/C][/ROW]
[ROW][C]3[/C][C]-0.148961[/C][C]-1.6721[/C][C]0.048495[/C][/ROW]
[ROW][C]4[/C][C]-0.09529[/C][C]-1.0696[/C][C]0.143417[/C][/ROW]
[ROW][C]5[/C][C]0.155394[/C][C]1.7443[/C][C]0.041773[/C][/ROW]
[ROW][C]6[/C][C]-0.153875[/C][C]-1.7272[/C][C]0.043288[/C][/ROW]
[ROW][C]7[/C][C]0.09606[/C][C]1.0783[/C][C]0.141487[/C][/ROW]
[ROW][C]8[/C][C]0.039314[/C][C]0.4413[/C][C]0.329877[/C][/ROW]
[ROW][C]9[/C][C]0.354915[/C][C]3.9839[/C][C]5.7e-05[/C][/ROW]
[ROW][C]10[/C][C]0.242566[/C][C]2.7228[/C][C]0.003696[/C][/ROW]
[ROW][C]11[/C][C]0.280647[/C][C]3.1503[/C][C]0.001019[/C][/ROW]
[ROW][C]12[/C][C]-0.049245[/C][C]-0.5528[/C][C]0.290701[/C][/ROW]
[ROW][C]13[/C][C]-0.235142[/C][C]-2.6395[/C][C]0.004676[/C][/ROW]
[ROW][C]14[/C][C]-0.174123[/C][C]-1.9545[/C][C]0.026427[/C][/ROW]
[ROW][C]15[/C][C]-0.124987[/C][C]-1.403[/C][C]0.081542[/C][/ROW]
[ROW][C]16[/C][C]-0.022812[/C][C]-0.2561[/C][C]0.39916[/C][/ROW]
[ROW][C]17[/C][C]0.182989[/C][C]2.054[/C][C]0.02102[/C][/ROW]
[ROW][C]18[/C][C]0.036028[/C][C]0.4044[/C][C]0.343298[/C][/ROW]
[ROW][C]19[/C][C]-0.007121[/C][C]-0.0799[/C][C]0.46821[/C][/ROW]
[ROW][C]20[/C][C]-0.109624[/C][C]-1.2305[/C][C]0.110397[/C][/ROW]
[ROW][C]21[/C][C]0.048678[/C][C]0.5464[/C][C]0.292874[/C][/ROW]
[ROW][C]22[/C][C]-0.052827[/C][C]-0.593[/C][C]0.277127[/C][/ROW]
[ROW][C]23[/C][C]0.034785[/C][C]0.3905[/C][C]0.348426[/C][/ROW]
[ROW][C]24[/C][C]-0.156653[/C][C]-1.7584[/C][C]0.040552[/C][/ROW]
[ROW][C]25[/C][C]-0.140569[/C][C]-1.5779[/C][C]0.05855[/C][/ROW]
[ROW][C]26[/C][C]-0.011069[/C][C]-0.1242[/C][C]0.450659[/C][/ROW]
[ROW][C]27[/C][C]-0.049177[/C][C]-0.552[/C][C]0.29096[/C][/ROW]
[ROW][C]28[/C][C]-0.05135[/C][C]-0.5764[/C][C]0.282686[/C][/ROW]
[ROW][C]29[/C][C]-0.017121[/C][C]-0.1922[/C][C]0.423953[/C][/ROW]
[ROW][C]30[/C][C]-0.056816[/C][C]-0.6378[/C][C]0.262394[/C][/ROW]
[ROW][C]31[/C][C]0.084818[/C][C]0.9521[/C][C]0.17144[/C][/ROW]
[ROW][C]32[/C][C]-0.07915[/C][C]-0.8885[/C][C]0.187994[/C][/ROW]
[ROW][C]33[/C][C]-0.021438[/C][C]-0.2406[/C][C]0.40511[/C][/ROW]
[ROW][C]34[/C][C]0.064067[/C][C]0.7192[/C][C]0.236689[/C][/ROW]
[ROW][C]35[/C][C]0.051088[/C][C]0.5735[/C][C]0.283679[/C][/ROW]
[ROW][C]36[/C][C]0.00331[/C][C]0.0372[/C][C]0.48521[/C][/ROW]
[ROW][C]37[/C][C]-0.017008[/C][C]-0.1909[/C][C]0.424452[/C][/ROW]
[ROW][C]38[/C][C]0.028347[/C][C]0.3182[/C][C]0.375434[/C][/ROW]
[ROW][C]39[/C][C]0.025626[/C][C]0.2876[/C][C]0.387045[/C][/ROW]
[ROW][C]40[/C][C]0.004698[/C][C]0.0527[/C][C]0.479015[/C][/ROW]
[ROW][C]41[/C][C]0.011656[/C][C]0.1308[/C][C]0.448055[/C][/ROW]
[ROW][C]42[/C][C]-0.037737[/C][C]-0.4236[/C][C]0.336289[/C][/ROW]
[ROW][C]43[/C][C]0.079682[/C][C]0.8944[/C][C]0.186399[/C][/ROW]
[ROW][C]44[/C][C]-0.070796[/C][C]-0.7947[/C][C]0.214145[/C][/ROW]
[ROW][C]45[/C][C]-0.05023[/C][C]-0.5638[/C][C]0.286935[/C][/ROW]
[ROW][C]46[/C][C]-0.02246[/C][C]-0.2521[/C][C]0.40068[/C][/ROW]
[ROW][C]47[/C][C]-0.036424[/C][C]-0.4089[/C][C]0.341669[/C][/ROW]
[ROW][C]48[/C][C]0.151211[/C][C]1.6973[/C][C]0.04605[/C][/ROW]
[/TABLE]
Source: https://freestatistics.org/blog/index.php?pk=302544&T=2

Globally Unique Identifier (entire table): ba.freestatistics.org/blog/index.php?pk=302544&T=2

As an alternative you can also use a QR Code:  

The GUIDs for individual cells are displayed in the table below:

Partial Autocorrelation Function
Time lag kPACF(k)T-STATP-value
10.7854218.81630
2-0.244558-2.74520.003466
3-0.148961-1.67210.048495
4-0.09529-1.06960.143417
50.1553941.74430.041773
6-0.153875-1.72720.043288
70.096061.07830.141487
80.0393140.44130.329877
90.3549153.98395.7e-05
100.2425662.72280.003696
110.2806473.15030.001019
12-0.049245-0.55280.290701
13-0.235142-2.63950.004676
14-0.174123-1.95450.026427
15-0.124987-1.4030.081542
16-0.022812-0.25610.39916
170.1829892.0540.02102
180.0360280.40440.343298
19-0.007121-0.07990.46821
20-0.109624-1.23050.110397
210.0486780.54640.292874
22-0.052827-0.5930.277127
230.0347850.39050.348426
24-0.156653-1.75840.040552
25-0.140569-1.57790.05855
26-0.011069-0.12420.450659
27-0.049177-0.5520.29096
28-0.05135-0.57640.282686
29-0.017121-0.19220.423953
30-0.056816-0.63780.262394
310.0848180.95210.17144
32-0.07915-0.88850.187994
33-0.021438-0.24060.40511
340.0640670.71920.236689
350.0510880.57350.283679
360.003310.03720.48521
37-0.017008-0.19090.424452
380.0283470.31820.375434
390.0256260.28760.387045
400.0046980.05270.479015
410.0116560.13080.448055
42-0.037737-0.42360.336289
430.0796820.89440.186399
44-0.070796-0.79470.214145
45-0.05023-0.56380.286935
46-0.02246-0.25210.40068
47-0.036424-0.40890.341669
480.1512111.69730.04605


Parameters (Session):
Parameters (R input):
par1 = 48 ; par2 = 1 ; par3 = 0 ; par4 = 0 ; par5 = 12 ; par6 = White Noise ; par7 = 0.95 ; par8 = ;
R code (references can be found in the software module):
if (par1 == 'Default') {
par1 = 10*log10(length(x))
} else {
par1 <- as.numeric(par1)
}
par2 <- as.numeric(par2)
par3 <- as.numeric(par3)
par4 <- as.numeric(par4)
par5 <- as.numeric(par5)
if (par6 == 'White Noise') par6 <- 'white' else par6 <- 'ma'
par7 <- as.numeric(par7)
if (par8 != '') par8 <- as.numeric(par8)
x <- na.omit(x)
ox <- x
if (par8 == '') {
if (par2 == 0) {
x <- log(x)
} else {
x <- (x ^ par2 - 1) / par2
}
} else {
x <- log(x,base=par8)
}
if (par3 > 0) x <- diff(x,lag=1,difference=par3)
if (par4 > 0) x <- diff(x,lag=par5,difference=par4)
bitmap(file='picts.png')
op <- par(mfrow=c(2,1))
plot(ox,type='l',main='Original Time Series',xlab='time',ylab='value')
if (par8=='') {
mytitle <- paste('Working Time Series (lambda=',par2,', d=',par3,', D=',par4,')',sep='')
mysub <- paste('(lambda=',par2,', d=',par3,', D=',par4,', CI=', par7, ', CI type=',par6,')',sep='')
} else {
mytitle <- paste('Working Time Series (base=',par8,', d=',par3,', D=',par4,')',sep='')
mysub <- paste('(base=',par8,', d=',par3,', D=',par4,', CI=', par7, ', CI type=',par6,')',sep='')
}
plot(x,type='l', main=mytitle,xlab='time',ylab='value')
par(op)
dev.off()
bitmap(file='pic1.png')
racf <- acf(x, par1, main='Autocorrelation', xlab='time lag', ylab='ACF', ci.type=par6, ci=par7, sub=mysub)
dev.off()
bitmap(file='pic2.png')
rpacf <- pacf(x,par1,main='Partial Autocorrelation',xlab='lags',ylab='PACF',sub=mysub)
dev.off()
(myacf <- c(racf$acf))
(mypacf <- c(rpacf$acf))
lengthx <- length(x)
sqrtn <- sqrt(lengthx)
load(file='createtable')
a<-table.start()
a<-table.row.start(a)
a<-table.element(a,'Autocorrelation Function',4,TRUE)
a<-table.row.end(a)
a<-table.row.start(a)
a<-table.element(a,'Time lag k',header=TRUE)
a<-table.element(a,'ACF(k)',header=TRUE)
a<-table.element(a,'T-STAT',header=TRUE)
a<-table.element(a,'P-value',header=TRUE)
a<-table.row.end(a)
for (i in 2:(par1+1)) {
a<-table.row.start(a)
a<-table.element(a,i-1,header=TRUE)
a<-table.element(a,round(myacf[i],6))
mytstat <- myacf[i]*sqrtn
a<-table.element(a,round(mytstat,4))
a<-table.element(a,round(1-pt(abs(mytstat),lengthx),6))
a<-table.row.end(a)
}
a<-table.end(a)
table.save(a,file='mytable.tab')
a<-table.start()
a<-table.row.start(a)
a<-table.element(a,'Partial Autocorrelation Function',4,TRUE)
a<-table.row.end(a)
a<-table.row.start(a)
a<-table.element(a,'Time lag k',header=TRUE)
a<-table.element(a,'PACF(k)',header=TRUE)
a<-table.element(a,'T-STAT',header=TRUE)
a<-table.element(a,'P-value',header=TRUE)
a<-table.row.end(a)
for (i in 1:par1) {
a<-table.row.start(a)
a<-table.element(a,i,header=TRUE)
a<-table.element(a,round(mypacf[i],6))
mytstat <- mypacf[i]*sqrtn
a<-table.element(a,round(mytstat,4))
a<-table.element(a,round(1-pt(abs(mytstat),lengthx),6))
a<-table.row.end(a)
}
a<-table.end(a)
table.save(a,file='mytable1.tab')