Free Statistics

of Irreproducible Research!

Author's title

Author*The author of this computation has been verified*
R Software Modulerwasp_arimabackwardselection.wasp
Title produced by softwareARIMA Backward Selection
Date of computationWed, 21 Dec 2016 21:40:04 +0100
Cite this page as followsStatistical Computations at FreeStatistics.org, Office for Research Development and Education, URL https://freestatistics.org/blog/index.php?v=date/2016/Dec/21/t1482353485t43hc9unxp4qr6c.htm/, Retrieved Fri, 01 Nov 2024 03:48:04 +0000
Statistical Computations at FreeStatistics.org, Office for Research Development and Education, URL https://freestatistics.org/blog/index.php?pk=302501, Retrieved Fri, 01 Nov 2024 03:48:04 +0000
QR Codes:

Original text written by user:
IsPrivate?No (this computation is public)
User-defined keywords
Estimated Impact97
Family? (F = Feedback message, R = changed R code, M = changed R Module, P = changed Parameters, D = changed Data)
-       [ARIMA Backward Selection] [Paper N2163] [2016-12-21 20:40:04] [3146b6c9a81fba6ba78c11f749c05198] [Current]
Feedback Forum

Post a new message
Dataseries X:
3875
3755
4670
4335
4945
4600
4395
4345
4390
4490
4395
4690
4590
4630
5375
4655
4975
4810
4445
4660
4215
4825
4250
3945
4390
4315
4835
4835
4970
4690
4700
4855
4610
4900
4250
4105
4740
4565
5155
5320
5430
4690
4540
4575
4660
4850
4200
4360
4655
4585
5315
5115
5100
5735
5260
5050
5165
5190
4720
5275
4605
4825
5595
5160
5320
5540
4970
5445
5305
5145
4895
4555
4980
4930
5810
5210
5450
5510
5010
5495
5125
5190
4565
4255
4875
4650
5295
5045
5430
5325
4920
5445
4895
5175
4545
4220
4595
4360
4750
4985
5140
4995
5150
5240
4875
5170
4715
4370
5160
4930
5600
5385
5425
5375
5365


Summary of computational transaction
Raw Input view raw input (R code)
Raw Outputview raw output of R engine
Computing time7 seconds
R ServerBig Analytics Cloud Computing Center

\begin{tabular}{lllllllll}
\hline
Summary of computational transaction \tabularnewline
Raw Input view raw input (R code)  \tabularnewline
Raw Outputview raw output of R engine  \tabularnewline
Computing time7 seconds \tabularnewline
R ServerBig Analytics Cloud Computing Center \tabularnewline
\hline
\end{tabular}
%Source: https://freestatistics.org/blog/index.php?pk=302501&T=0

[TABLE]
[ROW]
Summary of computational transaction[/C][/ROW] [ROW]Raw Input[/C] view raw input (R code) [/C][/ROW] [ROW]Raw Output[/C]view raw output of R engine [/C][/ROW] [ROW]Computing time[/C]7 seconds[/C][/ROW] [ROW]R Server[/C]Big Analytics Cloud Computing Center[/C][/ROW] [/TABLE] Source: https://freestatistics.org/blog/index.php?pk=302501&T=0

Globally Unique Identifier (entire table): ba.freestatistics.org/blog/index.php?pk=302501&T=0

As an alternative you can also use a QR Code:  

The GUIDs for individual cells are displayed in the table below:

Summary of computational transaction
Raw Input view raw input (R code)
Raw Outputview raw output of R engine
Computing time7 seconds
R ServerBig Analytics Cloud Computing Center


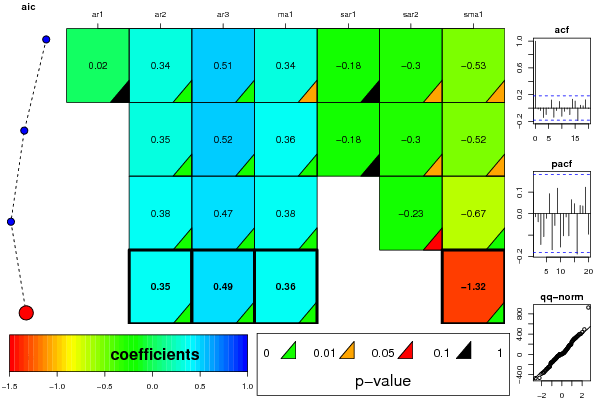
ARIMA Parameter Estimation and Backward Selection
Iterationar1ar2ar3ma1sar1sar2sma1
Estimates ( 1 )0.01610.340.51050.3417-0.1783-0.2964-0.5275
(p-val)(0.9152 )(0.0026 )(0 )(0.0307 )(0.3997 )(0.0326 )(0.0154 )
Estimates ( 2 )00.3460.51570.3551-0.1821-0.2982-0.5238
(p-val)(NA )(5e-04 )(0 )(2e-04 )(0.3818 )(0.0301 )(0.0149 )
Estimates ( 3 )00.38390.47290.380-0.2285-0.6714
(p-val)(NA )(1e-04 )(0 )(1e-04 )(NA )(0.0529 )(0 )
Estimates ( 4 )00.3510.48850.357800-1.3207
(p-val)(NA )(2e-04 )(0 )(1e-04 )(NA )(NA )(0 )
Estimates ( 5 )NANANANANANANA
(p-val)(NA )(NA )(NA )(NA )(NA )(NA )(NA )
Estimates ( 6 )NANANANANANANA
(p-val)(NA )(NA )(NA )(NA )(NA )(NA )(NA )
Estimates ( 7 )NANANANANANANA
(p-val)(NA )(NA )(NA )(NA )(NA )(NA )(NA )
Estimates ( 8 )NANANANANANANA
(p-val)(NA )(NA )(NA )(NA )(NA )(NA )(NA )
Estimates ( 9 )NANANANANANANA
(p-val)(NA )(NA )(NA )(NA )(NA )(NA )(NA )
Estimates ( 10 )NANANANANANANA
(p-val)(NA )(NA )(NA )(NA )(NA )(NA )(NA )
Estimates ( 11 )NANANANANANANA
(p-val)(NA )(NA )(NA )(NA )(NA )(NA )(NA )
Estimates ( 12 )NANANANANANANA
(p-val)(NA )(NA )(NA )(NA )(NA )(NA )(NA )
Estimates ( 13 )NANANANANANANA
(p-val)(NA )(NA )(NA )(NA )(NA )(NA )(NA )

\begin{tabular}{lllllllll}
\hline
ARIMA Parameter Estimation and Backward Selection \tabularnewline
Iteration & ar1 & ar2 & ar3 & ma1 & sar1 & sar2 & sma1 \tabularnewline
Estimates ( 1 ) & 0.0161 & 0.34 & 0.5105 & 0.3417 & -0.1783 & -0.2964 & -0.5275 \tabularnewline
(p-val) & (0.9152 ) & (0.0026 ) & (0 ) & (0.0307 ) & (0.3997 ) & (0.0326 ) & (0.0154 ) \tabularnewline
Estimates ( 2 ) & 0 & 0.346 & 0.5157 & 0.3551 & -0.1821 & -0.2982 & -0.5238 \tabularnewline
(p-val) & (NA ) & (5e-04 ) & (0 ) & (2e-04 ) & (0.3818 ) & (0.0301 ) & (0.0149 ) \tabularnewline
Estimates ( 3 ) & 0 & 0.3839 & 0.4729 & 0.38 & 0 & -0.2285 & -0.6714 \tabularnewline
(p-val) & (NA ) & (1e-04 ) & (0 ) & (1e-04 ) & (NA ) & (0.0529 ) & (0 ) \tabularnewline
Estimates ( 4 ) & 0 & 0.351 & 0.4885 & 0.3578 & 0 & 0 & -1.3207 \tabularnewline
(p-val) & (NA ) & (2e-04 ) & (0 ) & (1e-04 ) & (NA ) & (NA ) & (0 ) \tabularnewline
Estimates ( 5 ) & NA & NA & NA & NA & NA & NA & NA \tabularnewline
(p-val) & (NA ) & (NA ) & (NA ) & (NA ) & (NA ) & (NA ) & (NA ) \tabularnewline
Estimates ( 6 ) & NA & NA & NA & NA & NA & NA & NA \tabularnewline
(p-val) & (NA ) & (NA ) & (NA ) & (NA ) & (NA ) & (NA ) & (NA ) \tabularnewline
Estimates ( 7 ) & NA & NA & NA & NA & NA & NA & NA \tabularnewline
(p-val) & (NA ) & (NA ) & (NA ) & (NA ) & (NA ) & (NA ) & (NA ) \tabularnewline
Estimates ( 8 ) & NA & NA & NA & NA & NA & NA & NA \tabularnewline
(p-val) & (NA ) & (NA ) & (NA ) & (NA ) & (NA ) & (NA ) & (NA ) \tabularnewline
Estimates ( 9 ) & NA & NA & NA & NA & NA & NA & NA \tabularnewline
(p-val) & (NA ) & (NA ) & (NA ) & (NA ) & (NA ) & (NA ) & (NA ) \tabularnewline
Estimates ( 10 ) & NA & NA & NA & NA & NA & NA & NA \tabularnewline
(p-val) & (NA ) & (NA ) & (NA ) & (NA ) & (NA ) & (NA ) & (NA ) \tabularnewline
Estimates ( 11 ) & NA & NA & NA & NA & NA & NA & NA \tabularnewline
(p-val) & (NA ) & (NA ) & (NA ) & (NA ) & (NA ) & (NA ) & (NA ) \tabularnewline
Estimates ( 12 ) & NA & NA & NA & NA & NA & NA & NA \tabularnewline
(p-val) & (NA ) & (NA ) & (NA ) & (NA ) & (NA ) & (NA ) & (NA ) \tabularnewline
Estimates ( 13 ) & NA & NA & NA & NA & NA & NA & NA \tabularnewline
(p-val) & (NA ) & (NA ) & (NA ) & (NA ) & (NA ) & (NA ) & (NA ) \tabularnewline
\hline
\end{tabular}
%Source: https://freestatistics.org/blog/index.php?pk=302501&T=1

[TABLE]
[ROW][C]ARIMA Parameter Estimation and Backward Selection[/C][/ROW]
[ROW][C]Iteration[/C][C]ar1[/C][C]ar2[/C][C]ar3[/C][C]ma1[/C][C]sar1[/C][C]sar2[/C][C]sma1[/C][/ROW]
[ROW][C]Estimates ( 1 )[/C][C]0.0161[/C][C]0.34[/C][C]0.5105[/C][C]0.3417[/C][C]-0.1783[/C][C]-0.2964[/C][C]-0.5275[/C][/ROW]
[ROW][C](p-val)[/C][C](0.9152 )[/C][C](0.0026 )[/C][C](0 )[/C][C](0.0307 )[/C][C](0.3997 )[/C][C](0.0326 )[/C][C](0.0154 )[/C][/ROW]
[ROW][C]Estimates ( 2 )[/C][C]0[/C][C]0.346[/C][C]0.5157[/C][C]0.3551[/C][C]-0.1821[/C][C]-0.2982[/C][C]-0.5238[/C][/ROW]
[ROW][C](p-val)[/C][C](NA )[/C][C](5e-04 )[/C][C](0 )[/C][C](2e-04 )[/C][C](0.3818 )[/C][C](0.0301 )[/C][C](0.0149 )[/C][/ROW]
[ROW][C]Estimates ( 3 )[/C][C]0[/C][C]0.3839[/C][C]0.4729[/C][C]0.38[/C][C]0[/C][C]-0.2285[/C][C]-0.6714[/C][/ROW]
[ROW][C](p-val)[/C][C](NA )[/C][C](1e-04 )[/C][C](0 )[/C][C](1e-04 )[/C][C](NA )[/C][C](0.0529 )[/C][C](0 )[/C][/ROW]
[ROW][C]Estimates ( 4 )[/C][C]0[/C][C]0.351[/C][C]0.4885[/C][C]0.3578[/C][C]0[/C][C]0[/C][C]-1.3207[/C][/ROW]
[ROW][C](p-val)[/C][C](NA )[/C][C](2e-04 )[/C][C](0 )[/C][C](1e-04 )[/C][C](NA )[/C][C](NA )[/C][C](0 )[/C][/ROW]
[ROW][C]Estimates ( 5 )[/C][C]NA[/C][C]NA[/C][C]NA[/C][C]NA[/C][C]NA[/C][C]NA[/C][C]NA[/C][/ROW]
[ROW][C](p-val)[/C][C](NA )[/C][C](NA )[/C][C](NA )[/C][C](NA )[/C][C](NA )[/C][C](NA )[/C][C](NA )[/C][/ROW]
[ROW][C]Estimates ( 6 )[/C][C]NA[/C][C]NA[/C][C]NA[/C][C]NA[/C][C]NA[/C][C]NA[/C][C]NA[/C][/ROW]
[ROW][C](p-val)[/C][C](NA )[/C][C](NA )[/C][C](NA )[/C][C](NA )[/C][C](NA )[/C][C](NA )[/C][C](NA )[/C][/ROW]
[ROW][C]Estimates ( 7 )[/C][C]NA[/C][C]NA[/C][C]NA[/C][C]NA[/C][C]NA[/C][C]NA[/C][C]NA[/C][/ROW]
[ROW][C](p-val)[/C][C](NA )[/C][C](NA )[/C][C](NA )[/C][C](NA )[/C][C](NA )[/C][C](NA )[/C][C](NA )[/C][/ROW]
[ROW][C]Estimates ( 8 )[/C][C]NA[/C][C]NA[/C][C]NA[/C][C]NA[/C][C]NA[/C][C]NA[/C][C]NA[/C][/ROW]
[ROW][C](p-val)[/C][C](NA )[/C][C](NA )[/C][C](NA )[/C][C](NA )[/C][C](NA )[/C][C](NA )[/C][C](NA )[/C][/ROW]
[ROW][C]Estimates ( 9 )[/C][C]NA[/C][C]NA[/C][C]NA[/C][C]NA[/C][C]NA[/C][C]NA[/C][C]NA[/C][/ROW]
[ROW][C](p-val)[/C][C](NA )[/C][C](NA )[/C][C](NA )[/C][C](NA )[/C][C](NA )[/C][C](NA )[/C][C](NA )[/C][/ROW]
[ROW][C]Estimates ( 10 )[/C][C]NA[/C][C]NA[/C][C]NA[/C][C]NA[/C][C]NA[/C][C]NA[/C][C]NA[/C][/ROW]
[ROW][C](p-val)[/C][C](NA )[/C][C](NA )[/C][C](NA )[/C][C](NA )[/C][C](NA )[/C][C](NA )[/C][C](NA )[/C][/ROW]
[ROW][C]Estimates ( 11 )[/C][C]NA[/C][C]NA[/C][C]NA[/C][C]NA[/C][C]NA[/C][C]NA[/C][C]NA[/C][/ROW]
[ROW][C](p-val)[/C][C](NA )[/C][C](NA )[/C][C](NA )[/C][C](NA )[/C][C](NA )[/C][C](NA )[/C][C](NA )[/C][/ROW]
[ROW][C]Estimates ( 12 )[/C][C]NA[/C][C]NA[/C][C]NA[/C][C]NA[/C][C]NA[/C][C]NA[/C][C]NA[/C][/ROW]
[ROW][C](p-val)[/C][C](NA )[/C][C](NA )[/C][C](NA )[/C][C](NA )[/C][C](NA )[/C][C](NA )[/C][C](NA )[/C][/ROW]
[ROW][C]Estimates ( 13 )[/C][C]NA[/C][C]NA[/C][C]NA[/C][C]NA[/C][C]NA[/C][C]NA[/C][C]NA[/C][/ROW]
[ROW][C](p-val)[/C][C](NA )[/C][C](NA )[/C][C](NA )[/C][C](NA )[/C][C](NA )[/C][C](NA )[/C][C](NA )[/C][/ROW]
[/TABLE]
Source: https://freestatistics.org/blog/index.php?pk=302501&T=1

Globally Unique Identifier (entire table): ba.freestatistics.org/blog/index.php?pk=302501&T=1

As an alternative you can also use a QR Code:  

The GUIDs for individual cells are displayed in the table below:

ARIMA Parameter Estimation and Backward Selection
Iterationar1ar2ar3ma1sar1sar2sma1
Estimates ( 1 )0.01610.340.51050.3417-0.1783-0.2964-0.5275
(p-val)(0.9152 )(0.0026 )(0 )(0.0307 )(0.3997 )(0.0326 )(0.0154 )
Estimates ( 2 )00.3460.51570.3551-0.1821-0.2982-0.5238
(p-val)(NA )(5e-04 )(0 )(2e-04 )(0.3818 )(0.0301 )(0.0149 )
Estimates ( 3 )00.38390.47290.380-0.2285-0.6714
(p-val)(NA )(1e-04 )(0 )(1e-04 )(NA )(0.0529 )(0 )
Estimates ( 4 )00.3510.48850.357800-1.3207
(p-val)(NA )(2e-04 )(0 )(1e-04 )(NA )(NA )(0 )
Estimates ( 5 )NANANANANANANA
(p-val)(NA )(NA )(NA )(NA )(NA )(NA )(NA )
Estimates ( 6 )NANANANANANANA
(p-val)(NA )(NA )(NA )(NA )(NA )(NA )(NA )
Estimates ( 7 )NANANANANANANA
(p-val)(NA )(NA )(NA )(NA )(NA )(NA )(NA )
Estimates ( 8 )NANANANANANANA
(p-val)(NA )(NA )(NA )(NA )(NA )(NA )(NA )
Estimates ( 9 )NANANANANANANA
(p-val)(NA )(NA )(NA )(NA )(NA )(NA )(NA )
Estimates ( 10 )NANANANANANANA
(p-val)(NA )(NA )(NA )(NA )(NA )(NA )(NA )
Estimates ( 11 )NANANANANANANA
(p-val)(NA )(NA )(NA )(NA )(NA )(NA )(NA )
Estimates ( 12 )NANANANANANANA
(p-val)(NA )(NA )(NA )(NA )(NA )(NA )(NA )
Estimates ( 13 )NANANANANANANA
(p-val)(NA )(NA )(NA )(NA )(NA )(NA )(NA )


Estimated ARIMA Residuals
Value
4.68994266950877
404.219944528865
311.846683193867
81.305654208977
-239.783116504484
-365.690551325534
14.1070908628847
-21.3753751526442
271.182149024718
-248.806905773901
344.138818460068
-202.878412037689
-463.029506903377
31.7291973230469
141.400331337363
-93.480693991384
316.101457976834
37.4348627226207
27.2000312800344
165.606607793108
293.214129901625
186.481942222666
-27.4334736532448
-162.302775551608
-146.469078264525
355.92400218561
178.978782796676
22.5834167145821
295.765285873853
56.5059807202772
-356.757890526054
-315.440864661809
-97.3890455293967
248.216165414042
104.332775092413
-113.587804149818
1.76541127065008
69.5022147057894
114.777605508453
57.8358645231717
87.5624228418172
-242.473975947016
923.433231104919
332.985687195857
23.7776240795599
-51.7017906359784
-56.6641171445678
26.8452120077226
492.317845577131
-469.43739163203
-30.8220363533332
-19.626856709838
107.129591921221
-126.901193192856
172.22528499679
-140.884555084577
400.222822406647
185.804646857916
-149.671333257134
9.93958452357161
-382.307664962152
276.506620329727
42.2022651557897
388.268780196832
-286.939088691271
-40.8355656099545
186.417416122871
61.25758289046
259.266634839224
-115.002971369755
-42.7070407653684
-274.943926049601
-252.3368531856
90.2315639269535
-27.2418560283387
-83.3854242349839
-74.7613172382117
237.591671953156
66.6730624931696
-31.8418284927209
314.29492058836
-160.104723545138
36.1409021896849
-131.329161371886
-284.294854475612
-85.3767663279225
-161.575591696811
-328.216576566178
198.624664067341
120.276341488968
-24.4070168060616
366.493216346581
121.723736189924
-67.3221270365277
-24.5583965270945
139.919771173509
-168.909918678331
436.652332333136
133.894063790746
173.805137213911
-104.093359395382
-68.9408885910045
-106.992758387717
195.819261063415

\begin{tabular}{lllllllll}
\hline
Estimated ARIMA Residuals \tabularnewline
Value \tabularnewline
4.68994266950877 \tabularnewline
404.219944528865 \tabularnewline
311.846683193867 \tabularnewline
81.305654208977 \tabularnewline
-239.783116504484 \tabularnewline
-365.690551325534 \tabularnewline
14.1070908628847 \tabularnewline
-21.3753751526442 \tabularnewline
271.182149024718 \tabularnewline
-248.806905773901 \tabularnewline
344.138818460068 \tabularnewline
-202.878412037689 \tabularnewline
-463.029506903377 \tabularnewline
31.7291973230469 \tabularnewline
141.400331337363 \tabularnewline
-93.480693991384 \tabularnewline
316.101457976834 \tabularnewline
37.4348627226207 \tabularnewline
27.2000312800344 \tabularnewline
165.606607793108 \tabularnewline
293.214129901625 \tabularnewline
186.481942222666 \tabularnewline
-27.4334736532448 \tabularnewline
-162.302775551608 \tabularnewline
-146.469078264525 \tabularnewline
355.92400218561 \tabularnewline
178.978782796676 \tabularnewline
22.5834167145821 \tabularnewline
295.765285873853 \tabularnewline
56.5059807202772 \tabularnewline
-356.757890526054 \tabularnewline
-315.440864661809 \tabularnewline
-97.3890455293967 \tabularnewline
248.216165414042 \tabularnewline
104.332775092413 \tabularnewline
-113.587804149818 \tabularnewline
1.76541127065008 \tabularnewline
69.5022147057894 \tabularnewline
114.777605508453 \tabularnewline
57.8358645231717 \tabularnewline
87.5624228418172 \tabularnewline
-242.473975947016 \tabularnewline
923.433231104919 \tabularnewline
332.985687195857 \tabularnewline
23.7776240795599 \tabularnewline
-51.7017906359784 \tabularnewline
-56.6641171445678 \tabularnewline
26.8452120077226 \tabularnewline
492.317845577131 \tabularnewline
-469.43739163203 \tabularnewline
-30.8220363533332 \tabularnewline
-19.626856709838 \tabularnewline
107.129591921221 \tabularnewline
-126.901193192856 \tabularnewline
172.22528499679 \tabularnewline
-140.884555084577 \tabularnewline
400.222822406647 \tabularnewline
185.804646857916 \tabularnewline
-149.671333257134 \tabularnewline
9.93958452357161 \tabularnewline
-382.307664962152 \tabularnewline
276.506620329727 \tabularnewline
42.2022651557897 \tabularnewline
388.268780196832 \tabularnewline
-286.939088691271 \tabularnewline
-40.8355656099545 \tabularnewline
186.417416122871 \tabularnewline
61.25758289046 \tabularnewline
259.266634839224 \tabularnewline
-115.002971369755 \tabularnewline
-42.7070407653684 \tabularnewline
-274.943926049601 \tabularnewline
-252.3368531856 \tabularnewline
90.2315639269535 \tabularnewline
-27.2418560283387 \tabularnewline
-83.3854242349839 \tabularnewline
-74.7613172382117 \tabularnewline
237.591671953156 \tabularnewline
66.6730624931696 \tabularnewline
-31.8418284927209 \tabularnewline
314.29492058836 \tabularnewline
-160.104723545138 \tabularnewline
36.1409021896849 \tabularnewline
-131.329161371886 \tabularnewline
-284.294854475612 \tabularnewline
-85.3767663279225 \tabularnewline
-161.575591696811 \tabularnewline
-328.216576566178 \tabularnewline
198.624664067341 \tabularnewline
120.276341488968 \tabularnewline
-24.4070168060616 \tabularnewline
366.493216346581 \tabularnewline
121.723736189924 \tabularnewline
-67.3221270365277 \tabularnewline
-24.5583965270945 \tabularnewline
139.919771173509 \tabularnewline
-168.909918678331 \tabularnewline
436.652332333136 \tabularnewline
133.894063790746 \tabularnewline
173.805137213911 \tabularnewline
-104.093359395382 \tabularnewline
-68.9408885910045 \tabularnewline
-106.992758387717 \tabularnewline
195.819261063415 \tabularnewline
\hline
\end{tabular}
%Source: https://freestatistics.org/blog/index.php?pk=302501&T=2

[TABLE]
[ROW][C]Estimated ARIMA Residuals[/C][/ROW]
[ROW][C]Value[/C][/ROW]
[ROW][C]4.68994266950877[/C][/ROW]
[ROW][C]404.219944528865[/C][/ROW]
[ROW][C]311.846683193867[/C][/ROW]
[ROW][C]81.305654208977[/C][/ROW]
[ROW][C]-239.783116504484[/C][/ROW]
[ROW][C]-365.690551325534[/C][/ROW]
[ROW][C]14.1070908628847[/C][/ROW]
[ROW][C]-21.3753751526442[/C][/ROW]
[ROW][C]271.182149024718[/C][/ROW]
[ROW][C]-248.806905773901[/C][/ROW]
[ROW][C]344.138818460068[/C][/ROW]
[ROW][C]-202.878412037689[/C][/ROW]
[ROW][C]-463.029506903377[/C][/ROW]
[ROW][C]31.7291973230469[/C][/ROW]
[ROW][C]141.400331337363[/C][/ROW]
[ROW][C]-93.480693991384[/C][/ROW]
[ROW][C]316.101457976834[/C][/ROW]
[ROW][C]37.4348627226207[/C][/ROW]
[ROW][C]27.2000312800344[/C][/ROW]
[ROW][C]165.606607793108[/C][/ROW]
[ROW][C]293.214129901625[/C][/ROW]
[ROW][C]186.481942222666[/C][/ROW]
[ROW][C]-27.4334736532448[/C][/ROW]
[ROW][C]-162.302775551608[/C][/ROW]
[ROW][C]-146.469078264525[/C][/ROW]
[ROW][C]355.92400218561[/C][/ROW]
[ROW][C]178.978782796676[/C][/ROW]
[ROW][C]22.5834167145821[/C][/ROW]
[ROW][C]295.765285873853[/C][/ROW]
[ROW][C]56.5059807202772[/C][/ROW]
[ROW][C]-356.757890526054[/C][/ROW]
[ROW][C]-315.440864661809[/C][/ROW]
[ROW][C]-97.3890455293967[/C][/ROW]
[ROW][C]248.216165414042[/C][/ROW]
[ROW][C]104.332775092413[/C][/ROW]
[ROW][C]-113.587804149818[/C][/ROW]
[ROW][C]1.76541127065008[/C][/ROW]
[ROW][C]69.5022147057894[/C][/ROW]
[ROW][C]114.777605508453[/C][/ROW]
[ROW][C]57.8358645231717[/C][/ROW]
[ROW][C]87.5624228418172[/C][/ROW]
[ROW][C]-242.473975947016[/C][/ROW]
[ROW][C]923.433231104919[/C][/ROW]
[ROW][C]332.985687195857[/C][/ROW]
[ROW][C]23.7776240795599[/C][/ROW]
[ROW][C]-51.7017906359784[/C][/ROW]
[ROW][C]-56.6641171445678[/C][/ROW]
[ROW][C]26.8452120077226[/C][/ROW]
[ROW][C]492.317845577131[/C][/ROW]
[ROW][C]-469.43739163203[/C][/ROW]
[ROW][C]-30.8220363533332[/C][/ROW]
[ROW][C]-19.626856709838[/C][/ROW]
[ROW][C]107.129591921221[/C][/ROW]
[ROW][C]-126.901193192856[/C][/ROW]
[ROW][C]172.22528499679[/C][/ROW]
[ROW][C]-140.884555084577[/C][/ROW]
[ROW][C]400.222822406647[/C][/ROW]
[ROW][C]185.804646857916[/C][/ROW]
[ROW][C]-149.671333257134[/C][/ROW]
[ROW][C]9.93958452357161[/C][/ROW]
[ROW][C]-382.307664962152[/C][/ROW]
[ROW][C]276.506620329727[/C][/ROW]
[ROW][C]42.2022651557897[/C][/ROW]
[ROW][C]388.268780196832[/C][/ROW]
[ROW][C]-286.939088691271[/C][/ROW]
[ROW][C]-40.8355656099545[/C][/ROW]
[ROW][C]186.417416122871[/C][/ROW]
[ROW][C]61.25758289046[/C][/ROW]
[ROW][C]259.266634839224[/C][/ROW]
[ROW][C]-115.002971369755[/C][/ROW]
[ROW][C]-42.7070407653684[/C][/ROW]
[ROW][C]-274.943926049601[/C][/ROW]
[ROW][C]-252.3368531856[/C][/ROW]
[ROW][C]90.2315639269535[/C][/ROW]
[ROW][C]-27.2418560283387[/C][/ROW]
[ROW][C]-83.3854242349839[/C][/ROW]
[ROW][C]-74.7613172382117[/C][/ROW]
[ROW][C]237.591671953156[/C][/ROW]
[ROW][C]66.6730624931696[/C][/ROW]
[ROW][C]-31.8418284927209[/C][/ROW]
[ROW][C]314.29492058836[/C][/ROW]
[ROW][C]-160.104723545138[/C][/ROW]
[ROW][C]36.1409021896849[/C][/ROW]
[ROW][C]-131.329161371886[/C][/ROW]
[ROW][C]-284.294854475612[/C][/ROW]
[ROW][C]-85.3767663279225[/C][/ROW]
[ROW][C]-161.575591696811[/C][/ROW]
[ROW][C]-328.216576566178[/C][/ROW]
[ROW][C]198.624664067341[/C][/ROW]
[ROW][C]120.276341488968[/C][/ROW]
[ROW][C]-24.4070168060616[/C][/ROW]
[ROW][C]366.493216346581[/C][/ROW]
[ROW][C]121.723736189924[/C][/ROW]
[ROW][C]-67.3221270365277[/C][/ROW]
[ROW][C]-24.5583965270945[/C][/ROW]
[ROW][C]139.919771173509[/C][/ROW]
[ROW][C]-168.909918678331[/C][/ROW]
[ROW][C]436.652332333136[/C][/ROW]
[ROW][C]133.894063790746[/C][/ROW]
[ROW][C]173.805137213911[/C][/ROW]
[ROW][C]-104.093359395382[/C][/ROW]
[ROW][C]-68.9408885910045[/C][/ROW]
[ROW][C]-106.992758387717[/C][/ROW]
[ROW][C]195.819261063415[/C][/ROW]
[/TABLE]
Source: https://freestatistics.org/blog/index.php?pk=302501&T=2

Globally Unique Identifier (entire table): ba.freestatistics.org/blog/index.php?pk=302501&T=2

As an alternative you can also use a QR Code:  

The GUIDs for individual cells are displayed in the table below:

Estimated ARIMA Residuals
Value
4.68994266950877
404.219944528865
311.846683193867
81.305654208977
-239.783116504484
-365.690551325534
14.1070908628847
-21.3753751526442
271.182149024718
-248.806905773901
344.138818460068
-202.878412037689
-463.029506903377
31.7291973230469
141.400331337363
-93.480693991384
316.101457976834
37.4348627226207
27.2000312800344
165.606607793108
293.214129901625
186.481942222666
-27.4334736532448
-162.302775551608
-146.469078264525
355.92400218561
178.978782796676
22.5834167145821
295.765285873853
56.5059807202772
-356.757890526054
-315.440864661809
-97.3890455293967
248.216165414042
104.332775092413
-113.587804149818
1.76541127065008
69.5022147057894
114.777605508453
57.8358645231717
87.5624228418172
-242.473975947016
923.433231104919
332.985687195857
23.7776240795599
-51.7017906359784
-56.6641171445678
26.8452120077226
492.317845577131
-469.43739163203
-30.8220363533332
-19.626856709838
107.129591921221
-126.901193192856
172.22528499679
-140.884555084577
400.222822406647
185.804646857916
-149.671333257134
9.93958452357161
-382.307664962152
276.506620329727
42.2022651557897
388.268780196832
-286.939088691271
-40.8355656099545
186.417416122871
61.25758289046
259.266634839224
-115.002971369755
-42.7070407653684
-274.943926049601
-252.3368531856
90.2315639269535
-27.2418560283387
-83.3854242349839
-74.7613172382117
237.591671953156
66.6730624931696
-31.8418284927209
314.29492058836
-160.104723545138
36.1409021896849
-131.329161371886
-284.294854475612
-85.3767663279225
-161.575591696811
-328.216576566178
198.624664067341
120.276341488968
-24.4070168060616
366.493216346581
121.723736189924
-67.3221270365277
-24.5583965270945
139.919771173509
-168.909918678331
436.652332333136
133.894063790746
173.805137213911
-104.093359395382
-68.9408885910045
-106.992758387717
195.819261063415


Parameters (Session):
par1 = FALSE ; par2 = 1 ; par3 = 0 ; par4 = 1 ; par5 = 12 ; par6 = 3 ; par7 = 1 ; par8 = 2 ; par9 = 1 ;
Parameters (R input):
par1 = FALSE ; par2 = 1 ; par3 = 0 ; par4 = 1 ; par5 = 12 ; par6 = 3 ; par7 = 1 ; par8 = 2 ; par9 = 1 ;
R code (references can be found in the software module):
library(lattice)
if (par1 == 'TRUE') par1 <- TRUE
if (par1 == 'FALSE') par1 <- FALSE
par2 <- as.numeric(par2) #Box-Cox lambda transformation parameter
par3 <- as.numeric(par3) #degree of non-seasonal differencing
par4 <- as.numeric(par4) #degree of seasonal differencing
par5 <- as.numeric(par5) #seasonal period
par6 <- as.numeric(par6) #degree (p) of the non-seasonal AR(p) polynomial
par7 <- as.numeric(par7) #degree (q) of the non-seasonal MA(q) polynomial
par8 <- as.numeric(par8) #degree (P) of the seasonal AR(P) polynomial
par9 <- as.numeric(par9) #degree (Q) of the seasonal MA(Q) polynomial
armaGR <- function(arima.out, names, n){
try1 <- arima.out$coef
try2 <- sqrt(diag(arima.out$var.coef))
try.data.frame <- data.frame(matrix(NA,ncol=4,nrow=length(names)))
dimnames(try.data.frame) <- list(names,c('coef','std','tstat','pv'))
try.data.frame[,1] <- try1
for(i in 1:length(try2)) try.data.frame[which(rownames(try.data.frame)==names(try2)[i]),2] <- try2[i]
try.data.frame[,3] <- try.data.frame[,1] / try.data.frame[,2]
try.data.frame[,4] <- round((1-pt(abs(try.data.frame[,3]),df=n-(length(try2)+1)))*2,5)
vector <- rep(NA,length(names))
vector[is.na(try.data.frame[,4])] <- 0
maxi <- which.max(try.data.frame[,4])
continue <- max(try.data.frame[,4],na.rm=TRUE) > .05
vector[maxi] <- 0
list(summary=try.data.frame,next.vector=vector,continue=continue)
}
arimaSelect <- function(series, order=c(13,0,0), seasonal=list(order=c(2,0,0),period=12), include.mean=F){
nrc <- order[1]+order[3]+seasonal$order[1]+seasonal$order[3]
coeff <- matrix(NA, nrow=nrc*2, ncol=nrc)
pval <- matrix(NA, nrow=nrc*2, ncol=nrc)
mylist <- rep(list(NULL), nrc)
names <- NULL
if(order[1] > 0) names <- paste('ar',1:order[1],sep='')
if(order[3] > 0) names <- c( names , paste('ma',1:order[3],sep='') )
if(seasonal$order[1] > 0) names <- c(names, paste('sar',1:seasonal$order[1],sep=''))
if(seasonal$order[3] > 0) names <- c(names, paste('sma',1:seasonal$order[3],sep=''))
arima.out <- arima(series, order=order, seasonal=seasonal, include.mean=include.mean, method='ML')
mylist[[1]] <- arima.out
last.arma <- armaGR(arima.out, names, length(series))
mystop <- FALSE
i <- 1
coeff[i,] <- last.arma[[1]][,1]
pval [i,] <- last.arma[[1]][,4]
i <- 2
aic <- arima.out$aic
while(!mystop){
mylist[[i]] <- arima.out
arima.out <- arima(series, order=order, seasonal=seasonal, include.mean=include.mean, method='ML', fixed=last.arma$next.vector)
aic <- c(aic, arima.out$aic)
last.arma <- armaGR(arima.out, names, length(series))
mystop <- !last.arma$continue
coeff[i,] <- last.arma[[1]][,1]
pval [i,] <- last.arma[[1]][,4]
i <- i+1
}
list(coeff, pval, mylist, aic=aic)
}
arimaSelectplot <- function(arimaSelect.out,noms,choix){
noms <- names(arimaSelect.out[[3]][[1]]$coef)
coeff <- arimaSelect.out[[1]]
k <- min(which(is.na(coeff[,1])))-1
coeff <- coeff[1:k,]
pval <- arimaSelect.out[[2]][1:k,]
aic <- arimaSelect.out$aic[1:k]
coeff[coeff==0] <- NA
n <- ncol(coeff)
if(missing(choix)) choix <- k
layout(matrix(c(1,1,1,2,
3,3,3,2,
3,3,3,4,
5,6,7,7),nr=4),
widths=c(10,35,45,15),
heights=c(30,30,15,15))
couleurs <- rainbow(75)[1:50]#(50)
ticks <- pretty(coeff)
par(mar=c(1,1,3,1))
plot(aic,k:1-.5,type='o',pch=21,bg='blue',cex=2,axes=F,lty=2,xpd=NA)
points(aic[choix],k-choix+.5,pch=21,cex=4,bg=2,xpd=NA)
title('aic',line=2)
par(mar=c(3,0,0,0))
plot(0,axes=F,xlab='',ylab='',xlim=range(ticks),ylim=c(.1,1))
rect(xleft = min(ticks) + (0:49)/50*(max(ticks)-min(ticks)),
xright = min(ticks) + (1:50)/50*(max(ticks)-min(ticks)),
ytop = rep(1,50),
ybottom= rep(0,50),col=couleurs,border=NA)
axis(1,ticks)
rect(xleft=min(ticks),xright=max(ticks),ytop=1,ybottom=0)
text(mean(coeff,na.rm=T),.5,'coefficients',cex=2,font=2)
par(mar=c(1,1,3,1))
image(1:n,1:k,t(coeff[k:1,]),axes=F,col=couleurs,zlim=range(ticks))
for(i in 1:n) for(j in 1:k) if(!is.na(coeff[j,i])) {
if(pval[j,i]<.01) symb = 'green'
else if( (pval[j,i]<.05) & (pval[j,i]>=.01)) symb = 'orange'
else if( (pval[j,i]<.1) & (pval[j,i]>=.05)) symb = 'red'
else symb = 'black'
polygon(c(i+.5 ,i+.2 ,i+.5 ,i+.5),
c(k-j+0.5,k-j+0.5,k-j+0.8,k-j+0.5),
col=symb)
if(j==choix) {
rect(xleft=i-.5,
xright=i+.5,
ybottom=k-j+1.5,
ytop=k-j+.5,
lwd=4)
text(i,
k-j+1,
round(coeff[j,i],2),
cex=1.2,
font=2)
}
else{
rect(xleft=i-.5,xright=i+.5,ybottom=k-j+1.5,ytop=k-j+.5)
text(i,k-j+1,round(coeff[j,i],2),cex=1.2,font=1)
}
}
axis(3,1:n,noms)
par(mar=c(0.5,0,0,0.5))
plot(0,axes=F,xlab='',ylab='',type='n',xlim=c(0,8),ylim=c(-.2,.8))
cols <- c('green','orange','red','black')
niv <- c('0','0.01','0.05','0.1')
for(i in 0:3){
polygon(c(1+2*i ,1+2*i ,1+2*i-.5 ,1+2*i),
c(.4 ,.7 , .4 , .4),
col=cols[i+1])
text(2*i,0.5,niv[i+1],cex=1.5)
}
text(8,.5,1,cex=1.5)
text(4,0,'p-value',cex=2)
box()
residus <- arimaSelect.out[[3]][[choix]]$res
par(mar=c(1,2,4,1))
acf(residus,main='')
title('acf',line=.5)
par(mar=c(1,2,4,1))
pacf(residus,main='')
title('pacf',line=.5)
par(mar=c(2,2,4,1))
qqnorm(residus,main='')
title('qq-norm',line=.5)
qqline(residus)
residus
}
if (par2 == 0) x <- log(x)
if (par2 != 0) x <- x^par2
(selection <- arimaSelect(x, order=c(par6,par3,par7), seasonal=list(order=c(par8,par4,par9), period=par5)))
bitmap(file='test1.png')
resid <- arimaSelectplot(selection)
dev.off()
resid
bitmap(file='test2.png')
acf(resid,length(resid)/2, main='Residual Autocorrelation Function')
dev.off()
bitmap(file='test3.png')
pacf(resid,length(resid)/2, main='Residual Partial Autocorrelation Function')
dev.off()
bitmap(file='test4.png')
cpgram(resid, main='Residual Cumulative Periodogram')
dev.off()
bitmap(file='test5.png')
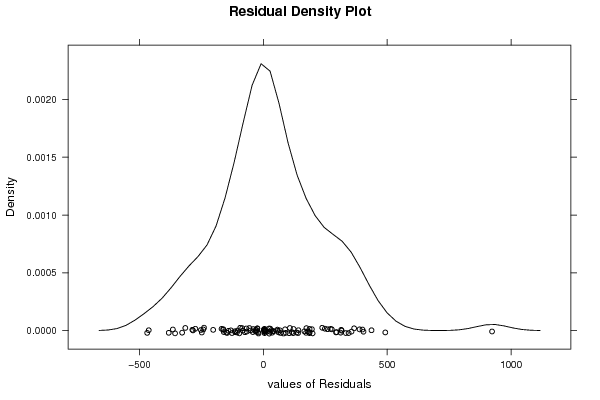
hist(resid, main='Residual Histogram', xlab='values of Residuals')
dev.off()
bitmap(file='test6.png')
densityplot(~resid,col='black',main='Residual Density Plot', xlab='values of Residuals')
dev.off()
bitmap(file='test7.png')
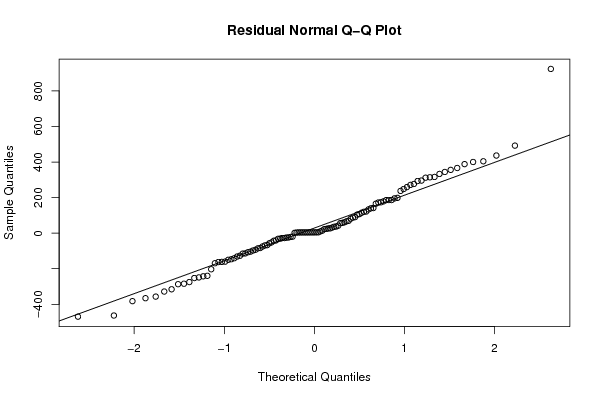
qqnorm(resid, main='Residual Normal Q-Q Plot')
qqline(resid)
dev.off()
ncols <- length(selection[[1]][1,])
nrows <- length(selection[[2]][,1])-1
load(file='createtable')
a<-table.start()
a<-table.row.start(a)
a<-table.element(a,'ARIMA Parameter Estimation and Backward Selection', ncols+1,TRUE)
a<-table.row.end(a)
a<-table.row.start(a)
a<-table.element(a,'Iteration', header=TRUE)
for (i in 1:ncols) {
a<-table.element(a,names(selection[[3]][[1]]$coef)[i],header=TRUE)
}
a<-table.row.end(a)
for (j in 1:nrows) {
a<-table.row.start(a)
mydum <- 'Estimates ('
mydum <- paste(mydum,j)
mydum <- paste(mydum,')')
a<-table.element(a,mydum, header=TRUE)
for (i in 1:ncols) {
a<-table.element(a,round(selection[[1]][j,i],4))
}
a<-table.row.end(a)
a<-table.row.start(a)
a<-table.element(a,'(p-val)', header=TRUE)
for (i in 1:ncols) {
mydum <- '('
mydum <- paste(mydum,round(selection[[2]][j,i],4),sep='')
mydum <- paste(mydum,')')
a<-table.element(a,mydum)
}
a<-table.row.end(a)
}
a<-table.end(a)
table.save(a,file='mytable.tab')
a<-table.start()
a<-table.row.start(a)
a<-table.element(a,'Estimated ARIMA Residuals', 1,TRUE)
a<-table.row.end(a)
a<-table.row.start(a)
a<-table.element(a,'Value', 1,TRUE)
a<-table.row.end(a)
for (i in (par4*par5+par3):length(resid)) {
a<-table.row.start(a)
a<-table.element(a,resid[i])
a<-table.row.end(a)
}
a<-table.end(a)
table.save(a,file='mytable1.tab')