Free Statistics

of Irreproducible Research!

Author's title

Author*The author of this computation has been verified*
R Software Modulerwasp_arimaforecasting.wasp
Title produced by softwareARIMA Forecasting
Date of computationWed, 21 Dec 2016 16:31:21 +0100
Cite this page as followsStatistical Computations at FreeStatistics.org, Office for Research Development and Education, URL https://freestatistics.org/blog/index.php?v=date/2016/Dec/21/t1482334320rt8k05xncoyd79r.htm/, Retrieved Fri, 01 Nov 2024 03:42:37 +0000
Statistical Computations at FreeStatistics.org, Office for Research Development and Education, URL https://freestatistics.org/blog/index.php?pk=302386, Retrieved Fri, 01 Nov 2024 03:42:37 +0000
QR Codes:

Original text written by user:
IsPrivate?No (this computation is public)
User-defined keywords
Estimated Impact91
Family? (F = Feedback message, R = changed R code, M = changed R Module, P = changed Parameters, D = changed Data)
-       [ARIMA Forecasting] [] [2016-12-21 15:31:21] [672675941468e072e71d9fb024f2b817] [Current]
Feedback Forum

Post a new message
Dataseries X:
5133
5155
5174
5201
5221
5205
5235
5255
5272
5299
5318
5340
5385
5430
5454
5493
5536
5565
5586
5594
5576
5544
5530
5536
5544
5564
5596
5596
5599
5591
5566
5532
5498
5484
5442
5447
5490
5544
5583
5628
5679
5691
5707
5724
5726
5745
5767
5789
5785
5785
5806
5827
5856
5896
5914
5938


Summary of computational transaction
Raw Input view raw input (R code)
Raw Outputview raw output of R engine
Computing time1 seconds
R ServerBig Analytics Cloud Computing Center

\begin{tabular}{lllllllll}
\hline
Summary of computational transaction \tabularnewline
Raw Input view raw input (R code)  \tabularnewline
Raw Outputview raw output of R engine  \tabularnewline
Computing time1 seconds \tabularnewline
R ServerBig Analytics Cloud Computing Center \tabularnewline
\hline
\end{tabular}
%Source: https://freestatistics.org/blog/index.php?pk=302386&T=0

[TABLE]
[ROW]
Summary of computational transaction[/C][/ROW] [ROW]Raw Input[/C] view raw input (R code) [/C][/ROW] [ROW]Raw Output[/C]view raw output of R engine [/C][/ROW] [ROW]Computing time[/C]1 seconds[/C][/ROW] [ROW]R Server[/C]Big Analytics Cloud Computing Center[/C][/ROW] [/TABLE] Source: https://freestatistics.org/blog/index.php?pk=302386&T=0

Globally Unique Identifier (entire table): ba.freestatistics.org/blog/index.php?pk=302386&T=0

As an alternative you can also use a QR Code:  

The GUIDs for individual cells are displayed in the table below:

Summary of computational transaction
Raw Input view raw input (R code)
Raw Outputview raw output of R engine
Computing time1 seconds
R ServerBig Analytics Cloud Computing Center


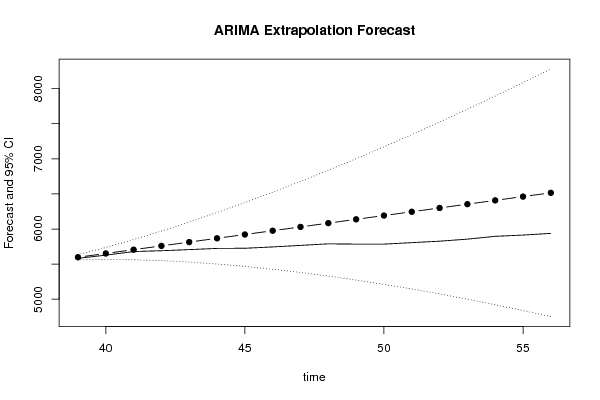
Univariate ARIMA Extrapolation Forecast
timeY[t]F[t]95% LB95% UBp-value(H0: Y[t] = F[t])P(F[t]>Y[t-1])P(F[t]>Y[t-s])P(F[t]>Y[38])
265564-------
275596-------
285596-------
295599-------
305591-------
315566-------
325532-------
335498-------
345484-------
355442-------
365447-------
375490-------
385544-------
39558355985559.58925636.41080.2220.99710.54060.9971
40562856525566.11095737.88910.2920.94230.89940.9931
41567957065562.285849.720.35640.85630.92770.9864
42569157605549.61555970.38450.26020.77480.94230.9779
43570758145529.13816098.86190.23080.80130.9560.9684
44572458685501.58456234.41550.22060.80540.96390.9585
45572659225467.51766376.48240.1990.80340.96630.9485
46574559765427.38446524.61560.20460.81410.96060.9386
47576760305381.55146678.44860.21330.80550.96220.9291
48578960845330.32616837.67390.22150.79510.95120.9199
49578561385273.97097002.02910.21160.78570.92920.9111
50578561925212.71357171.28650.20770.79230.90270.9027
51580662465146.75367345.24640.21640.79450.88140.8947
52582763005076.26867523.73140.22430.78560.85910.887
53585663545001.4177706.5830.23530.77750.8360.8798
54589664084922.34187893.65820.24970.76680.82790.8728
55591464624839.17318084.82690.2540.75290.81910.8662
56593865164752.02928279.97080.26040.74820.81060.8599

\begin{tabular}{lllllllll}
\hline
Univariate ARIMA Extrapolation Forecast \tabularnewline
time & Y[t] & F[t] & 95% LB & 95% UB & p-value(H0: Y[t] = F[t]) & P(F[t]>Y[t-1]) & P(F[t]>Y[t-s]) & P(F[t]>Y[38]) \tabularnewline
26 & 5564 & - & - & - & - & - & - & - \tabularnewline
27 & 5596 & - & - & - & - & - & - & - \tabularnewline
28 & 5596 & - & - & - & - & - & - & - \tabularnewline
29 & 5599 & - & - & - & - & - & - & - \tabularnewline
30 & 5591 & - & - & - & - & - & - & - \tabularnewline
31 & 5566 & - & - & - & - & - & - & - \tabularnewline
32 & 5532 & - & - & - & - & - & - & - \tabularnewline
33 & 5498 & - & - & - & - & - & - & - \tabularnewline
34 & 5484 & - & - & - & - & - & - & - \tabularnewline
35 & 5442 & - & - & - & - & - & - & - \tabularnewline
36 & 5447 & - & - & - & - & - & - & - \tabularnewline
37 & 5490 & - & - & - & - & - & - & - \tabularnewline
38 & 5544 & - & - & - & - & - & - & - \tabularnewline
39 & 5583 & 5598 & 5559.5892 & 5636.4108 & 0.222 & 0.9971 & 0.5406 & 0.9971 \tabularnewline
40 & 5628 & 5652 & 5566.1109 & 5737.8891 & 0.292 & 0.9423 & 0.8994 & 0.9931 \tabularnewline
41 & 5679 & 5706 & 5562.28 & 5849.72 & 0.3564 & 0.8563 & 0.9277 & 0.9864 \tabularnewline
42 & 5691 & 5760 & 5549.6155 & 5970.3845 & 0.2602 & 0.7748 & 0.9423 & 0.9779 \tabularnewline
43 & 5707 & 5814 & 5529.1381 & 6098.8619 & 0.2308 & 0.8013 & 0.956 & 0.9684 \tabularnewline
44 & 5724 & 5868 & 5501.5845 & 6234.4155 & 0.2206 & 0.8054 & 0.9639 & 0.9585 \tabularnewline
45 & 5726 & 5922 & 5467.5176 & 6376.4824 & 0.199 & 0.8034 & 0.9663 & 0.9485 \tabularnewline
46 & 5745 & 5976 & 5427.3844 & 6524.6156 & 0.2046 & 0.8141 & 0.9606 & 0.9386 \tabularnewline
47 & 5767 & 6030 & 5381.5514 & 6678.4486 & 0.2133 & 0.8055 & 0.9622 & 0.9291 \tabularnewline
48 & 5789 & 6084 & 5330.3261 & 6837.6739 & 0.2215 & 0.7951 & 0.9512 & 0.9199 \tabularnewline
49 & 5785 & 6138 & 5273.9709 & 7002.0291 & 0.2116 & 0.7857 & 0.9292 & 0.9111 \tabularnewline
50 & 5785 & 6192 & 5212.7135 & 7171.2865 & 0.2077 & 0.7923 & 0.9027 & 0.9027 \tabularnewline
51 & 5806 & 6246 & 5146.7536 & 7345.2464 & 0.2164 & 0.7945 & 0.8814 & 0.8947 \tabularnewline
52 & 5827 & 6300 & 5076.2686 & 7523.7314 & 0.2243 & 0.7856 & 0.8591 & 0.887 \tabularnewline
53 & 5856 & 6354 & 5001.417 & 7706.583 & 0.2353 & 0.7775 & 0.836 & 0.8798 \tabularnewline
54 & 5896 & 6408 & 4922.3418 & 7893.6582 & 0.2497 & 0.7668 & 0.8279 & 0.8728 \tabularnewline
55 & 5914 & 6462 & 4839.1731 & 8084.8269 & 0.254 & 0.7529 & 0.8191 & 0.8662 \tabularnewline
56 & 5938 & 6516 & 4752.0292 & 8279.9708 & 0.2604 & 0.7482 & 0.8106 & 0.8599 \tabularnewline
\hline
\end{tabular}
%Source: https://freestatistics.org/blog/index.php?pk=302386&T=1

[TABLE]
[ROW][C]Univariate ARIMA Extrapolation Forecast[/C][/ROW]
[ROW][C]time[/C][C]Y[t][/C][C]F[t][/C][C]95% LB[/C][C]95% UB[/C][C]p-value(H0: Y[t] = F[t])[/C][C]P(F[t]>Y[t-1])[/C][C]P(F[t]>Y[t-s])[/C][C]P(F[t]>Y[38])[/C][/ROW]
[ROW][C]26[/C][C]5564[/C][C]-[/C][C]-[/C][C]-[/C][C]-[/C][C]-[/C][C]-[/C][C]-[/C][/ROW]
[ROW][C]27[/C][C]5596[/C][C]-[/C][C]-[/C][C]-[/C][C]-[/C][C]-[/C][C]-[/C][C]-[/C][/ROW]
[ROW][C]28[/C][C]5596[/C][C]-[/C][C]-[/C][C]-[/C][C]-[/C][C]-[/C][C]-[/C][C]-[/C][/ROW]
[ROW][C]29[/C][C]5599[/C][C]-[/C][C]-[/C][C]-[/C][C]-[/C][C]-[/C][C]-[/C][C]-[/C][/ROW]
[ROW][C]30[/C][C]5591[/C][C]-[/C][C]-[/C][C]-[/C][C]-[/C][C]-[/C][C]-[/C][C]-[/C][/ROW]
[ROW][C]31[/C][C]5566[/C][C]-[/C][C]-[/C][C]-[/C][C]-[/C][C]-[/C][C]-[/C][C]-[/C][/ROW]
[ROW][C]32[/C][C]5532[/C][C]-[/C][C]-[/C][C]-[/C][C]-[/C][C]-[/C][C]-[/C][C]-[/C][/ROW]
[ROW][C]33[/C][C]5498[/C][C]-[/C][C]-[/C][C]-[/C][C]-[/C][C]-[/C][C]-[/C][C]-[/C][/ROW]
[ROW][C]34[/C][C]5484[/C][C]-[/C][C]-[/C][C]-[/C][C]-[/C][C]-[/C][C]-[/C][C]-[/C][/ROW]
[ROW][C]35[/C][C]5442[/C][C]-[/C][C]-[/C][C]-[/C][C]-[/C][C]-[/C][C]-[/C][C]-[/C][/ROW]
[ROW][C]36[/C][C]5447[/C][C]-[/C][C]-[/C][C]-[/C][C]-[/C][C]-[/C][C]-[/C][C]-[/C][/ROW]
[ROW][C]37[/C][C]5490[/C][C]-[/C][C]-[/C][C]-[/C][C]-[/C][C]-[/C][C]-[/C][C]-[/C][/ROW]
[ROW][C]38[/C][C]5544[/C][C]-[/C][C]-[/C][C]-[/C][C]-[/C][C]-[/C][C]-[/C][C]-[/C][/ROW]
[ROW][C]39[/C][C]5583[/C][C]5598[/C][C]5559.5892[/C][C]5636.4108[/C][C]0.222[/C][C]0.9971[/C][C]0.5406[/C][C]0.9971[/C][/ROW]
[ROW][C]40[/C][C]5628[/C][C]5652[/C][C]5566.1109[/C][C]5737.8891[/C][C]0.292[/C][C]0.9423[/C][C]0.8994[/C][C]0.9931[/C][/ROW]
[ROW][C]41[/C][C]5679[/C][C]5706[/C][C]5562.28[/C][C]5849.72[/C][C]0.3564[/C][C]0.8563[/C][C]0.9277[/C][C]0.9864[/C][/ROW]
[ROW][C]42[/C][C]5691[/C][C]5760[/C][C]5549.6155[/C][C]5970.3845[/C][C]0.2602[/C][C]0.7748[/C][C]0.9423[/C][C]0.9779[/C][/ROW]
[ROW][C]43[/C][C]5707[/C][C]5814[/C][C]5529.1381[/C][C]6098.8619[/C][C]0.2308[/C][C]0.8013[/C][C]0.956[/C][C]0.9684[/C][/ROW]
[ROW][C]44[/C][C]5724[/C][C]5868[/C][C]5501.5845[/C][C]6234.4155[/C][C]0.2206[/C][C]0.8054[/C][C]0.9639[/C][C]0.9585[/C][/ROW]
[ROW][C]45[/C][C]5726[/C][C]5922[/C][C]5467.5176[/C][C]6376.4824[/C][C]0.199[/C][C]0.8034[/C][C]0.9663[/C][C]0.9485[/C][/ROW]
[ROW][C]46[/C][C]5745[/C][C]5976[/C][C]5427.3844[/C][C]6524.6156[/C][C]0.2046[/C][C]0.8141[/C][C]0.9606[/C][C]0.9386[/C][/ROW]
[ROW][C]47[/C][C]5767[/C][C]6030[/C][C]5381.5514[/C][C]6678.4486[/C][C]0.2133[/C][C]0.8055[/C][C]0.9622[/C][C]0.9291[/C][/ROW]
[ROW][C]48[/C][C]5789[/C][C]6084[/C][C]5330.3261[/C][C]6837.6739[/C][C]0.2215[/C][C]0.7951[/C][C]0.9512[/C][C]0.9199[/C][/ROW]
[ROW][C]49[/C][C]5785[/C][C]6138[/C][C]5273.9709[/C][C]7002.0291[/C][C]0.2116[/C][C]0.7857[/C][C]0.9292[/C][C]0.9111[/C][/ROW]
[ROW][C]50[/C][C]5785[/C][C]6192[/C][C]5212.7135[/C][C]7171.2865[/C][C]0.2077[/C][C]0.7923[/C][C]0.9027[/C][C]0.9027[/C][/ROW]
[ROW][C]51[/C][C]5806[/C][C]6246[/C][C]5146.7536[/C][C]7345.2464[/C][C]0.2164[/C][C]0.7945[/C][C]0.8814[/C][C]0.8947[/C][/ROW]
[ROW][C]52[/C][C]5827[/C][C]6300[/C][C]5076.2686[/C][C]7523.7314[/C][C]0.2243[/C][C]0.7856[/C][C]0.8591[/C][C]0.887[/C][/ROW]
[ROW][C]53[/C][C]5856[/C][C]6354[/C][C]5001.417[/C][C]7706.583[/C][C]0.2353[/C][C]0.7775[/C][C]0.836[/C][C]0.8798[/C][/ROW]
[ROW][C]54[/C][C]5896[/C][C]6408[/C][C]4922.3418[/C][C]7893.6582[/C][C]0.2497[/C][C]0.7668[/C][C]0.8279[/C][C]0.8728[/C][/ROW]
[ROW][C]55[/C][C]5914[/C][C]6462[/C][C]4839.1731[/C][C]8084.8269[/C][C]0.254[/C][C]0.7529[/C][C]0.8191[/C][C]0.8662[/C][/ROW]
[ROW][C]56[/C][C]5938[/C][C]6516[/C][C]4752.0292[/C][C]8279.9708[/C][C]0.2604[/C][C]0.7482[/C][C]0.8106[/C][C]0.8599[/C][/ROW]
[/TABLE]
Source: https://freestatistics.org/blog/index.php?pk=302386&T=1

Globally Unique Identifier (entire table): ba.freestatistics.org/blog/index.php?pk=302386&T=1

As an alternative you can also use a QR Code:  

The GUIDs for individual cells are displayed in the table below:

Univariate ARIMA Extrapolation Forecast
timeY[t]F[t]95% LB95% UBp-value(H0: Y[t] = F[t])P(F[t]>Y[t-1])P(F[t]>Y[t-s])P(F[t]>Y[38])
265564-------
275596-------
285596-------
295599-------
305591-------
315566-------
325532-------
335498-------
345484-------
355442-------
365447-------
375490-------
385544-------
39558355985559.58925636.41080.2220.99710.54060.9971
40562856525566.11095737.88910.2920.94230.89940.9931
41567957065562.285849.720.35640.85630.92770.9864
42569157605549.61555970.38450.26020.77480.94230.9779
43570758145529.13816098.86190.23080.80130.9560.9684
44572458685501.58456234.41550.22060.80540.96390.9585
45572659225467.51766376.48240.1990.80340.96630.9485
46574559765427.38446524.61560.20460.81410.96060.9386
47576760305381.55146678.44860.21330.80550.96220.9291
48578960845330.32616837.67390.22150.79510.95120.9199
49578561385273.97097002.02910.21160.78570.92920.9111
50578561925212.71357171.28650.20770.79230.90270.9027
51580662465146.75367345.24640.21640.79450.88140.8947
52582763005076.26867523.73140.22430.78560.85910.887
53585663545001.4177706.5830.23530.77750.8360.8798
54589664084922.34187893.65820.24970.76680.82790.8728
55591464624839.17318084.82690.2540.75290.81910.8662
56593865164752.02928279.97080.26040.74820.81060.8599


Univariate ARIMA Extrapolation Forecast Performance
time% S.E.PEMAPEsMAPESq.EMSERMSEScaledEMASE
390.0035-0.00270.00270.002722500-0.70250.7025
400.0078-0.00430.00350.0035576400.520.0125-1.1240.9132
410.0129-0.00480.00390.003972951022.5832-1.26451.0303
420.0186-0.01210.0060.005947611572.7539.6579-3.23141.5806
430.025-0.01870.00850.008511449354859.5651-5.0112.2667
440.0319-0.02520.01130.0112207366412.666780.0791-6.74383.0129
450.0392-0.03420.01460.01443841610984.5714104.8073-9.17913.8937
460.0468-0.04020.01780.01755336116281.625127.5995-10.81824.7593
470.0549-0.04560.02090.02056916922158148.8556-12.31685.599
480.0632-0.0510.02390.02358702528644.7169.2475-13.81546.4207
490.0718-0.0610.02730.026712460937368.7273193.3099-16.53177.3398
500.0807-0.07040.03080.030116564948058.75219.2231-19.06068.3166
510.0898-0.07580.03430.033419360059254.2308243.4219-20.60619.2619
520.0991-0.08120.03760.036622372971002.4286266.4628-22.151510.1826
530.1086-0.0850.04080.039624800482802.5333287.7543-23.322311.0586
540.1183-0.08680.04370.042326214494011.375306.6127-23.97811.866
550.1281-0.09270.04660.0451300304106146.2353325.8009-25.663912.6777
560.1381-0.09730.04940.0477334084118809.4444344.6875-27.068913.4772

\begin{tabular}{lllllllll}
\hline
Univariate ARIMA Extrapolation Forecast Performance \tabularnewline
time & % S.E. & PE & MAPE & sMAPE & Sq.E & MSE & RMSE & ScaledE & MASE \tabularnewline
39 & 0.0035 & -0.0027 & 0.0027 & 0.0027 & 225 & 0 & 0 & -0.7025 & 0.7025 \tabularnewline
40 & 0.0078 & -0.0043 & 0.0035 & 0.0035 & 576 & 400.5 & 20.0125 & -1.124 & 0.9132 \tabularnewline
41 & 0.0129 & -0.0048 & 0.0039 & 0.0039 & 729 & 510 & 22.5832 & -1.2645 & 1.0303 \tabularnewline
42 & 0.0186 & -0.0121 & 0.006 & 0.0059 & 4761 & 1572.75 & 39.6579 & -3.2314 & 1.5806 \tabularnewline
43 & 0.025 & -0.0187 & 0.0085 & 0.0085 & 11449 & 3548 & 59.5651 & -5.011 & 2.2667 \tabularnewline
44 & 0.0319 & -0.0252 & 0.0113 & 0.0112 & 20736 & 6412.6667 & 80.0791 & -6.7438 & 3.0129 \tabularnewline
45 & 0.0392 & -0.0342 & 0.0146 & 0.0144 & 38416 & 10984.5714 & 104.8073 & -9.1791 & 3.8937 \tabularnewline
46 & 0.0468 & -0.0402 & 0.0178 & 0.0175 & 53361 & 16281.625 & 127.5995 & -10.8182 & 4.7593 \tabularnewline
47 & 0.0549 & -0.0456 & 0.0209 & 0.0205 & 69169 & 22158 & 148.8556 & -12.3168 & 5.599 \tabularnewline
48 & 0.0632 & -0.051 & 0.0239 & 0.0235 & 87025 & 28644.7 & 169.2475 & -13.8154 & 6.4207 \tabularnewline
49 & 0.0718 & -0.061 & 0.0273 & 0.0267 & 124609 & 37368.7273 & 193.3099 & -16.5317 & 7.3398 \tabularnewline
50 & 0.0807 & -0.0704 & 0.0308 & 0.0301 & 165649 & 48058.75 & 219.2231 & -19.0606 & 8.3166 \tabularnewline
51 & 0.0898 & -0.0758 & 0.0343 & 0.0334 & 193600 & 59254.2308 & 243.4219 & -20.6061 & 9.2619 \tabularnewline
52 & 0.0991 & -0.0812 & 0.0376 & 0.0366 & 223729 & 71002.4286 & 266.4628 & -22.1515 & 10.1826 \tabularnewline
53 & 0.1086 & -0.085 & 0.0408 & 0.0396 & 248004 & 82802.5333 & 287.7543 & -23.3223 & 11.0586 \tabularnewline
54 & 0.1183 & -0.0868 & 0.0437 & 0.0423 & 262144 & 94011.375 & 306.6127 & -23.978 & 11.866 \tabularnewline
55 & 0.1281 & -0.0927 & 0.0466 & 0.0451 & 300304 & 106146.2353 & 325.8009 & -25.6639 & 12.6777 \tabularnewline
56 & 0.1381 & -0.0973 & 0.0494 & 0.0477 & 334084 & 118809.4444 & 344.6875 & -27.0689 & 13.4772 \tabularnewline
\hline
\end{tabular}
%Source: https://freestatistics.org/blog/index.php?pk=302386&T=2

[TABLE]
[ROW][C]Univariate ARIMA Extrapolation Forecast Performance[/C][/ROW]
[ROW][C]time[/C][C]% S.E.[/C][C]PE[/C][C]MAPE[/C][C]sMAPE[/C][C]Sq.E[/C][C]MSE[/C][C]RMSE[/C][C]ScaledE[/C][C]MASE[/C][/ROW]
[ROW][C]39[/C][C]0.0035[/C][C]-0.0027[/C][C]0.0027[/C][C]0.0027[/C][C]225[/C][C]0[/C][C]0[/C][C]-0.7025[/C][C]0.7025[/C][/ROW]
[ROW][C]40[/C][C]0.0078[/C][C]-0.0043[/C][C]0.0035[/C][C]0.0035[/C][C]576[/C][C]400.5[/C][C]20.0125[/C][C]-1.124[/C][C]0.9132[/C][/ROW]
[ROW][C]41[/C][C]0.0129[/C][C]-0.0048[/C][C]0.0039[/C][C]0.0039[/C][C]729[/C][C]510[/C][C]22.5832[/C][C]-1.2645[/C][C]1.0303[/C][/ROW]
[ROW][C]42[/C][C]0.0186[/C][C]-0.0121[/C][C]0.006[/C][C]0.0059[/C][C]4761[/C][C]1572.75[/C][C]39.6579[/C][C]-3.2314[/C][C]1.5806[/C][/ROW]
[ROW][C]43[/C][C]0.025[/C][C]-0.0187[/C][C]0.0085[/C][C]0.0085[/C][C]11449[/C][C]3548[/C][C]59.5651[/C][C]-5.011[/C][C]2.2667[/C][/ROW]
[ROW][C]44[/C][C]0.0319[/C][C]-0.0252[/C][C]0.0113[/C][C]0.0112[/C][C]20736[/C][C]6412.6667[/C][C]80.0791[/C][C]-6.7438[/C][C]3.0129[/C][/ROW]
[ROW][C]45[/C][C]0.0392[/C][C]-0.0342[/C][C]0.0146[/C][C]0.0144[/C][C]38416[/C][C]10984.5714[/C][C]104.8073[/C][C]-9.1791[/C][C]3.8937[/C][/ROW]
[ROW][C]46[/C][C]0.0468[/C][C]-0.0402[/C][C]0.0178[/C][C]0.0175[/C][C]53361[/C][C]16281.625[/C][C]127.5995[/C][C]-10.8182[/C][C]4.7593[/C][/ROW]
[ROW][C]47[/C][C]0.0549[/C][C]-0.0456[/C][C]0.0209[/C][C]0.0205[/C][C]69169[/C][C]22158[/C][C]148.8556[/C][C]-12.3168[/C][C]5.599[/C][/ROW]
[ROW][C]48[/C][C]0.0632[/C][C]-0.051[/C][C]0.0239[/C][C]0.0235[/C][C]87025[/C][C]28644.7[/C][C]169.2475[/C][C]-13.8154[/C][C]6.4207[/C][/ROW]
[ROW][C]49[/C][C]0.0718[/C][C]-0.061[/C][C]0.0273[/C][C]0.0267[/C][C]124609[/C][C]37368.7273[/C][C]193.3099[/C][C]-16.5317[/C][C]7.3398[/C][/ROW]
[ROW][C]50[/C][C]0.0807[/C][C]-0.0704[/C][C]0.0308[/C][C]0.0301[/C][C]165649[/C][C]48058.75[/C][C]219.2231[/C][C]-19.0606[/C][C]8.3166[/C][/ROW]
[ROW][C]51[/C][C]0.0898[/C][C]-0.0758[/C][C]0.0343[/C][C]0.0334[/C][C]193600[/C][C]59254.2308[/C][C]243.4219[/C][C]-20.6061[/C][C]9.2619[/C][/ROW]
[ROW][C]52[/C][C]0.0991[/C][C]-0.0812[/C][C]0.0376[/C][C]0.0366[/C][C]223729[/C][C]71002.4286[/C][C]266.4628[/C][C]-22.1515[/C][C]10.1826[/C][/ROW]
[ROW][C]53[/C][C]0.1086[/C][C]-0.085[/C][C]0.0408[/C][C]0.0396[/C][C]248004[/C][C]82802.5333[/C][C]287.7543[/C][C]-23.3223[/C][C]11.0586[/C][/ROW]
[ROW][C]54[/C][C]0.1183[/C][C]-0.0868[/C][C]0.0437[/C][C]0.0423[/C][C]262144[/C][C]94011.375[/C][C]306.6127[/C][C]-23.978[/C][C]11.866[/C][/ROW]
[ROW][C]55[/C][C]0.1281[/C][C]-0.0927[/C][C]0.0466[/C][C]0.0451[/C][C]300304[/C][C]106146.2353[/C][C]325.8009[/C][C]-25.6639[/C][C]12.6777[/C][/ROW]
[ROW][C]56[/C][C]0.1381[/C][C]-0.0973[/C][C]0.0494[/C][C]0.0477[/C][C]334084[/C][C]118809.4444[/C][C]344.6875[/C][C]-27.0689[/C][C]13.4772[/C][/ROW]
[/TABLE]
Source: https://freestatistics.org/blog/index.php?pk=302386&T=2

Globally Unique Identifier (entire table): ba.freestatistics.org/blog/index.php?pk=302386&T=2

As an alternative you can also use a QR Code:  

The GUIDs for individual cells are displayed in the table below:

Univariate ARIMA Extrapolation Forecast Performance
time% S.E.PEMAPEsMAPESq.EMSERMSEScaledEMASE
390.0035-0.00270.00270.002722500-0.70250.7025
400.0078-0.00430.00350.0035576400.520.0125-1.1240.9132
410.0129-0.00480.00390.003972951022.5832-1.26451.0303
420.0186-0.01210.0060.005947611572.7539.6579-3.23141.5806
430.025-0.01870.00850.008511449354859.5651-5.0112.2667
440.0319-0.02520.01130.0112207366412.666780.0791-6.74383.0129
450.0392-0.03420.01460.01443841610984.5714104.8073-9.17913.8937
460.0468-0.04020.01780.01755336116281.625127.5995-10.81824.7593
470.0549-0.04560.02090.02056916922158148.8556-12.31685.599
480.0632-0.0510.02390.02358702528644.7169.2475-13.81546.4207
490.0718-0.0610.02730.026712460937368.7273193.3099-16.53177.3398
500.0807-0.07040.03080.030116564948058.75219.2231-19.06068.3166
510.0898-0.07580.03430.033419360059254.2308243.4219-20.60619.2619
520.0991-0.08120.03760.036622372971002.4286266.4628-22.151510.1826
530.1086-0.0850.04080.039624800482802.5333287.7543-23.322311.0586
540.1183-0.08680.04370.042326214494011.375306.6127-23.97811.866
550.1281-0.09270.04660.0451300304106146.2353325.8009-25.663912.6777
560.1381-0.09730.04940.0477334084118809.4444344.6875-27.068913.4772


Parameters (Session):
par1 = additive ; par2 = 12 ;
Parameters (R input):
par1 = 18 ; par2 = 1 ; par3 = 2 ; par4 = 0 ; par5 = 12 ; par6 = 0 ; par7 = 0 ; par8 = 0 ; par9 = 0 ; par10 = FALSE ;
R code (references can be found in the software module):
par10 <- 'FALSE'
par9 <- '0'
par8 <- '0'
par7 <- '0'
par6 <- '0'
par5 <- '12'
par4 <- '0'
par3 <- '2'
par2 <- '1'
par1 <- '15'
par1 <- as.numeric(par1) #cut off periods
par2 <- as.numeric(par2) #lambda
par3 <- as.numeric(par3) #degree of non-seasonal differencing
par4 <- as.numeric(par4) #degree of seasonal differencing
par5 <- as.numeric(par5) #seasonal period
par6 <- as.numeric(par6) #p
par7 <- as.numeric(par7) #q
par8 <- as.numeric(par8) #P
par9 <- as.numeric(par9) #Q
if (par10 == 'TRUE') par10 <- TRUE
if (par10 == 'FALSE') par10 <- FALSE
if (par2 == 0) x <- log(x)
if (par2 != 0) x <- x^par2
lx <- length(x)
first <- lx - 2*par1
nx <- lx - par1
nx1 <- nx + 1
fx <- lx - nx
if (fx < 1) {
fx <- par5*2
nx1 <- lx + fx - 1
first <- lx - 2*fx
}
first <- 1
if (fx < 3) fx <- round(lx/10,0)
(arima.out <- arima(x[1:nx], order=c(par6,par3,par7), seasonal=list(order=c(par8,par4,par9), period=par5), include.mean=par10, method='ML'))
(forecast <- predict(arima.out,fx))
(lb <- forecast$pred - 1.96 * forecast$se)
(ub <- forecast$pred + 1.96 * forecast$se)
if (par2 == 0) {
x <- exp(x)
forecast$pred <- exp(forecast$pred)
lb <- exp(lb)
ub <- exp(ub)
}
if (par2 != 0) {
x <- x^(1/par2)
forecast$pred <- forecast$pred^(1/par2)
lb <- lb^(1/par2)
ub <- ub^(1/par2)
}
if (par2 < 0) {
olb <- lb
lb <- ub
ub <- olb
}
(actandfor <- c(x[1:nx], forecast$pred))
(perc.se <- (ub-forecast$pred)/1.96/forecast$pred)
bitmap(file='test1.png')
opar <- par(mar=c(4,4,2,2),las=1)
ylim <- c( min(x[first:nx],lb), max(x[first:nx],ub))
plot(x,ylim=ylim,type='n',xlim=c(first,lx))
usr <- par('usr')
rect(usr[1],usr[3],nx+1,usr[4],border=NA,col='lemonchiffon')
rect(nx1,usr[3],usr[2],usr[4],border=NA,col='lavender')
abline(h= (-3:3)*2 , col ='gray', lty =3)
polygon( c(nx1:lx,lx:nx1), c(lb,rev(ub)), col = 'orange', lty=2,border=NA)
lines(nx1:lx, lb , lty=2)
lines(nx1:lx, ub , lty=2)
lines(x, lwd=2)
lines(nx1:lx, forecast$pred , lwd=2 , col ='white')
box()
par(opar)
dev.off()
prob.dec <- array(NA, dim=fx)
prob.sdec <- array(NA, dim=fx)
prob.ldec <- array(NA, dim=fx)
prob.pval <- array(NA, dim=fx)
perf.pe <- array(0, dim=fx)
perf.spe <- array(0, dim=fx)
perf.scalederr <- array(0, dim=fx)
perf.mase <- array(0, dim=fx)
perf.mase1 <- array(0, dim=fx)
perf.mape <- array(0, dim=fx)
perf.smape <- array(0, dim=fx)
perf.mape1 <- array(0, dim=fx)
perf.smape1 <- array(0,dim=fx)
perf.se <- array(0, dim=fx)
perf.mse <- array(0, dim=fx)
perf.mse1 <- array(0, dim=fx)
perf.rmse <- array(0, dim=fx)
perf.scaleddenom <- 0
for (i in 2:fx) {
perf.scaleddenom = perf.scaleddenom + abs(x[nx+i] - x[nx+i-1])
}
perf.scaleddenom = perf.scaleddenom / (fx-1)
for (i in 1:fx) {
locSD <- (ub[i] - forecast$pred[i]) / 1.96
perf.scalederr[i] = (x[nx+i] - forecast$pred[i]) / perf.scaleddenom
perf.pe[i] = (x[nx+i] - forecast$pred[i]) / x[nx+i]
perf.spe[i] = 2*(x[nx+i] - forecast$pred[i]) / (x[nx+i] + forecast$pred[i])
perf.se[i] = (x[nx+i] - forecast$pred[i])^2
prob.dec[i] = pnorm((x[nx+i-1] - forecast$pred[i]) / locSD)
prob.sdec[i] = pnorm((x[nx+i-par5] - forecast$pred[i]) / locSD)
prob.ldec[i] = pnorm((x[nx] - forecast$pred[i]) / locSD)
prob.pval[i] = pnorm(abs(x[nx+i] - forecast$pred[i]) / locSD)
}
perf.mape[1] = abs(perf.pe[1])
perf.smape[1] = abs(perf.spe[1])
perf.mape1[1] = perf.mape[1]
perf.smape1[1] = perf.smape[1]
perf.mse[1] = perf.se[1]
perf.mase[1] = abs(perf.scalederr[1])
perf.mase1[1] = perf.mase[1]
for (i in 2:fx) {
perf.mape[i] = perf.mape[i-1] + abs(perf.pe[i])
perf.mape1[i] = perf.mape[i] / i
perf.smape[i] = perf.smape[i-1] + abs(perf.spe[i])
perf.smape1[i] = perf.smape[i] / i
perf.mse[i] = perf.mse[i-1] + perf.se[i]
perf.mse1[i] = perf.mse[i] / i
perf.mase[i] = perf.mase[i-1] + abs(perf.scalederr[i])
perf.mase1[i] = perf.mase[i] / i
}
perf.rmse = sqrt(perf.mse1)
bitmap(file='test2.png')
plot(forecast$pred, pch=19, type='b',main='ARIMA Extrapolation Forecast', ylab='Forecast and 95% CI', xlab='time',ylim=c(min(lb),max(ub)))
dum <- forecast$pred
dum[1:par1] <- x[(nx+1):lx]
lines(dum, lty=1)
lines(ub,lty=3)
lines(lb,lty=3)
dev.off()
load(file='createtable')
a<-table.start()
a<-table.row.start(a)
a<-table.element(a,'Univariate ARIMA Extrapolation Forecast',9,TRUE)
a<-table.row.end(a)
a<-table.row.start(a)
a<-table.element(a,'time',1,header=TRUE)
a<-table.element(a,'Y[t]',1,header=TRUE)
a<-table.element(a,'F[t]',1,header=TRUE)
a<-table.element(a,'95% LB',1,header=TRUE)
a<-table.element(a,'95% UB',1,header=TRUE)
a<-table.element(a,'p-value
(H0: Y[t] = F[t])',1,header=TRUE)
a<-table.element(a,'P(F[t]>Y[t-1])',1,header=TRUE)
a<-table.element(a,'P(F[t]>Y[t-s])',1,header=TRUE)
mylab <- paste('P(F[t]>Y[',nx,sep='')
mylab <- paste(mylab,'])',sep='')
a<-table.element(a,mylab,1,header=TRUE)
a<-table.row.end(a)
for (i in (nx-par5):nx) {
a<-table.row.start(a)
a<-table.element(a,i,header=TRUE)
a<-table.element(a,x[i])
a<-table.element(a,'-')
a<-table.row.end(a)
}
for (i in 1:fx) {
a<-table.row.start(a)
a<-table.element(a,nx+i,header=TRUE)
a<-table.element(a,round(x[nx+i],4))
a<-table.element(a,round(forecast$pred[i],4))
a<-table.element(a,round(lb[i],4))
a<-table.element(a,round(ub[i],4))
a<-table.element(a,round((1-prob.pval[i]),4))
a<-table.element(a,round((1-prob.dec[i]),4))
a<-table.element(a,round((1-prob.sdec[i]),4))
a<-table.element(a,round((1-prob.ldec[i]),4))
a<-table.row.end(a)
}
a<-table.end(a)
table.save(a,file='mytable.tab')
a<-table.start()
a<-table.row.start(a)
a<-table.element(a,'Univariate ARIMA Extrapolation Forecast Performance',10,TRUE)
a<-table.row.end(a)
a<-table.row.start(a)
a<-table.element(a,'time',1,header=TRUE)
a<-table.element(a,'% S.E.',1,header=TRUE)
a<-table.element(a,'PE',1,header=TRUE)
a<-table.element(a,'MAPE',1,header=TRUE)
a<-table.element(a,'sMAPE',1,header=TRUE)
a<-table.element(a,'Sq.E',1,header=TRUE)
a<-table.element(a,'MSE',1,header=TRUE)
a<-table.element(a,'RMSE',1,header=TRUE)
a<-table.element(a,'ScaledE',1,header=TRUE)
a<-table.element(a,'MASE',1,header=TRUE)
a<-table.row.end(a)
for (i in 1:fx) {
a<-table.row.start(a)
a<-table.element(a,nx+i,header=TRUE)
a<-table.element(a,round(perc.se[i],4))
a<-table.element(a,round(perf.pe[i],4))
a<-table.element(a,round(perf.mape1[i],4))
a<-table.element(a,round(perf.smape1[i],4))
a<-table.element(a,round(perf.se[i],4))
a<-table.element(a,round(perf.mse1[i],4))
a<-table.element(a,round(perf.rmse[i],4))
a<-table.element(a,round(perf.scalederr[i],4))
a<-table.element(a,round(perf.mase1[i],4))
a<-table.row.end(a)
}
a<-table.end(a)
table.save(a,file='mytable1.tab')