Free Statistics

of Irreproducible Research!

Author's title

Author*The author of this computation has been verified*
R Software Modulerwasp_exponentialsmoothing.wasp
Title produced by softwareExponential Smoothing
Date of computationWed, 21 Dec 2016 15:55:09 +0100
Cite this page as followsStatistical Computations at FreeStatistics.org, Office for Research Development and Education, URL https://freestatistics.org/blog/index.php?v=date/2016/Dec/21/t1482332144hil7cf57mhouz4e.htm/, Retrieved Fri, 01 Nov 2024 03:36:29 +0000
Statistical Computations at FreeStatistics.org, Office for Research Development and Education, URL https://freestatistics.org/blog/index.php?pk=302353, Retrieved Fri, 01 Nov 2024 03:36:29 +0000
QR Codes:

Original text written by user:
IsPrivate?No (this computation is public)
User-defined keywords
Estimated Impact68
Family? (F = Feedback message, R = changed R code, M = changed R Module, P = changed Parameters, D = changed Data)
-       [Exponential Smoothing] [n147] [2016-12-21 14:55:09] [0fbc99f8be9cad246c7cf6558103ab95] [Current]
Feedback Forum

Post a new message
Dataseries X:
5929.07
6332.38
6043.28
6127.9
6262.29
6416.96
5999.64
6424.27
5769.61
5623.18
5357.77
5265
4900.33
4529.55
4130.8
4225.07
4181.2
4189.48
3988.72
3863.11
3719.97
3591.07
3391.82
3031.74
2650.98
2409.32


Summary of computational transaction
Raw Input view raw input (R code)
Raw Outputview raw output of R engine
Computing time1 seconds
R ServerBig Analytics Cloud Computing Center

\begin{tabular}{lllllllll}
\hline
Summary of computational transaction \tabularnewline
Raw Input view raw input (R code)  \tabularnewline
Raw Outputview raw output of R engine  \tabularnewline
Computing time1 seconds \tabularnewline
R ServerBig Analytics Cloud Computing Center \tabularnewline
\hline
\end{tabular}
%Source: https://freestatistics.org/blog/index.php?pk=302353&T=0

[TABLE]
[ROW]
Summary of computational transaction[/C][/ROW] [ROW]Raw Input[/C] view raw input (R code) [/C][/ROW] [ROW]Raw Output[/C]view raw output of R engine [/C][/ROW] [ROW]Computing time[/C]1 seconds[/C][/ROW] [ROW]R Server[/C]Big Analytics Cloud Computing Center[/C][/ROW] [/TABLE] Source: https://freestatistics.org/blog/index.php?pk=302353&T=0

Globally Unique Identifier (entire table): ba.freestatistics.org/blog/index.php?pk=302353&T=0

As an alternative you can also use a QR Code:  

The GUIDs for individual cells are displayed in the table below:

Summary of computational transaction
Raw Input view raw input (R code)
Raw Outputview raw output of R engine
Computing time1 seconds
R ServerBig Analytics Cloud Computing Center


Estimated Parameters of Exponential Smoothing
ParameterValue
alpha0.999952758686286
betaFALSE
gammaFALSE

\begin{tabular}{lllllllll}
\hline
Estimated Parameters of Exponential Smoothing \tabularnewline
Parameter & Value \tabularnewline
alpha & 0.999952758686286 \tabularnewline
beta & FALSE \tabularnewline
gamma & FALSE \tabularnewline
\hline
\end{tabular}
%Source: https://freestatistics.org/blog/index.php?pk=302353&T=1

[TABLE]
[ROW][C]Estimated Parameters of Exponential Smoothing[/C][/ROW]
[ROW][C]Parameter[/C][C]Value[/C][/ROW]
[ROW][C]alpha[/C][C]0.999952758686286[/C][/ROW]
[ROW][C]beta[/C][C]FALSE[/C][/ROW]
[ROW][C]gamma[/C][C]FALSE[/C][/ROW]
[/TABLE]
Source: https://freestatistics.org/blog/index.php?pk=302353&T=1

Globally Unique Identifier (entire table): ba.freestatistics.org/blog/index.php?pk=302353&T=1

As an alternative you can also use a QR Code:  

The GUIDs for individual cells are displayed in the table below:

Estimated Parameters of Exponential Smoothing
ParameterValue
alpha0.999952758686286
betaFALSE
gammaFALSE


Interpolation Forecasts of Exponential Smoothing
tObservedFittedResiduals
26332.385929.07403.31
36043.286332.36094710577-289.080947105766
46127.96043.2936565637184.6063434362895
56262.296127.89600308519134.393996914813
66416.966262.28365105103154.676348948969
75999.646416.95269288608-417.312692886075
86424.275999.65971439984424.610285600159
95769.616424.24994085229-654.639940852292
105623.185769.64092605082-146.460926050815
115357.775623.18691900655-265.416919006554
1252655357.78253864394-92.7825386439363
134900.335265.00438316902-364.674383169016
144529.554900.34722769694-370.797227696939
154130.84529.56751694816-398.767516948158
164225.074130.8188383013794.251161698633
174181.24225.0655474513-43.8655474513025
184189.484181.202072266098.27792773391138
193988.724189.47960893982-200.759608939819
203863.113988.72948414767-125.619484147667
213719.973863.11593442946-143.14593442946
223591.073719.976762402-128.906762401995
233391.823591.0760897248-199.256089724803
243031.743391.82941311944-360.089413119445
252650.983031.75701109693-380.77701109693
262409.322650.99798840624-241.677988406236

\begin{tabular}{lllllllll}
\hline
Interpolation Forecasts of Exponential Smoothing \tabularnewline
t & Observed & Fitted & Residuals \tabularnewline
2 & 6332.38 & 5929.07 & 403.31 \tabularnewline
3 & 6043.28 & 6332.36094710577 & -289.080947105766 \tabularnewline
4 & 6127.9 & 6043.29365656371 & 84.6063434362895 \tabularnewline
5 & 6262.29 & 6127.89600308519 & 134.393996914813 \tabularnewline
6 & 6416.96 & 6262.28365105103 & 154.676348948969 \tabularnewline
7 & 5999.64 & 6416.95269288608 & -417.312692886075 \tabularnewline
8 & 6424.27 & 5999.65971439984 & 424.610285600159 \tabularnewline
9 & 5769.61 & 6424.24994085229 & -654.639940852292 \tabularnewline
10 & 5623.18 & 5769.64092605082 & -146.460926050815 \tabularnewline
11 & 5357.77 & 5623.18691900655 & -265.416919006554 \tabularnewline
12 & 5265 & 5357.78253864394 & -92.7825386439363 \tabularnewline
13 & 4900.33 & 5265.00438316902 & -364.674383169016 \tabularnewline
14 & 4529.55 & 4900.34722769694 & -370.797227696939 \tabularnewline
15 & 4130.8 & 4529.56751694816 & -398.767516948158 \tabularnewline
16 & 4225.07 & 4130.81883830137 & 94.251161698633 \tabularnewline
17 & 4181.2 & 4225.0655474513 & -43.8655474513025 \tabularnewline
18 & 4189.48 & 4181.20207226609 & 8.27792773391138 \tabularnewline
19 & 3988.72 & 4189.47960893982 & -200.759608939819 \tabularnewline
20 & 3863.11 & 3988.72948414767 & -125.619484147667 \tabularnewline
21 & 3719.97 & 3863.11593442946 & -143.14593442946 \tabularnewline
22 & 3591.07 & 3719.976762402 & -128.906762401995 \tabularnewline
23 & 3391.82 & 3591.0760897248 & -199.256089724803 \tabularnewline
24 & 3031.74 & 3391.82941311944 & -360.089413119445 \tabularnewline
25 & 2650.98 & 3031.75701109693 & -380.77701109693 \tabularnewline
26 & 2409.32 & 2650.99798840624 & -241.677988406236 \tabularnewline
\hline
\end{tabular}
%Source: https://freestatistics.org/blog/index.php?pk=302353&T=2

[TABLE]
[ROW][C]Interpolation Forecasts of Exponential Smoothing[/C][/ROW]
[ROW][C]t[/C][C]Observed[/C][C]Fitted[/C][C]Residuals[/C][/ROW]
[ROW][C]2[/C][C]6332.38[/C][C]5929.07[/C][C]403.31[/C][/ROW]
[ROW][C]3[/C][C]6043.28[/C][C]6332.36094710577[/C][C]-289.080947105766[/C][/ROW]
[ROW][C]4[/C][C]6127.9[/C][C]6043.29365656371[/C][C]84.6063434362895[/C][/ROW]
[ROW][C]5[/C][C]6262.29[/C][C]6127.89600308519[/C][C]134.393996914813[/C][/ROW]
[ROW][C]6[/C][C]6416.96[/C][C]6262.28365105103[/C][C]154.676348948969[/C][/ROW]
[ROW][C]7[/C][C]5999.64[/C][C]6416.95269288608[/C][C]-417.312692886075[/C][/ROW]
[ROW][C]8[/C][C]6424.27[/C][C]5999.65971439984[/C][C]424.610285600159[/C][/ROW]
[ROW][C]9[/C][C]5769.61[/C][C]6424.24994085229[/C][C]-654.639940852292[/C][/ROW]
[ROW][C]10[/C][C]5623.18[/C][C]5769.64092605082[/C][C]-146.460926050815[/C][/ROW]
[ROW][C]11[/C][C]5357.77[/C][C]5623.18691900655[/C][C]-265.416919006554[/C][/ROW]
[ROW][C]12[/C][C]5265[/C][C]5357.78253864394[/C][C]-92.7825386439363[/C][/ROW]
[ROW][C]13[/C][C]4900.33[/C][C]5265.00438316902[/C][C]-364.674383169016[/C][/ROW]
[ROW][C]14[/C][C]4529.55[/C][C]4900.34722769694[/C][C]-370.797227696939[/C][/ROW]
[ROW][C]15[/C][C]4130.8[/C][C]4529.56751694816[/C][C]-398.767516948158[/C][/ROW]
[ROW][C]16[/C][C]4225.07[/C][C]4130.81883830137[/C][C]94.251161698633[/C][/ROW]
[ROW][C]17[/C][C]4181.2[/C][C]4225.0655474513[/C][C]-43.8655474513025[/C][/ROW]
[ROW][C]18[/C][C]4189.48[/C][C]4181.20207226609[/C][C]8.27792773391138[/C][/ROW]
[ROW][C]19[/C][C]3988.72[/C][C]4189.47960893982[/C][C]-200.759608939819[/C][/ROW]
[ROW][C]20[/C][C]3863.11[/C][C]3988.72948414767[/C][C]-125.619484147667[/C][/ROW]
[ROW][C]21[/C][C]3719.97[/C][C]3863.11593442946[/C][C]-143.14593442946[/C][/ROW]
[ROW][C]22[/C][C]3591.07[/C][C]3719.976762402[/C][C]-128.906762401995[/C][/ROW]
[ROW][C]23[/C][C]3391.82[/C][C]3591.0760897248[/C][C]-199.256089724803[/C][/ROW]
[ROW][C]24[/C][C]3031.74[/C][C]3391.82941311944[/C][C]-360.089413119445[/C][/ROW]
[ROW][C]25[/C][C]2650.98[/C][C]3031.75701109693[/C][C]-380.77701109693[/C][/ROW]
[ROW][C]26[/C][C]2409.32[/C][C]2650.99798840624[/C][C]-241.677988406236[/C][/ROW]
[/TABLE]
Source: https://freestatistics.org/blog/index.php?pk=302353&T=2

Globally Unique Identifier (entire table): ba.freestatistics.org/blog/index.php?pk=302353&T=2

As an alternative you can also use a QR Code:  

The GUIDs for individual cells are displayed in the table below:

Interpolation Forecasts of Exponential Smoothing
tObservedFittedResiduals
26332.385929.07403.31
36043.286332.36094710577-289.080947105766
46127.96043.2936565637184.6063434362895
56262.296127.89600308519134.393996914813
66416.966262.28365105103154.676348948969
75999.646416.95269288608-417.312692886075
86424.275999.65971439984424.610285600159
95769.616424.24994085229-654.639940852292
105623.185769.64092605082-146.460926050815
115357.775623.18691900655-265.416919006554
1252655357.78253864394-92.7825386439363
134900.335265.00438316902-364.674383169016
144529.554900.34722769694-370.797227696939
154130.84529.56751694816-398.767516948158
164225.074130.8188383013794.251161698633
174181.24225.0655474513-43.8655474513025
184189.484181.202072266098.27792773391138
193988.724189.47960893982-200.759608939819
203863.113988.72948414767-125.619484147667
213719.973863.11593442946-143.14593442946
223591.073719.976762402-128.906762401995
233391.823591.0760897248-199.256089724803
243031.743391.82941311944-360.089413119445
252650.983031.75701109693-380.77701109693
262409.322650.99798840624-241.677988406236


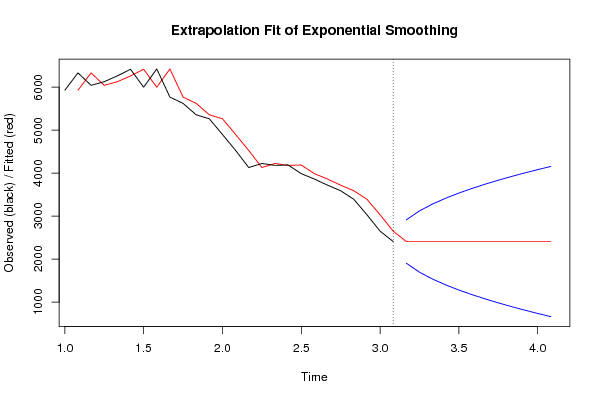
Extrapolation Forecasts of Exponential Smoothing
tForecast95% Lower Bound95% Upper Bound
272409.331417185671904.916093069192913.74674130215
282409.331417185671695.997274371333122.66556000001
292409.331417185671535.685963122183282.97687124916
302409.331417185671400.536512605493418.12632176585
312409.331417185671281.467090412243537.1957439591
322409.331417185671173.819895705923644.84293866542
332409.331417185671074.827951543733743.83488282761
342409.33141718567982.6884065093863835.97442786195
352409.33141718567896.1489893163053922.51384505503
362409.33141718567814.2979253386294004.36490903271
372409.33141718567736.4468963011894082.21593807015
382409.33141718567662.0611460724584156.60168829888

\begin{tabular}{lllllllll}
\hline
Extrapolation Forecasts of Exponential Smoothing \tabularnewline
t & Forecast & 95% Lower Bound & 95% Upper Bound \tabularnewline
27 & 2409.33141718567 & 1904.91609306919 & 2913.74674130215 \tabularnewline
28 & 2409.33141718567 & 1695.99727437133 & 3122.66556000001 \tabularnewline
29 & 2409.33141718567 & 1535.68596312218 & 3282.97687124916 \tabularnewline
30 & 2409.33141718567 & 1400.53651260549 & 3418.12632176585 \tabularnewline
31 & 2409.33141718567 & 1281.46709041224 & 3537.1957439591 \tabularnewline
32 & 2409.33141718567 & 1173.81989570592 & 3644.84293866542 \tabularnewline
33 & 2409.33141718567 & 1074.82795154373 & 3743.83488282761 \tabularnewline
34 & 2409.33141718567 & 982.688406509386 & 3835.97442786195 \tabularnewline
35 & 2409.33141718567 & 896.148989316305 & 3922.51384505503 \tabularnewline
36 & 2409.33141718567 & 814.297925338629 & 4004.36490903271 \tabularnewline
37 & 2409.33141718567 & 736.446896301189 & 4082.21593807015 \tabularnewline
38 & 2409.33141718567 & 662.061146072458 & 4156.60168829888 \tabularnewline
\hline
\end{tabular}
%Source: https://freestatistics.org/blog/index.php?pk=302353&T=3

[TABLE]
[ROW][C]Extrapolation Forecasts of Exponential Smoothing[/C][/ROW]
[ROW][C]t[/C][C]Forecast[/C][C]95% Lower Bound[/C][C]95% Upper Bound[/C][/ROW]
[ROW][C]27[/C][C]2409.33141718567[/C][C]1904.91609306919[/C][C]2913.74674130215[/C][/ROW]
[ROW][C]28[/C][C]2409.33141718567[/C][C]1695.99727437133[/C][C]3122.66556000001[/C][/ROW]
[ROW][C]29[/C][C]2409.33141718567[/C][C]1535.68596312218[/C][C]3282.97687124916[/C][/ROW]
[ROW][C]30[/C][C]2409.33141718567[/C][C]1400.53651260549[/C][C]3418.12632176585[/C][/ROW]
[ROW][C]31[/C][C]2409.33141718567[/C][C]1281.46709041224[/C][C]3537.1957439591[/C][/ROW]
[ROW][C]32[/C][C]2409.33141718567[/C][C]1173.81989570592[/C][C]3644.84293866542[/C][/ROW]
[ROW][C]33[/C][C]2409.33141718567[/C][C]1074.82795154373[/C][C]3743.83488282761[/C][/ROW]
[ROW][C]34[/C][C]2409.33141718567[/C][C]982.688406509386[/C][C]3835.97442786195[/C][/ROW]
[ROW][C]35[/C][C]2409.33141718567[/C][C]896.148989316305[/C][C]3922.51384505503[/C][/ROW]
[ROW][C]36[/C][C]2409.33141718567[/C][C]814.297925338629[/C][C]4004.36490903271[/C][/ROW]
[ROW][C]37[/C][C]2409.33141718567[/C][C]736.446896301189[/C][C]4082.21593807015[/C][/ROW]
[ROW][C]38[/C][C]2409.33141718567[/C][C]662.061146072458[/C][C]4156.60168829888[/C][/ROW]
[/TABLE]
Source: https://freestatistics.org/blog/index.php?pk=302353&T=3

Globally Unique Identifier (entire table): ba.freestatistics.org/blog/index.php?pk=302353&T=3

As an alternative you can also use a QR Code:  

The GUIDs for individual cells are displayed in the table below:

Extrapolation Forecasts of Exponential Smoothing
tForecast95% Lower Bound95% Upper Bound
272409.331417185671904.916093069192913.74674130215
282409.331417185671695.997274371333122.66556000001
292409.331417185671535.685963122183282.97687124916
302409.331417185671400.536512605493418.12632176585
312409.331417185671281.467090412243537.1957439591
322409.331417185671173.819895705923644.84293866542
332409.331417185671074.827951543733743.83488282761
342409.33141718567982.6884065093863835.97442786195
352409.33141718567896.1489893163053922.51384505503
362409.33141718567814.2979253386294004.36490903271
372409.33141718567736.4468963011894082.21593807015
382409.33141718567662.0611460724584156.60168829888


Parameters (Session):
par1 = 12 ; par2 = Single ; par3 = additive ; par4 = 12 ;
Parameters (R input):
par1 = 12 ; par2 = Single ; par3 = additive ; par4 = 12 ;
R code (references can be found in the software module):
par1 <- as.numeric(par1)
par4 <- as.numeric(par4)
if (par2 == 'Single') K <- 1
if (par2 == 'Double') K <- 2
if (par2 == 'Triple') K <- par1
nx <- length(x)
nxmK <- nx - K
x <- ts(x, frequency = par1)
if (par2 == 'Single') fit <- HoltWinters(x, gamma=F, beta=F)
if (par2 == 'Double') fit <- HoltWinters(x, gamma=F)
if (par2 == 'Triple') fit <- HoltWinters(x, seasonal=par3)
fit
myresid <- x - fit$fitted[,'xhat']
bitmap(file='test1.png')
op <- par(mfrow=c(2,1))
plot(fit,ylab='Observed (black) / Fitted (red)',main='Interpolation Fit of Exponential Smoothing')
plot(myresid,ylab='Residuals',main='Interpolation Prediction Errors')
par(op)
dev.off()
bitmap(file='test2.png')
p <- predict(fit, par4, prediction.interval=TRUE)
np <- length(p[,1])
plot(fit,p,ylab='Observed (black) / Fitted (red)',main='Extrapolation Fit of Exponential Smoothing')
dev.off()
bitmap(file='test3.png')
op <- par(mfrow = c(2,2))
acf(as.numeric(myresid),lag.max = nx/2,main='Residual ACF')
spectrum(myresid,main='Residals Periodogram')
cpgram(myresid,main='Residal Cumulative Periodogram')
qqnorm(myresid,main='Residual Normal QQ Plot')
qqline(myresid)
par(op)
dev.off()
load(file='createtable')
a<-table.start()
a<-table.row.start(a)
a<-table.element(a,'Estimated Parameters of Exponential Smoothing',2,TRUE)
a<-table.row.end(a)
a<-table.row.start(a)
a<-table.element(a,'Parameter',header=TRUE)
a<-table.element(a,'Value',header=TRUE)
a<-table.row.end(a)
a<-table.row.start(a)
a<-table.element(a,'alpha',header=TRUE)
a<-table.element(a,fit$alpha)
a<-table.row.end(a)
a<-table.row.start(a)
a<-table.element(a,'beta',header=TRUE)
a<-table.element(a,fit$beta)
a<-table.row.end(a)
a<-table.row.start(a)
a<-table.element(a,'gamma',header=TRUE)
a<-table.element(a,fit$gamma)
a<-table.row.end(a)
a<-table.end(a)
table.save(a,file='mytable.tab')
a<-table.start()
a<-table.row.start(a)
a<-table.element(a,'Interpolation Forecasts of Exponential Smoothing',4,TRUE)
a<-table.row.end(a)
a<-table.row.start(a)
a<-table.element(a,'t',header=TRUE)
a<-table.element(a,'Observed',header=TRUE)
a<-table.element(a,'Fitted',header=TRUE)
a<-table.element(a,'Residuals',header=TRUE)
a<-table.row.end(a)
for (i in 1:nxmK) {
a<-table.row.start(a)
a<-table.element(a,i+K,header=TRUE)
a<-table.element(a,x[i+K])
a<-table.element(a,fit$fitted[i,'xhat'])
a<-table.element(a,myresid[i])
a<-table.row.end(a)
}
a<-table.end(a)
table.save(a,file='mytable1.tab')
a<-table.start()
a<-table.row.start(a)
a<-table.element(a,'Extrapolation Forecasts of Exponential Smoothing',4,TRUE)
a<-table.row.end(a)
a<-table.row.start(a)
a<-table.element(a,'t',header=TRUE)
a<-table.element(a,'Forecast',header=TRUE)
a<-table.element(a,'95% Lower Bound',header=TRUE)
a<-table.element(a,'95% Upper Bound',header=TRUE)
a<-table.row.end(a)
for (i in 1:np) {
a<-table.row.start(a)
a<-table.element(a,nx+i,header=TRUE)
a<-table.element(a,p[i,'fit'])
a<-table.element(a,p[i,'lwr'])
a<-table.element(a,p[i,'upr'])
a<-table.row.end(a)
}
a<-table.end(a)
table.save(a,file='mytable2.tab')