Free Statistics

of Irreproducible Research!

Author's title

Author*The author of this computation has been verified*
R Software Modulerwasp_exponentialsmoothing.wasp
Title produced by softwareExponential Smoothing
Date of computationTue, 20 Dec 2016 17:08:37 +0100
Cite this page as followsStatistical Computations at FreeStatistics.org, Office for Research Development and Education, URL https://freestatistics.org/blog/index.php?v=date/2016/Dec/20/t1482250250p7gvwv3ku76mycn.htm/, Retrieved Fri, 01 Nov 2024 03:30:58 +0000
Statistical Computations at FreeStatistics.org, Office for Research Development and Education, URL https://freestatistics.org/blog/index.php?pk=301732, Retrieved Fri, 01 Nov 2024 03:30:58 +0000
QR Codes:

Original text written by user:
IsPrivate?No (this computation is public)
User-defined keywords
Estimated Impact92
Family? (F = Feedback message, R = changed R code, M = changed R Module, P = changed Parameters, D = changed Data)
-       [Exponential Smoothing] [] [2016-12-20 16:08:37] [672675941468e072e71d9fb024f2b817] [Current]
Feedback Forum

Post a new message
Dataseries X:
5133
5155
5174
5201
5221
5205
5235
5255
5272
5299
5318
5340
5385
5430
5454
5493
5536
5565
5586
5594
5576
5544
5530
5536
5544
5564
5596
5596
5599
5591
5566
5532
5498
5484
5442
5447
5490
5544
5583
5628
5679
5691
5707
5724
5726
5745
5767
5789
5785
5785
5806
5827
5856
5896
5914
5938


Summary of computational transaction
Raw Input view raw input (R code)
Raw Outputview raw output of R engine
Computing time1 seconds
R ServerBig Analytics Cloud Computing Center

\begin{tabular}{lllllllll}
\hline
Summary of computational transaction \tabularnewline
Raw Input view raw input (R code)  \tabularnewline
Raw Outputview raw output of R engine  \tabularnewline
Computing time1 seconds \tabularnewline
R ServerBig Analytics Cloud Computing Center \tabularnewline
\hline
\end{tabular}
%Source: https://freestatistics.org/blog/index.php?pk=301732&T=0

[TABLE]
[ROW]
Summary of computational transaction[/C][/ROW] [ROW]Raw Input[/C] view raw input (R code) [/C][/ROW] [ROW]Raw Output[/C]view raw output of R engine [/C][/ROW] [ROW]Computing time[/C]1 seconds[/C][/ROW] [ROW]R Server[/C]Big Analytics Cloud Computing Center[/C][/ROW] [/TABLE] Source: https://freestatistics.org/blog/index.php?pk=301732&T=0

Globally Unique Identifier (entire table): ba.freestatistics.org/blog/index.php?pk=301732&T=0

As an alternative you can also use a QR Code:  

The GUIDs for individual cells are displayed in the table below:

Summary of computational transaction
Raw Input view raw input (R code)
Raw Outputview raw output of R engine
Computing time1 seconds
R ServerBig Analytics Cloud Computing Center


Estimated Parameters of Exponential Smoothing
ParameterValue
alpha1
beta0.854196870146392
gammaFALSE

\begin{tabular}{lllllllll}
\hline
Estimated Parameters of Exponential Smoothing \tabularnewline
Parameter & Value \tabularnewline
alpha & 1 \tabularnewline
beta & 0.854196870146392 \tabularnewline
gamma & FALSE \tabularnewline
\hline
\end{tabular}
%Source: https://freestatistics.org/blog/index.php?pk=301732&T=1

[TABLE]
[ROW][C]Estimated Parameters of Exponential Smoothing[/C][/ROW]
[ROW][C]Parameter[/C][C]Value[/C][/ROW]
[ROW][C]alpha[/C][C]1[/C][/ROW]
[ROW][C]beta[/C][C]0.854196870146392[/C][/ROW]
[ROW][C]gamma[/C][C]FALSE[/C][/ROW]
[/TABLE]
Source: https://freestatistics.org/blog/index.php?pk=301732&T=1

Globally Unique Identifier (entire table): ba.freestatistics.org/blog/index.php?pk=301732&T=1

As an alternative you can also use a QR Code:  

The GUIDs for individual cells are displayed in the table below:

Estimated Parameters of Exponential Smoothing
ParameterValue
alpha1
beta0.854196870146392
gammaFALSE


Interpolation Forecasts of Exponential Smoothing
tObservedFittedResiduals
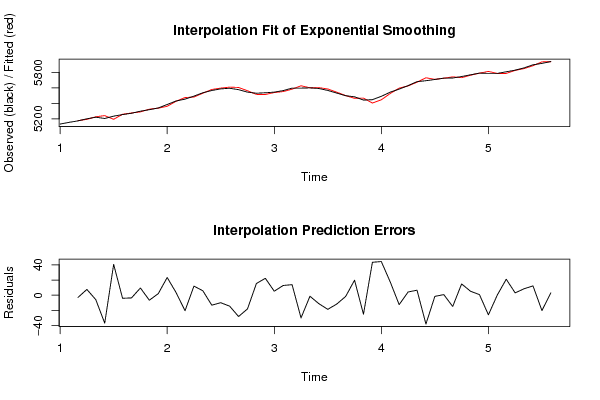
351745177-3
452015193.437409389567.56259061043875
552215226.8973506192-5.897350619196
652055241.85985217812-36.8598521781232
752355194.3742818135140.6257181864885
852555259.07664313586-4.07664313585974
952725275.5943873285-3.59438732850413
1052995289.52407292249.47592707759759
1153185324.61838017382-6.61838017382161
1253405337.96498054392.03501945609605
1353855361.7032877939923.2967122060118
1454305426.603266445063.39673355493505
1554545474.50474561641-20.504745616412
1654935480.9896560877312.0103439122749
1755365530.248854266975.75114573302835
1855655578.16146495188-13.1614649518806
1955865595.91898278344-9.91898278344252
2055945608.44621873479-14.4462187347899
2155765604.10630390608-28.1063039060818
2255445562.09798707812-18.0979870781239
2355305514.6387431600415.3612568399594
2455365513.7602806742522.2397193257511
2555445538.757379315245.24262068476037
2655645551.2356094955312.7643905044733
2755965582.1389119137713.8610880862261
2855965625.97900997385-29.979009973852
2955995600.3710334841-1.37103348409983
3055915602.19990097312-11.1999009731162
3155665584.63298061593-18.632980615931
3255325543.7167468923-11.7167468923044
3354985499.7083383686-1.70833836860038
3454845464.2490810809919.7509189190087
3554425467.12025420412-25.1202542041237
3654475403.6626116856843.3373883143204
3754905445.6812731440944.3187268559095
3855445526.5381909132817.4618090867189
3955835595.45401358225-12.4540135822499
4056285623.815834159534.18416584046827
4156795672.389935524636.61006447536693
4256915729.03623191096-38.0362319109572
4357075708.54580166046-1.54580166045525
4457245723.225382720230.774617279772428
4557265740.88705837617-14.8870583761709
4657455730.1705797055614.8294202944408
4757675761.837824107165.16217589284406
4857895788.247338597970.752661402031663
4957855810.89025961186-25.8902596118642
5057855784.774880884130.225119115867528
5158065784.9671769283221.0328230716832
5258275823.933348566493.06665143350892
5358565847.552872622828.447127377176
5458965883.7683823901412.2316176098639
5559145934.21659186931-20.216591869309
5659385934.947642369523.05235763048131

\begin{tabular}{lllllllll}
\hline
Interpolation Forecasts of Exponential Smoothing \tabularnewline
t & Observed & Fitted & Residuals \tabularnewline
3 & 5174 & 5177 & -3 \tabularnewline
4 & 5201 & 5193.43740938956 & 7.56259061043875 \tabularnewline
5 & 5221 & 5226.8973506192 & -5.897350619196 \tabularnewline
6 & 5205 & 5241.85985217812 & -36.8598521781232 \tabularnewline
7 & 5235 & 5194.37428181351 & 40.6257181864885 \tabularnewline
8 & 5255 & 5259.07664313586 & -4.07664313585974 \tabularnewline
9 & 5272 & 5275.5943873285 & -3.59438732850413 \tabularnewline
10 & 5299 & 5289.5240729224 & 9.47592707759759 \tabularnewline
11 & 5318 & 5324.61838017382 & -6.61838017382161 \tabularnewline
12 & 5340 & 5337.9649805439 & 2.03501945609605 \tabularnewline
13 & 5385 & 5361.70328779399 & 23.2967122060118 \tabularnewline
14 & 5430 & 5426.60326644506 & 3.39673355493505 \tabularnewline
15 & 5454 & 5474.50474561641 & -20.504745616412 \tabularnewline
16 & 5493 & 5480.98965608773 & 12.0103439122749 \tabularnewline
17 & 5536 & 5530.24885426697 & 5.75114573302835 \tabularnewline
18 & 5565 & 5578.16146495188 & -13.1614649518806 \tabularnewline
19 & 5586 & 5595.91898278344 & -9.91898278344252 \tabularnewline
20 & 5594 & 5608.44621873479 & -14.4462187347899 \tabularnewline
21 & 5576 & 5604.10630390608 & -28.1063039060818 \tabularnewline
22 & 5544 & 5562.09798707812 & -18.0979870781239 \tabularnewline
23 & 5530 & 5514.63874316004 & 15.3612568399594 \tabularnewline
24 & 5536 & 5513.76028067425 & 22.2397193257511 \tabularnewline
25 & 5544 & 5538.75737931524 & 5.24262068476037 \tabularnewline
26 & 5564 & 5551.23560949553 & 12.7643905044733 \tabularnewline
27 & 5596 & 5582.13891191377 & 13.8610880862261 \tabularnewline
28 & 5596 & 5625.97900997385 & -29.979009973852 \tabularnewline
29 & 5599 & 5600.3710334841 & -1.37103348409983 \tabularnewline
30 & 5591 & 5602.19990097312 & -11.1999009731162 \tabularnewline
31 & 5566 & 5584.63298061593 & -18.632980615931 \tabularnewline
32 & 5532 & 5543.7167468923 & -11.7167468923044 \tabularnewline
33 & 5498 & 5499.7083383686 & -1.70833836860038 \tabularnewline
34 & 5484 & 5464.24908108099 & 19.7509189190087 \tabularnewline
35 & 5442 & 5467.12025420412 & -25.1202542041237 \tabularnewline
36 & 5447 & 5403.66261168568 & 43.3373883143204 \tabularnewline
37 & 5490 & 5445.68127314409 & 44.3187268559095 \tabularnewline
38 & 5544 & 5526.53819091328 & 17.4618090867189 \tabularnewline
39 & 5583 & 5595.45401358225 & -12.4540135822499 \tabularnewline
40 & 5628 & 5623.81583415953 & 4.18416584046827 \tabularnewline
41 & 5679 & 5672.38993552463 & 6.61006447536693 \tabularnewline
42 & 5691 & 5729.03623191096 & -38.0362319109572 \tabularnewline
43 & 5707 & 5708.54580166046 & -1.54580166045525 \tabularnewline
44 & 5724 & 5723.22538272023 & 0.774617279772428 \tabularnewline
45 & 5726 & 5740.88705837617 & -14.8870583761709 \tabularnewline
46 & 5745 & 5730.17057970556 & 14.8294202944408 \tabularnewline
47 & 5767 & 5761.83782410716 & 5.16217589284406 \tabularnewline
48 & 5789 & 5788.24733859797 & 0.752661402031663 \tabularnewline
49 & 5785 & 5810.89025961186 & -25.8902596118642 \tabularnewline
50 & 5785 & 5784.77488088413 & 0.225119115867528 \tabularnewline
51 & 5806 & 5784.96717692832 & 21.0328230716832 \tabularnewline
52 & 5827 & 5823.93334856649 & 3.06665143350892 \tabularnewline
53 & 5856 & 5847.55287262282 & 8.447127377176 \tabularnewline
54 & 5896 & 5883.76838239014 & 12.2316176098639 \tabularnewline
55 & 5914 & 5934.21659186931 & -20.216591869309 \tabularnewline
56 & 5938 & 5934.94764236952 & 3.05235763048131 \tabularnewline
\hline
\end{tabular}
%Source: https://freestatistics.org/blog/index.php?pk=301732&T=2

[TABLE]
[ROW][C]Interpolation Forecasts of Exponential Smoothing[/C][/ROW]
[ROW][C]t[/C][C]Observed[/C][C]Fitted[/C][C]Residuals[/C][/ROW]
[ROW][C]3[/C][C]5174[/C][C]5177[/C][C]-3[/C][/ROW]
[ROW][C]4[/C][C]5201[/C][C]5193.43740938956[/C][C]7.56259061043875[/C][/ROW]
[ROW][C]5[/C][C]5221[/C][C]5226.8973506192[/C][C]-5.897350619196[/C][/ROW]
[ROW][C]6[/C][C]5205[/C][C]5241.85985217812[/C][C]-36.8598521781232[/C][/ROW]
[ROW][C]7[/C][C]5235[/C][C]5194.37428181351[/C][C]40.6257181864885[/C][/ROW]
[ROW][C]8[/C][C]5255[/C][C]5259.07664313586[/C][C]-4.07664313585974[/C][/ROW]
[ROW][C]9[/C][C]5272[/C][C]5275.5943873285[/C][C]-3.59438732850413[/C][/ROW]
[ROW][C]10[/C][C]5299[/C][C]5289.5240729224[/C][C]9.47592707759759[/C][/ROW]
[ROW][C]11[/C][C]5318[/C][C]5324.61838017382[/C][C]-6.61838017382161[/C][/ROW]
[ROW][C]12[/C][C]5340[/C][C]5337.9649805439[/C][C]2.03501945609605[/C][/ROW]
[ROW][C]13[/C][C]5385[/C][C]5361.70328779399[/C][C]23.2967122060118[/C][/ROW]
[ROW][C]14[/C][C]5430[/C][C]5426.60326644506[/C][C]3.39673355493505[/C][/ROW]
[ROW][C]15[/C][C]5454[/C][C]5474.50474561641[/C][C]-20.504745616412[/C][/ROW]
[ROW][C]16[/C][C]5493[/C][C]5480.98965608773[/C][C]12.0103439122749[/C][/ROW]
[ROW][C]17[/C][C]5536[/C][C]5530.24885426697[/C][C]5.75114573302835[/C][/ROW]
[ROW][C]18[/C][C]5565[/C][C]5578.16146495188[/C][C]-13.1614649518806[/C][/ROW]
[ROW][C]19[/C][C]5586[/C][C]5595.91898278344[/C][C]-9.91898278344252[/C][/ROW]
[ROW][C]20[/C][C]5594[/C][C]5608.44621873479[/C][C]-14.4462187347899[/C][/ROW]
[ROW][C]21[/C][C]5576[/C][C]5604.10630390608[/C][C]-28.1063039060818[/C][/ROW]
[ROW][C]22[/C][C]5544[/C][C]5562.09798707812[/C][C]-18.0979870781239[/C][/ROW]
[ROW][C]23[/C][C]5530[/C][C]5514.63874316004[/C][C]15.3612568399594[/C][/ROW]
[ROW][C]24[/C][C]5536[/C][C]5513.76028067425[/C][C]22.2397193257511[/C][/ROW]
[ROW][C]25[/C][C]5544[/C][C]5538.75737931524[/C][C]5.24262068476037[/C][/ROW]
[ROW][C]26[/C][C]5564[/C][C]5551.23560949553[/C][C]12.7643905044733[/C][/ROW]
[ROW][C]27[/C][C]5596[/C][C]5582.13891191377[/C][C]13.8610880862261[/C][/ROW]
[ROW][C]28[/C][C]5596[/C][C]5625.97900997385[/C][C]-29.979009973852[/C][/ROW]
[ROW][C]29[/C][C]5599[/C][C]5600.3710334841[/C][C]-1.37103348409983[/C][/ROW]
[ROW][C]30[/C][C]5591[/C][C]5602.19990097312[/C][C]-11.1999009731162[/C][/ROW]
[ROW][C]31[/C][C]5566[/C][C]5584.63298061593[/C][C]-18.632980615931[/C][/ROW]
[ROW][C]32[/C][C]5532[/C][C]5543.7167468923[/C][C]-11.7167468923044[/C][/ROW]
[ROW][C]33[/C][C]5498[/C][C]5499.7083383686[/C][C]-1.70833836860038[/C][/ROW]
[ROW][C]34[/C][C]5484[/C][C]5464.24908108099[/C][C]19.7509189190087[/C][/ROW]
[ROW][C]35[/C][C]5442[/C][C]5467.12025420412[/C][C]-25.1202542041237[/C][/ROW]
[ROW][C]36[/C][C]5447[/C][C]5403.66261168568[/C][C]43.3373883143204[/C][/ROW]
[ROW][C]37[/C][C]5490[/C][C]5445.68127314409[/C][C]44.3187268559095[/C][/ROW]
[ROW][C]38[/C][C]5544[/C][C]5526.53819091328[/C][C]17.4618090867189[/C][/ROW]
[ROW][C]39[/C][C]5583[/C][C]5595.45401358225[/C][C]-12.4540135822499[/C][/ROW]
[ROW][C]40[/C][C]5628[/C][C]5623.81583415953[/C][C]4.18416584046827[/C][/ROW]
[ROW][C]41[/C][C]5679[/C][C]5672.38993552463[/C][C]6.61006447536693[/C][/ROW]
[ROW][C]42[/C][C]5691[/C][C]5729.03623191096[/C][C]-38.0362319109572[/C][/ROW]
[ROW][C]43[/C][C]5707[/C][C]5708.54580166046[/C][C]-1.54580166045525[/C][/ROW]
[ROW][C]44[/C][C]5724[/C][C]5723.22538272023[/C][C]0.774617279772428[/C][/ROW]
[ROW][C]45[/C][C]5726[/C][C]5740.88705837617[/C][C]-14.8870583761709[/C][/ROW]
[ROW][C]46[/C][C]5745[/C][C]5730.17057970556[/C][C]14.8294202944408[/C][/ROW]
[ROW][C]47[/C][C]5767[/C][C]5761.83782410716[/C][C]5.16217589284406[/C][/ROW]
[ROW][C]48[/C][C]5789[/C][C]5788.24733859797[/C][C]0.752661402031663[/C][/ROW]
[ROW][C]49[/C][C]5785[/C][C]5810.89025961186[/C][C]-25.8902596118642[/C][/ROW]
[ROW][C]50[/C][C]5785[/C][C]5784.77488088413[/C][C]0.225119115867528[/C][/ROW]
[ROW][C]51[/C][C]5806[/C][C]5784.96717692832[/C][C]21.0328230716832[/C][/ROW]
[ROW][C]52[/C][C]5827[/C][C]5823.93334856649[/C][C]3.06665143350892[/C][/ROW]
[ROW][C]53[/C][C]5856[/C][C]5847.55287262282[/C][C]8.447127377176[/C][/ROW]
[ROW][C]54[/C][C]5896[/C][C]5883.76838239014[/C][C]12.2316176098639[/C][/ROW]
[ROW][C]55[/C][C]5914[/C][C]5934.21659186931[/C][C]-20.216591869309[/C][/ROW]
[ROW][C]56[/C][C]5938[/C][C]5934.94764236952[/C][C]3.05235763048131[/C][/ROW]
[/TABLE]
Source: https://freestatistics.org/blog/index.php?pk=301732&T=2

Globally Unique Identifier (entire table): ba.freestatistics.org/blog/index.php?pk=301732&T=2

As an alternative you can also use a QR Code:  

The GUIDs for individual cells are displayed in the table below:

Interpolation Forecasts of Exponential Smoothing
tObservedFittedResiduals
351745177-3
452015193.437409389567.56259061043875
552215226.8973506192-5.897350619196
652055241.85985217812-36.8598521781232
752355194.3742818135140.6257181864885
852555259.07664313586-4.07664313585974
952725275.5943873285-3.59438732850413
1052995289.52407292249.47592707759759
1153185324.61838017382-6.61838017382161
1253405337.96498054392.03501945609605
1353855361.7032877939923.2967122060118
1454305426.603266445063.39673355493505
1554545474.50474561641-20.504745616412
1654935480.9896560877312.0103439122749
1755365530.248854266975.75114573302835
1855655578.16146495188-13.1614649518806
1955865595.91898278344-9.91898278344252
2055945608.44621873479-14.4462187347899
2155765604.10630390608-28.1063039060818
2255445562.09798707812-18.0979870781239
2355305514.6387431600415.3612568399594
2455365513.7602806742522.2397193257511
2555445538.757379315245.24262068476037
2655645551.2356094955312.7643905044733
2755965582.1389119137713.8610880862261
2855965625.97900997385-29.979009973852
2955995600.3710334841-1.37103348409983
3055915602.19990097312-11.1999009731162
3155665584.63298061593-18.632980615931
3255325543.7167468923-11.7167468923044
3354985499.7083383686-1.70833836860038
3454845464.2490810809919.7509189190087
3554425467.12025420412-25.1202542041237
3654475403.6626116856843.3373883143204
3754905445.6812731440944.3187268559095
3855445526.5381909132817.4618090867189
3955835595.45401358225-12.4540135822499
4056285623.815834159534.18416584046827
4156795672.389935524636.61006447536693
4256915729.03623191096-38.0362319109572
4357075708.54580166046-1.54580166045525
4457245723.225382720230.774617279772428
4557265740.88705837617-14.8870583761709
4657455730.1705797055614.8294202944408
4757675761.837824107165.16217589284406
4857895788.247338597970.752661402031663
4957855810.89025961186-25.8902596118642
5057855784.774880884130.225119115867528
5158065784.9671769283221.0328230716832
5258275823.933348566493.06665143350892
5358565847.552872622828.447127377176
5458965883.7683823901412.2316176098639
5559145934.21659186931-20.216591869309
5659385934.947642369523.05235763048131


Extrapolation Forecasts of Exponential Smoothing
tForecast95% Lower Bound95% Upper Bound
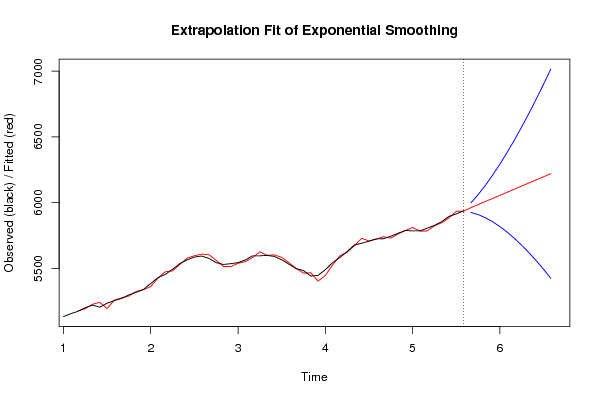
575961.554956704045925.719175518235997.39073788986
585985.109913408095909.615854196576060.60397261961
596008.664870112135885.703522822036131.62621740223
606032.219826816175854.966712019896209.47294161246
616055.774783520225818.138679471856293.41088756859
626079.329740224265775.767077347886382.89240310064
636102.88469692835728.277132430186477.49226142642
646126.439653632355676.010333044296576.8689742204
656149.994610336395619.248371226296680.74084944649
666173.549567040435558.228623572896788.87051050797
676197.104523744485493.154599456876901.05444803208
686220.659480448525424.203259886437017.1157010106

\begin{tabular}{lllllllll}
\hline
Extrapolation Forecasts of Exponential Smoothing \tabularnewline
t & Forecast & 95% Lower Bound & 95% Upper Bound \tabularnewline
57 & 5961.55495670404 & 5925.71917551823 & 5997.39073788986 \tabularnewline
58 & 5985.10991340809 & 5909.61585419657 & 6060.60397261961 \tabularnewline
59 & 6008.66487011213 & 5885.70352282203 & 6131.62621740223 \tabularnewline
60 & 6032.21982681617 & 5854.96671201989 & 6209.47294161246 \tabularnewline
61 & 6055.77478352022 & 5818.13867947185 & 6293.41088756859 \tabularnewline
62 & 6079.32974022426 & 5775.76707734788 & 6382.89240310064 \tabularnewline
63 & 6102.8846969283 & 5728.27713243018 & 6477.49226142642 \tabularnewline
64 & 6126.43965363235 & 5676.01033304429 & 6576.8689742204 \tabularnewline
65 & 6149.99461033639 & 5619.24837122629 & 6680.74084944649 \tabularnewline
66 & 6173.54956704043 & 5558.22862357289 & 6788.87051050797 \tabularnewline
67 & 6197.10452374448 & 5493.15459945687 & 6901.05444803208 \tabularnewline
68 & 6220.65948044852 & 5424.20325988643 & 7017.1157010106 \tabularnewline
\hline
\end{tabular}
%Source: https://freestatistics.org/blog/index.php?pk=301732&T=3

[TABLE]
[ROW][C]Extrapolation Forecasts of Exponential Smoothing[/C][/ROW]
[ROW][C]t[/C][C]Forecast[/C][C]95% Lower Bound[/C][C]95% Upper Bound[/C][/ROW]
[ROW][C]57[/C][C]5961.55495670404[/C][C]5925.71917551823[/C][C]5997.39073788986[/C][/ROW]
[ROW][C]58[/C][C]5985.10991340809[/C][C]5909.61585419657[/C][C]6060.60397261961[/C][/ROW]
[ROW][C]59[/C][C]6008.66487011213[/C][C]5885.70352282203[/C][C]6131.62621740223[/C][/ROW]
[ROW][C]60[/C][C]6032.21982681617[/C][C]5854.96671201989[/C][C]6209.47294161246[/C][/ROW]
[ROW][C]61[/C][C]6055.77478352022[/C][C]5818.13867947185[/C][C]6293.41088756859[/C][/ROW]
[ROW][C]62[/C][C]6079.32974022426[/C][C]5775.76707734788[/C][C]6382.89240310064[/C][/ROW]
[ROW][C]63[/C][C]6102.8846969283[/C][C]5728.27713243018[/C][C]6477.49226142642[/C][/ROW]
[ROW][C]64[/C][C]6126.43965363235[/C][C]5676.01033304429[/C][C]6576.8689742204[/C][/ROW]
[ROW][C]65[/C][C]6149.99461033639[/C][C]5619.24837122629[/C][C]6680.74084944649[/C][/ROW]
[ROW][C]66[/C][C]6173.54956704043[/C][C]5558.22862357289[/C][C]6788.87051050797[/C][/ROW]
[ROW][C]67[/C][C]6197.10452374448[/C][C]5493.15459945687[/C][C]6901.05444803208[/C][/ROW]
[ROW][C]68[/C][C]6220.65948044852[/C][C]5424.20325988643[/C][C]7017.1157010106[/C][/ROW]
[/TABLE]
Source: https://freestatistics.org/blog/index.php?pk=301732&T=3

Globally Unique Identifier (entire table): ba.freestatistics.org/blog/index.php?pk=301732&T=3

As an alternative you can also use a QR Code:  

The GUIDs for individual cells are displayed in the table below:

Extrapolation Forecasts of Exponential Smoothing
tForecast95% Lower Bound95% Upper Bound
575961.554956704045925.719175518235997.39073788986
585985.109913408095909.615854196576060.60397261961
596008.664870112135885.703522822036131.62621740223
606032.219826816175854.966712019896209.47294161246
616055.774783520225818.138679471856293.41088756859
626079.329740224265775.767077347886382.89240310064
636102.88469692835728.277132430186477.49226142642
646126.439653632355676.010333044296576.8689742204
656149.994610336395619.248371226296680.74084944649
666173.549567040435558.228623572896788.87051050797
676197.104523744485493.154599456876901.05444803208
686220.659480448525424.203259886437017.1157010106


Parameters (Session):
par1 = 12 ; par2 = Single ; par3 = multiplicative ; par4 = 12 ;
Parameters (R input):
par1 = 12 ; par2 = Double ; par3 = multiplicative ; par4 = 12 ;
R code (references can be found in the software module):
par4 <- '12'
par3 <- 'multiplicative'
par2 <- 'Double'
par1 <- '12'
par1 <- as.numeric(par1)
par4 <- as.numeric(par4)
if (par2 == 'Single') K <- 1
if (par2 == 'Double') K <- 2
if (par2 == 'Triple') K <- par1
nx <- length(x)
nxmK <- nx - K
x <- ts(x, frequency = par1)
if (par2 == 'Single') fit <- HoltWinters(x, gamma=F, beta=F)
if (par2 == 'Double') fit <- HoltWinters(x, gamma=F)
if (par2 == 'Triple') fit <- HoltWinters(x, seasonal=par3)
fit
myresid <- x - fit$fitted[,'xhat']
bitmap(file='test1.png')
op <- par(mfrow=c(2,1))
plot(fit,ylab='Observed (black) / Fitted (red)',main='Interpolation Fit of Exponential Smoothing')
plot(myresid,ylab='Residuals',main='Interpolation Prediction Errors')
par(op)
dev.off()
bitmap(file='test2.png')
p <- predict(fit, par4, prediction.interval=TRUE)
np <- length(p[,1])
plot(fit,p,ylab='Observed (black) / Fitted (red)',main='Extrapolation Fit of Exponential Smoothing')
dev.off()
bitmap(file='test3.png')
op <- par(mfrow = c(2,2))
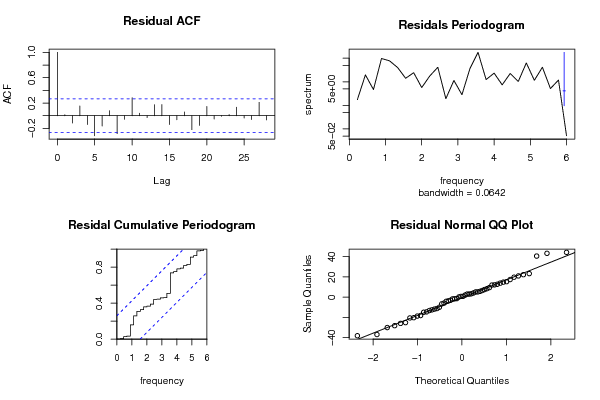
acf(as.numeric(myresid),lag.max = nx/2,main='Residual ACF')
spectrum(myresid,main='Residals Periodogram')
cpgram(myresid,main='Residal Cumulative Periodogram')
qqnorm(myresid,main='Residual Normal QQ Plot')
qqline(myresid)
par(op)
dev.off()
load(file='createtable')
a<-table.start()
a<-table.row.start(a)
a<-table.element(a,'Estimated Parameters of Exponential Smoothing',2,TRUE)
a<-table.row.end(a)
a<-table.row.start(a)
a<-table.element(a,'Parameter',header=TRUE)
a<-table.element(a,'Value',header=TRUE)
a<-table.row.end(a)
a<-table.row.start(a)
a<-table.element(a,'alpha',header=TRUE)
a<-table.element(a,fit$alpha)
a<-table.row.end(a)
a<-table.row.start(a)
a<-table.element(a,'beta',header=TRUE)
a<-table.element(a,fit$beta)
a<-table.row.end(a)
a<-table.row.start(a)
a<-table.element(a,'gamma',header=TRUE)
a<-table.element(a,fit$gamma)
a<-table.row.end(a)
a<-table.end(a)
table.save(a,file='mytable.tab')
a<-table.start()
a<-table.row.start(a)
a<-table.element(a,'Interpolation Forecasts of Exponential Smoothing',4,TRUE)
a<-table.row.end(a)
a<-table.row.start(a)
a<-table.element(a,'t',header=TRUE)
a<-table.element(a,'Observed',header=TRUE)
a<-table.element(a,'Fitted',header=TRUE)
a<-table.element(a,'Residuals',header=TRUE)
a<-table.row.end(a)
for (i in 1:nxmK) {
a<-table.row.start(a)
a<-table.element(a,i+K,header=TRUE)
a<-table.element(a,x[i+K])
a<-table.element(a,fit$fitted[i,'xhat'])
a<-table.element(a,myresid[i])
a<-table.row.end(a)
}
a<-table.end(a)
table.save(a,file='mytable1.tab')
a<-table.start()
a<-table.row.start(a)
a<-table.element(a,'Extrapolation Forecasts of Exponential Smoothing',4,TRUE)
a<-table.row.end(a)
a<-table.row.start(a)
a<-table.element(a,'t',header=TRUE)
a<-table.element(a,'Forecast',header=TRUE)
a<-table.element(a,'95% Lower Bound',header=TRUE)
a<-table.element(a,'95% Upper Bound',header=TRUE)
a<-table.row.end(a)
for (i in 1:np) {
a<-table.row.start(a)
a<-table.element(a,nx+i,header=TRUE)
a<-table.element(a,p[i,'fit'])
a<-table.element(a,p[i,'lwr'])
a<-table.element(a,p[i,'upr'])
a<-table.row.end(a)
}
a<-table.end(a)
table.save(a,file='mytable2.tab')