Free Statistics

of Irreproducible Research!

Author's title

Author*The author of this computation has been verified*
R Software Modulerwasp_autocorrelation.wasp
Title produced by software(Partial) Autocorrelation Function
Date of computationTue, 20 Dec 2016 15:01:10 +0100
Cite this page as followsStatistical Computations at FreeStatistics.org, Office for Research Development and Education, URL https://freestatistics.org/blog/index.php?v=date/2016/Dec/20/t1482242490jp3dxoulbgn0kys.htm/, Retrieved Fri, 01 Nov 2024 03:34:33 +0000
Statistical Computations at FreeStatistics.org, Office for Research Development and Education, URL https://freestatistics.org/blog/index.php?pk=301679, Retrieved Fri, 01 Nov 2024 03:34:33 +0000
QR Codes:

Original text written by user:
IsPrivate?No (this computation is public)
User-defined keywords
Estimated Impact103
Family? (F = Feedback message, R = changed R code, M = changed R Module, P = changed Parameters, D = changed Data)
-       [(Partial) Autocorrelation Function] [] [2016-12-20 14:01:10] [2e11ca31a00cf8de75c33c1af2d59434] [Current]
Feedback Forum

Post a new message
Dataseries X:
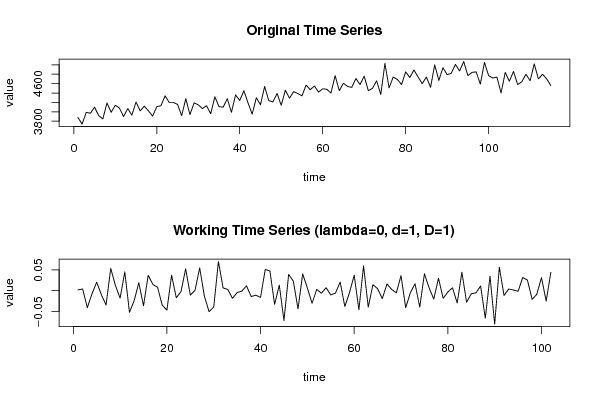
3880
3740
3990
3970
4100
3920
3850
4190
3990
4140
4080
3900
4070
3930
4210
4020
4120
4020
3910
4110
4130
4340
4200
4200
4160
3920
4280
3940
4190
4150
4070
4130
3960
4320
4110
4100
4280
3990
4360
4240
4450
4190
3950
4300
4150
4540
4240
4210
4390
4140
4460
4290
4430
4390
4340
4570
4470
4550
4420
4490
4480
4400
4770
4450
4610
4540
4520
4710
4580
4760
4450
4500
4660
4370
5030
4510
4740
4690
4580
4850
4730
4890
4740
4600
4740
4520
5000
4670
4940
4790
4820
5010
4870
5070
4770
4840
4850
4590
5050
4770
4720
4740
4400
4840
4650
4860
4580
4640
4800
4660
5020
4700
4800
4700
4560


Summary of computational transaction
Raw Input view raw input (R code)
Raw Outputview raw output of R engine
Computing time1 seconds
R ServerBig Analytics Cloud Computing Center

\begin{tabular}{lllllllll}
\hline
Summary of computational transaction \tabularnewline
Raw Input view raw input (R code)  \tabularnewline
Raw Outputview raw output of R engine  \tabularnewline
Computing time1 seconds \tabularnewline
R ServerBig Analytics Cloud Computing Center \tabularnewline
\hline
\end{tabular}
%Source: https://freestatistics.org/blog/index.php?pk=301679&T=0

[TABLE]
[ROW]
Summary of computational transaction[/C][/ROW] [ROW]Raw Input[/C] view raw input (R code) [/C][/ROW] [ROW]Raw Output[/C]view raw output of R engine [/C][/ROW] [ROW]Computing time[/C]1 seconds[/C][/ROW] [ROW]R Server[/C]Big Analytics Cloud Computing Center[/C][/ROW] [/TABLE] Source: https://freestatistics.org/blog/index.php?pk=301679&T=0

Globally Unique Identifier (entire table): ba.freestatistics.org/blog/index.php?pk=301679&T=0

As an alternative you can also use a QR Code:  

The GUIDs for individual cells are displayed in the table below:

Summary of computational transaction
Raw Input view raw input (R code)
Raw Outputview raw output of R engine
Computing time1 seconds
R ServerBig Analytics Cloud Computing Center


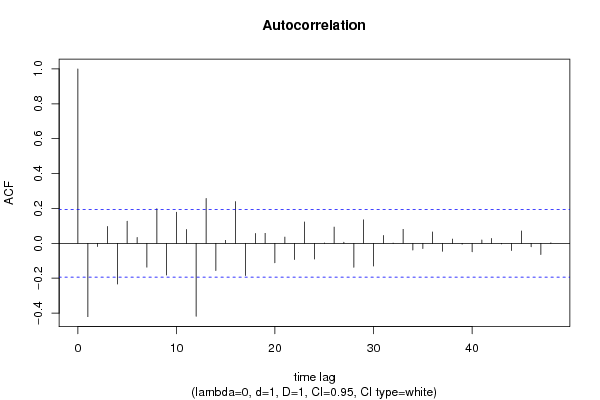
Autocorrelation Function
Time lag kACF(k)T-STATP-value
1-0.420295-4.24482.4e-05
2-0.017994-0.18170.428079
30.0970540.98020.164653
4-0.232868-2.35190.010301
50.1264251.27680.102281
60.0340580.3440.365791
7-0.136367-1.37720.085727
80.1986982.00670.023711
9-0.181503-1.83310.034853
100.1788161.8060.036937
110.0798810.80680.210842
12-0.41851-4.22672.6e-05
130.2573512.59910.005366
14-0.156141-1.57690.058952
150.0170790.17250.431698
160.2392492.41630.008728
17-0.18395-1.85780.033041
180.0569420.57510.283251
190.0572650.57840.282151
20-0.111767-1.12880.130816
210.0358440.3620.359048
22-0.092258-0.93180.17683
230.1223641.23580.109683
24-0.089512-0.9040.184054
250.0016360.01650.493425
260.0932750.9420.1742
270.0063350.0640.474555
28-0.137097-1.38460.084596
290.1347281.36070.088306
30-0.129967-1.31260.096132
310.0446020.45050.326668
32-0.001121-0.01130.495494
330.0801310.80930.210118
34-0.037734-0.38110.351961
35-0.029645-0.29940.382622
360.0653930.66040.25523
37-0.045268-0.45720.324257
380.0242710.24510.403427
39-0.004629-0.04680.481401
40-0.047972-0.48450.314538
410.0188950.19080.424518
420.0281020.28380.388565
43-0.00294-0.02970.488185
44-0.041217-0.41630.339043
450.0711780.71890.236936
46-0.019226-0.19420.423214
47-0.064147-0.64790.259268
480.0028710.0290.488464

\begin{tabular}{lllllllll}
\hline
Autocorrelation Function \tabularnewline
Time lag k & ACF(k) & T-STAT & P-value \tabularnewline
1 & -0.420295 & -4.2448 & 2.4e-05 \tabularnewline
2 & -0.017994 & -0.1817 & 0.428079 \tabularnewline
3 & 0.097054 & 0.9802 & 0.164653 \tabularnewline
4 & -0.232868 & -2.3519 & 0.010301 \tabularnewline
5 & 0.126425 & 1.2768 & 0.102281 \tabularnewline
6 & 0.034058 & 0.344 & 0.365791 \tabularnewline
7 & -0.136367 & -1.3772 & 0.085727 \tabularnewline
8 & 0.198698 & 2.0067 & 0.023711 \tabularnewline
9 & -0.181503 & -1.8331 & 0.034853 \tabularnewline
10 & 0.178816 & 1.806 & 0.036937 \tabularnewline
11 & 0.079881 & 0.8068 & 0.210842 \tabularnewline
12 & -0.41851 & -4.2267 & 2.6e-05 \tabularnewline
13 & 0.257351 & 2.5991 & 0.005366 \tabularnewline
14 & -0.156141 & -1.5769 & 0.058952 \tabularnewline
15 & 0.017079 & 0.1725 & 0.431698 \tabularnewline
16 & 0.239249 & 2.4163 & 0.008728 \tabularnewline
17 & -0.18395 & -1.8578 & 0.033041 \tabularnewline
18 & 0.056942 & 0.5751 & 0.283251 \tabularnewline
19 & 0.057265 & 0.5784 & 0.282151 \tabularnewline
20 & -0.111767 & -1.1288 & 0.130816 \tabularnewline
21 & 0.035844 & 0.362 & 0.359048 \tabularnewline
22 & -0.092258 & -0.9318 & 0.17683 \tabularnewline
23 & 0.122364 & 1.2358 & 0.109683 \tabularnewline
24 & -0.089512 & -0.904 & 0.184054 \tabularnewline
25 & 0.001636 & 0.0165 & 0.493425 \tabularnewline
26 & 0.093275 & 0.942 & 0.1742 \tabularnewline
27 & 0.006335 & 0.064 & 0.474555 \tabularnewline
28 & -0.137097 & -1.3846 & 0.084596 \tabularnewline
29 & 0.134728 & 1.3607 & 0.088306 \tabularnewline
30 & -0.129967 & -1.3126 & 0.096132 \tabularnewline
31 & 0.044602 & 0.4505 & 0.326668 \tabularnewline
32 & -0.001121 & -0.0113 & 0.495494 \tabularnewline
33 & 0.080131 & 0.8093 & 0.210118 \tabularnewline
34 & -0.037734 & -0.3811 & 0.351961 \tabularnewline
35 & -0.029645 & -0.2994 & 0.382622 \tabularnewline
36 & 0.065393 & 0.6604 & 0.25523 \tabularnewline
37 & -0.045268 & -0.4572 & 0.324257 \tabularnewline
38 & 0.024271 & 0.2451 & 0.403427 \tabularnewline
39 & -0.004629 & -0.0468 & 0.481401 \tabularnewline
40 & -0.047972 & -0.4845 & 0.314538 \tabularnewline
41 & 0.018895 & 0.1908 & 0.424518 \tabularnewline
42 & 0.028102 & 0.2838 & 0.388565 \tabularnewline
43 & -0.00294 & -0.0297 & 0.488185 \tabularnewline
44 & -0.041217 & -0.4163 & 0.339043 \tabularnewline
45 & 0.071178 & 0.7189 & 0.236936 \tabularnewline
46 & -0.019226 & -0.1942 & 0.423214 \tabularnewline
47 & -0.064147 & -0.6479 & 0.259268 \tabularnewline
48 & 0.002871 & 0.029 & 0.488464 \tabularnewline
\hline
\end{tabular}
%Source: https://freestatistics.org/blog/index.php?pk=301679&T=1

[TABLE]
[ROW][C]Autocorrelation Function[/C][/ROW]
[ROW][C]Time lag k[/C][C]ACF(k)[/C][C]T-STAT[/C][C]P-value[/C][/ROW]
[ROW][C]1[/C][C]-0.420295[/C][C]-4.2448[/C][C]2.4e-05[/C][/ROW]
[ROW][C]2[/C][C]-0.017994[/C][C]-0.1817[/C][C]0.428079[/C][/ROW]
[ROW][C]3[/C][C]0.097054[/C][C]0.9802[/C][C]0.164653[/C][/ROW]
[ROW][C]4[/C][C]-0.232868[/C][C]-2.3519[/C][C]0.010301[/C][/ROW]
[ROW][C]5[/C][C]0.126425[/C][C]1.2768[/C][C]0.102281[/C][/ROW]
[ROW][C]6[/C][C]0.034058[/C][C]0.344[/C][C]0.365791[/C][/ROW]
[ROW][C]7[/C][C]-0.136367[/C][C]-1.3772[/C][C]0.085727[/C][/ROW]
[ROW][C]8[/C][C]0.198698[/C][C]2.0067[/C][C]0.023711[/C][/ROW]
[ROW][C]9[/C][C]-0.181503[/C][C]-1.8331[/C][C]0.034853[/C][/ROW]
[ROW][C]10[/C][C]0.178816[/C][C]1.806[/C][C]0.036937[/C][/ROW]
[ROW][C]11[/C][C]0.079881[/C][C]0.8068[/C][C]0.210842[/C][/ROW]
[ROW][C]12[/C][C]-0.41851[/C][C]-4.2267[/C][C]2.6e-05[/C][/ROW]
[ROW][C]13[/C][C]0.257351[/C][C]2.5991[/C][C]0.005366[/C][/ROW]
[ROW][C]14[/C][C]-0.156141[/C][C]-1.5769[/C][C]0.058952[/C][/ROW]
[ROW][C]15[/C][C]0.017079[/C][C]0.1725[/C][C]0.431698[/C][/ROW]
[ROW][C]16[/C][C]0.239249[/C][C]2.4163[/C][C]0.008728[/C][/ROW]
[ROW][C]17[/C][C]-0.18395[/C][C]-1.8578[/C][C]0.033041[/C][/ROW]
[ROW][C]18[/C][C]0.056942[/C][C]0.5751[/C][C]0.283251[/C][/ROW]
[ROW][C]19[/C][C]0.057265[/C][C]0.5784[/C][C]0.282151[/C][/ROW]
[ROW][C]20[/C][C]-0.111767[/C][C]-1.1288[/C][C]0.130816[/C][/ROW]
[ROW][C]21[/C][C]0.035844[/C][C]0.362[/C][C]0.359048[/C][/ROW]
[ROW][C]22[/C][C]-0.092258[/C][C]-0.9318[/C][C]0.17683[/C][/ROW]
[ROW][C]23[/C][C]0.122364[/C][C]1.2358[/C][C]0.109683[/C][/ROW]
[ROW][C]24[/C][C]-0.089512[/C][C]-0.904[/C][C]0.184054[/C][/ROW]
[ROW][C]25[/C][C]0.001636[/C][C]0.0165[/C][C]0.493425[/C][/ROW]
[ROW][C]26[/C][C]0.093275[/C][C]0.942[/C][C]0.1742[/C][/ROW]
[ROW][C]27[/C][C]0.006335[/C][C]0.064[/C][C]0.474555[/C][/ROW]
[ROW][C]28[/C][C]-0.137097[/C][C]-1.3846[/C][C]0.084596[/C][/ROW]
[ROW][C]29[/C][C]0.134728[/C][C]1.3607[/C][C]0.088306[/C][/ROW]
[ROW][C]30[/C][C]-0.129967[/C][C]-1.3126[/C][C]0.096132[/C][/ROW]
[ROW][C]31[/C][C]0.044602[/C][C]0.4505[/C][C]0.326668[/C][/ROW]
[ROW][C]32[/C][C]-0.001121[/C][C]-0.0113[/C][C]0.495494[/C][/ROW]
[ROW][C]33[/C][C]0.080131[/C][C]0.8093[/C][C]0.210118[/C][/ROW]
[ROW][C]34[/C][C]-0.037734[/C][C]-0.3811[/C][C]0.351961[/C][/ROW]
[ROW][C]35[/C][C]-0.029645[/C][C]-0.2994[/C][C]0.382622[/C][/ROW]
[ROW][C]36[/C][C]0.065393[/C][C]0.6604[/C][C]0.25523[/C][/ROW]
[ROW][C]37[/C][C]-0.045268[/C][C]-0.4572[/C][C]0.324257[/C][/ROW]
[ROW][C]38[/C][C]0.024271[/C][C]0.2451[/C][C]0.403427[/C][/ROW]
[ROW][C]39[/C][C]-0.004629[/C][C]-0.0468[/C][C]0.481401[/C][/ROW]
[ROW][C]40[/C][C]-0.047972[/C][C]-0.4845[/C][C]0.314538[/C][/ROW]
[ROW][C]41[/C][C]0.018895[/C][C]0.1908[/C][C]0.424518[/C][/ROW]
[ROW][C]42[/C][C]0.028102[/C][C]0.2838[/C][C]0.388565[/C][/ROW]
[ROW][C]43[/C][C]-0.00294[/C][C]-0.0297[/C][C]0.488185[/C][/ROW]
[ROW][C]44[/C][C]-0.041217[/C][C]-0.4163[/C][C]0.339043[/C][/ROW]
[ROW][C]45[/C][C]0.071178[/C][C]0.7189[/C][C]0.236936[/C][/ROW]
[ROW][C]46[/C][C]-0.019226[/C][C]-0.1942[/C][C]0.423214[/C][/ROW]
[ROW][C]47[/C][C]-0.064147[/C][C]-0.6479[/C][C]0.259268[/C][/ROW]
[ROW][C]48[/C][C]0.002871[/C][C]0.029[/C][C]0.488464[/C][/ROW]
[/TABLE]
Source: https://freestatistics.org/blog/index.php?pk=301679&T=1

Globally Unique Identifier (entire table): ba.freestatistics.org/blog/index.php?pk=301679&T=1

As an alternative you can also use a QR Code:  

The GUIDs for individual cells are displayed in the table below:

Autocorrelation Function
Time lag kACF(k)T-STATP-value
1-0.420295-4.24482.4e-05
2-0.017994-0.18170.428079
30.0970540.98020.164653
4-0.232868-2.35190.010301
50.1264251.27680.102281
60.0340580.3440.365791
7-0.136367-1.37720.085727
80.1986982.00670.023711
9-0.181503-1.83310.034853
100.1788161.8060.036937
110.0798810.80680.210842
12-0.41851-4.22672.6e-05
130.2573512.59910.005366
14-0.156141-1.57690.058952
150.0170790.17250.431698
160.2392492.41630.008728
17-0.18395-1.85780.033041
180.0569420.57510.283251
190.0572650.57840.282151
20-0.111767-1.12880.130816
210.0358440.3620.359048
22-0.092258-0.93180.17683
230.1223641.23580.109683
24-0.089512-0.9040.184054
250.0016360.01650.493425
260.0932750.9420.1742
270.0063350.0640.474555
28-0.137097-1.38460.084596
290.1347281.36070.088306
30-0.129967-1.31260.096132
310.0446020.45050.326668
32-0.001121-0.01130.495494
330.0801310.80930.210118
34-0.037734-0.38110.351961
35-0.029645-0.29940.382622
360.0653930.66040.25523
37-0.045268-0.45720.324257
380.0242710.24510.403427
39-0.004629-0.04680.481401
40-0.047972-0.48450.314538
410.0188950.19080.424518
420.0281020.28380.388565
43-0.00294-0.02970.488185
44-0.041217-0.41630.339043
450.0711780.71890.236936
46-0.019226-0.19420.423214
47-0.064147-0.64790.259268
480.0028710.0290.488464


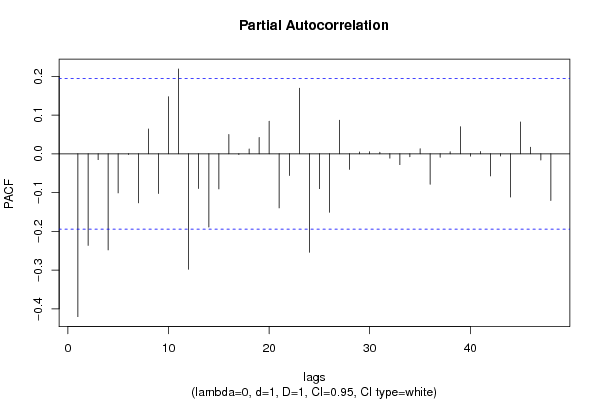
Partial Autocorrelation Function
Time lag kPACF(k)T-STATP-value
1-0.420295-4.24482.4e-05
2-0.236401-2.38750.009402
3-0.014992-0.15140.439974
4-0.248062-2.50530.006909
5-0.100861-1.01860.15539
6-0.001817-0.01830.492699
7-0.126566-1.27830.10203
80.0642510.64890.258928
9-0.102498-1.03520.151516
100.1474221.48890.0698
110.2190622.21240.014584
12-0.298158-3.01120.00164
13-0.089667-0.90560.183644
14-0.188936-1.90820.029591
15-0.090581-0.91480.181221
160.0498740.50370.307779
17-0.001809-0.01830.49273
180.01260.12730.449495
190.0419730.42390.336265
200.0842080.85050.198532
21-0.139551-1.40940.08088
22-0.05594-0.5650.286668
230.1692911.70980.045176
24-0.254272-2.5680.005839
25-0.089901-0.9080.183022
26-0.150664-1.52160.065598
270.0864960.87360.192204
28-0.040247-0.40650.342622
290.0045130.04560.481867
300.0052540.05310.478894
310.003910.03950.484288
32-0.011133-0.11240.455347
33-0.027902-0.28180.389336
34-0.007735-0.07810.468942
350.0130760.13210.447599
36-0.078557-0.79340.214696
37-0.009033-0.09120.463743
380.005350.0540.478509
390.0696950.70390.241554
40-0.006036-0.0610.475755
410.0060590.06120.475661
42-0.05698-0.57550.28312
43-0.005594-0.05650.47753
44-0.111449-1.12560.131492
450.0821590.82980.204306
460.0171130.17280.431564
47-0.015964-0.16120.436118
48-0.120642-1.21840.112937

\begin{tabular}{lllllllll}
\hline
Partial Autocorrelation Function \tabularnewline
Time lag k & PACF(k) & T-STAT & P-value \tabularnewline
1 & -0.420295 & -4.2448 & 2.4e-05 \tabularnewline
2 & -0.236401 & -2.3875 & 0.009402 \tabularnewline
3 & -0.014992 & -0.1514 & 0.439974 \tabularnewline
4 & -0.248062 & -2.5053 & 0.006909 \tabularnewline
5 & -0.100861 & -1.0186 & 0.15539 \tabularnewline
6 & -0.001817 & -0.0183 & 0.492699 \tabularnewline
7 & -0.126566 & -1.2783 & 0.10203 \tabularnewline
8 & 0.064251 & 0.6489 & 0.258928 \tabularnewline
9 & -0.102498 & -1.0352 & 0.151516 \tabularnewline
10 & 0.147422 & 1.4889 & 0.0698 \tabularnewline
11 & 0.219062 & 2.2124 & 0.014584 \tabularnewline
12 & -0.298158 & -3.0112 & 0.00164 \tabularnewline
13 & -0.089667 & -0.9056 & 0.183644 \tabularnewline
14 & -0.188936 & -1.9082 & 0.029591 \tabularnewline
15 & -0.090581 & -0.9148 & 0.181221 \tabularnewline
16 & 0.049874 & 0.5037 & 0.307779 \tabularnewline
17 & -0.001809 & -0.0183 & 0.49273 \tabularnewline
18 & 0.0126 & 0.1273 & 0.449495 \tabularnewline
19 & 0.041973 & 0.4239 & 0.336265 \tabularnewline
20 & 0.084208 & 0.8505 & 0.198532 \tabularnewline
21 & -0.139551 & -1.4094 & 0.08088 \tabularnewline
22 & -0.05594 & -0.565 & 0.286668 \tabularnewline
23 & 0.169291 & 1.7098 & 0.045176 \tabularnewline
24 & -0.254272 & -2.568 & 0.005839 \tabularnewline
25 & -0.089901 & -0.908 & 0.183022 \tabularnewline
26 & -0.150664 & -1.5216 & 0.065598 \tabularnewline
27 & 0.086496 & 0.8736 & 0.192204 \tabularnewline
28 & -0.040247 & -0.4065 & 0.342622 \tabularnewline
29 & 0.004513 & 0.0456 & 0.481867 \tabularnewline
30 & 0.005254 & 0.0531 & 0.478894 \tabularnewline
31 & 0.00391 & 0.0395 & 0.484288 \tabularnewline
32 & -0.011133 & -0.1124 & 0.455347 \tabularnewline
33 & -0.027902 & -0.2818 & 0.389336 \tabularnewline
34 & -0.007735 & -0.0781 & 0.468942 \tabularnewline
35 & 0.013076 & 0.1321 & 0.447599 \tabularnewline
36 & -0.078557 & -0.7934 & 0.214696 \tabularnewline
37 & -0.009033 & -0.0912 & 0.463743 \tabularnewline
38 & 0.00535 & 0.054 & 0.478509 \tabularnewline
39 & 0.069695 & 0.7039 & 0.241554 \tabularnewline
40 & -0.006036 & -0.061 & 0.475755 \tabularnewline
41 & 0.006059 & 0.0612 & 0.475661 \tabularnewline
42 & -0.05698 & -0.5755 & 0.28312 \tabularnewline
43 & -0.005594 & -0.0565 & 0.47753 \tabularnewline
44 & -0.111449 & -1.1256 & 0.131492 \tabularnewline
45 & 0.082159 & 0.8298 & 0.204306 \tabularnewline
46 & 0.017113 & 0.1728 & 0.431564 \tabularnewline
47 & -0.015964 & -0.1612 & 0.436118 \tabularnewline
48 & -0.120642 & -1.2184 & 0.112937 \tabularnewline
\hline
\end{tabular}
%Source: https://freestatistics.org/blog/index.php?pk=301679&T=2

[TABLE]
[ROW][C]Partial Autocorrelation Function[/C][/ROW]
[ROW][C]Time lag k[/C][C]PACF(k)[/C][C]T-STAT[/C][C]P-value[/C][/ROW]
[ROW][C]1[/C][C]-0.420295[/C][C]-4.2448[/C][C]2.4e-05[/C][/ROW]
[ROW][C]2[/C][C]-0.236401[/C][C]-2.3875[/C][C]0.009402[/C][/ROW]
[ROW][C]3[/C][C]-0.014992[/C][C]-0.1514[/C][C]0.439974[/C][/ROW]
[ROW][C]4[/C][C]-0.248062[/C][C]-2.5053[/C][C]0.006909[/C][/ROW]
[ROW][C]5[/C][C]-0.100861[/C][C]-1.0186[/C][C]0.15539[/C][/ROW]
[ROW][C]6[/C][C]-0.001817[/C][C]-0.0183[/C][C]0.492699[/C][/ROW]
[ROW][C]7[/C][C]-0.126566[/C][C]-1.2783[/C][C]0.10203[/C][/ROW]
[ROW][C]8[/C][C]0.064251[/C][C]0.6489[/C][C]0.258928[/C][/ROW]
[ROW][C]9[/C][C]-0.102498[/C][C]-1.0352[/C][C]0.151516[/C][/ROW]
[ROW][C]10[/C][C]0.147422[/C][C]1.4889[/C][C]0.0698[/C][/ROW]
[ROW][C]11[/C][C]0.219062[/C][C]2.2124[/C][C]0.014584[/C][/ROW]
[ROW][C]12[/C][C]-0.298158[/C][C]-3.0112[/C][C]0.00164[/C][/ROW]
[ROW][C]13[/C][C]-0.089667[/C][C]-0.9056[/C][C]0.183644[/C][/ROW]
[ROW][C]14[/C][C]-0.188936[/C][C]-1.9082[/C][C]0.029591[/C][/ROW]
[ROW][C]15[/C][C]-0.090581[/C][C]-0.9148[/C][C]0.181221[/C][/ROW]
[ROW][C]16[/C][C]0.049874[/C][C]0.5037[/C][C]0.307779[/C][/ROW]
[ROW][C]17[/C][C]-0.001809[/C][C]-0.0183[/C][C]0.49273[/C][/ROW]
[ROW][C]18[/C][C]0.0126[/C][C]0.1273[/C][C]0.449495[/C][/ROW]
[ROW][C]19[/C][C]0.041973[/C][C]0.4239[/C][C]0.336265[/C][/ROW]
[ROW][C]20[/C][C]0.084208[/C][C]0.8505[/C][C]0.198532[/C][/ROW]
[ROW][C]21[/C][C]-0.139551[/C][C]-1.4094[/C][C]0.08088[/C][/ROW]
[ROW][C]22[/C][C]-0.05594[/C][C]-0.565[/C][C]0.286668[/C][/ROW]
[ROW][C]23[/C][C]0.169291[/C][C]1.7098[/C][C]0.045176[/C][/ROW]
[ROW][C]24[/C][C]-0.254272[/C][C]-2.568[/C][C]0.005839[/C][/ROW]
[ROW][C]25[/C][C]-0.089901[/C][C]-0.908[/C][C]0.183022[/C][/ROW]
[ROW][C]26[/C][C]-0.150664[/C][C]-1.5216[/C][C]0.065598[/C][/ROW]
[ROW][C]27[/C][C]0.086496[/C][C]0.8736[/C][C]0.192204[/C][/ROW]
[ROW][C]28[/C][C]-0.040247[/C][C]-0.4065[/C][C]0.342622[/C][/ROW]
[ROW][C]29[/C][C]0.004513[/C][C]0.0456[/C][C]0.481867[/C][/ROW]
[ROW][C]30[/C][C]0.005254[/C][C]0.0531[/C][C]0.478894[/C][/ROW]
[ROW][C]31[/C][C]0.00391[/C][C]0.0395[/C][C]0.484288[/C][/ROW]
[ROW][C]32[/C][C]-0.011133[/C][C]-0.1124[/C][C]0.455347[/C][/ROW]
[ROW][C]33[/C][C]-0.027902[/C][C]-0.2818[/C][C]0.389336[/C][/ROW]
[ROW][C]34[/C][C]-0.007735[/C][C]-0.0781[/C][C]0.468942[/C][/ROW]
[ROW][C]35[/C][C]0.013076[/C][C]0.1321[/C][C]0.447599[/C][/ROW]
[ROW][C]36[/C][C]-0.078557[/C][C]-0.7934[/C][C]0.214696[/C][/ROW]
[ROW][C]37[/C][C]-0.009033[/C][C]-0.0912[/C][C]0.463743[/C][/ROW]
[ROW][C]38[/C][C]0.00535[/C][C]0.054[/C][C]0.478509[/C][/ROW]
[ROW][C]39[/C][C]0.069695[/C][C]0.7039[/C][C]0.241554[/C][/ROW]
[ROW][C]40[/C][C]-0.006036[/C][C]-0.061[/C][C]0.475755[/C][/ROW]
[ROW][C]41[/C][C]0.006059[/C][C]0.0612[/C][C]0.475661[/C][/ROW]
[ROW][C]42[/C][C]-0.05698[/C][C]-0.5755[/C][C]0.28312[/C][/ROW]
[ROW][C]43[/C][C]-0.005594[/C][C]-0.0565[/C][C]0.47753[/C][/ROW]
[ROW][C]44[/C][C]-0.111449[/C][C]-1.1256[/C][C]0.131492[/C][/ROW]
[ROW][C]45[/C][C]0.082159[/C][C]0.8298[/C][C]0.204306[/C][/ROW]
[ROW][C]46[/C][C]0.017113[/C][C]0.1728[/C][C]0.431564[/C][/ROW]
[ROW][C]47[/C][C]-0.015964[/C][C]-0.1612[/C][C]0.436118[/C][/ROW]
[ROW][C]48[/C][C]-0.120642[/C][C]-1.2184[/C][C]0.112937[/C][/ROW]
[/TABLE]
Source: https://freestatistics.org/blog/index.php?pk=301679&T=2

Globally Unique Identifier (entire table): ba.freestatistics.org/blog/index.php?pk=301679&T=2

As an alternative you can also use a QR Code:  

The GUIDs for individual cells are displayed in the table below:

Partial Autocorrelation Function
Time lag kPACF(k)T-STATP-value
1-0.420295-4.24482.4e-05
2-0.236401-2.38750.009402
3-0.014992-0.15140.439974
4-0.248062-2.50530.006909
5-0.100861-1.01860.15539
6-0.001817-0.01830.492699
7-0.126566-1.27830.10203
80.0642510.64890.258928
9-0.102498-1.03520.151516
100.1474221.48890.0698
110.2190622.21240.014584
12-0.298158-3.01120.00164
13-0.089667-0.90560.183644
14-0.188936-1.90820.029591
15-0.090581-0.91480.181221
160.0498740.50370.307779
17-0.001809-0.01830.49273
180.01260.12730.449495
190.0419730.42390.336265
200.0842080.85050.198532
21-0.139551-1.40940.08088
22-0.05594-0.5650.286668
230.1692911.70980.045176
24-0.254272-2.5680.005839
25-0.089901-0.9080.183022
26-0.150664-1.52160.065598
270.0864960.87360.192204
28-0.040247-0.40650.342622
290.0045130.04560.481867
300.0052540.05310.478894
310.003910.03950.484288
32-0.011133-0.11240.455347
33-0.027902-0.28180.389336
34-0.007735-0.07810.468942
350.0130760.13210.447599
36-0.078557-0.79340.214696
37-0.009033-0.09120.463743
380.005350.0540.478509
390.0696950.70390.241554
40-0.006036-0.0610.475755
410.0060590.06120.475661
42-0.05698-0.57550.28312
43-0.005594-0.05650.47753
44-0.111449-1.12560.131492
450.0821590.82980.204306
460.0171130.17280.431564
47-0.015964-0.16120.436118
48-0.120642-1.21840.112937


Parameters (Session):
par1 = 1 ; par2 = 2 ; par3 = 0.95 ; par4 = two.sided ; par5 = unpaired ; par6 = 0.0 ;
Parameters (R input):
par1 = 48 ; par2 = 0.0 ; par3 = 1 ; par4 = 1 ; par5 = 12 ; par6 = White Noise ; par7 = 0.95 ; par8 = ;
R code (references can be found in the software module):
if (par1 == 'Default') {
par1 = 10*log10(length(x))
} else {
par1 <- as.numeric(par1)
}
par2 <- as.numeric(par2)
par3 <- as.numeric(par3)
par4 <- as.numeric(par4)
par5 <- as.numeric(par5)
if (par6 == 'White Noise') par6 <- 'white' else par6 <- 'ma'
par7 <- as.numeric(par7)
if (par8 != '') par8 <- as.numeric(par8)
x <- na.omit(x)
ox <- x
if (par8 == '') {
if (par2 == 0) {
x <- log(x)
} else {
x <- (x ^ par2 - 1) / par2
}
} else {
x <- log(x,base=par8)
}
if (par3 > 0) x <- diff(x,lag=1,difference=par3)
if (par4 > 0) x <- diff(x,lag=par5,difference=par4)
bitmap(file='picts.png')
op <- par(mfrow=c(2,1))
plot(ox,type='l',main='Original Time Series',xlab='time',ylab='value')
if (par8=='') {
mytitle <- paste('Working Time Series (lambda=',par2,', d=',par3,', D=',par4,')',sep='')
mysub <- paste('(lambda=',par2,', d=',par3,', D=',par4,', CI=', par7, ', CI type=',par6,')',sep='')
} else {
mytitle <- paste('Working Time Series (base=',par8,', d=',par3,', D=',par4,')',sep='')
mysub <- paste('(base=',par8,', d=',par3,', D=',par4,', CI=', par7, ', CI type=',par6,')',sep='')
}
plot(x,type='l', main=mytitle,xlab='time',ylab='value')
par(op)
dev.off()
bitmap(file='pic1.png')
racf <- acf(x, par1, main='Autocorrelation', xlab='time lag', ylab='ACF', ci.type=par6, ci=par7, sub=mysub)
dev.off()
bitmap(file='pic2.png')
rpacf <- pacf(x,par1,main='Partial Autocorrelation',xlab='lags',ylab='PACF',sub=mysub)
dev.off()
(myacf <- c(racf$acf))
(mypacf <- c(rpacf$acf))
lengthx <- length(x)
sqrtn <- sqrt(lengthx)
load(file='createtable')
a<-table.start()
a<-table.row.start(a)
a<-table.element(a,'Autocorrelation Function',4,TRUE)
a<-table.row.end(a)
a<-table.row.start(a)
a<-table.element(a,'Time lag k',header=TRUE)
a<-table.element(a,'ACF(k)',header=TRUE)
a<-table.element(a,'T-STAT',header=TRUE)
a<-table.element(a,'P-value',header=TRUE)
a<-table.row.end(a)
for (i in 2:(par1+1)) {
a<-table.row.start(a)
a<-table.element(a,i-1,header=TRUE)
a<-table.element(a,round(myacf[i],6))
mytstat <- myacf[i]*sqrtn
a<-table.element(a,round(mytstat,4))
a<-table.element(a,round(1-pt(abs(mytstat),lengthx),6))
a<-table.row.end(a)
}
a<-table.end(a)
table.save(a,file='mytable.tab')
a<-table.start()
a<-table.row.start(a)
a<-table.element(a,'Partial Autocorrelation Function',4,TRUE)
a<-table.row.end(a)
a<-table.row.start(a)
a<-table.element(a,'Time lag k',header=TRUE)
a<-table.element(a,'PACF(k)',header=TRUE)
a<-table.element(a,'T-STAT',header=TRUE)
a<-table.element(a,'P-value',header=TRUE)
a<-table.row.end(a)
for (i in 1:par1) {
a<-table.row.start(a)
a<-table.element(a,i,header=TRUE)
a<-table.element(a,round(mypacf[i],6))
mytstat <- mypacf[i]*sqrtn
a<-table.element(a,round(mytstat,4))
a<-table.element(a,round(1-pt(abs(mytstat),lengthx),6))
a<-table.row.end(a)
}
a<-table.end(a)
table.save(a,file='mytable1.tab')