Free Statistics

of Irreproducible Research!

Author's title

Author*The author of this computation has been verified*
R Software Modulerwasp_exponentialsmoothing.wasp
Title produced by softwareExponential Smoothing
Date of computationTue, 20 Dec 2016 11:08:01 +0100
Cite this page as followsStatistical Computations at FreeStatistics.org, Office for Research Development and Education, URL https://freestatistics.org/blog/index.php?v=date/2016/Dec/20/t1482228789l79gstm5jbr0iei.htm/, Retrieved Fri, 01 Nov 2024 03:27:49 +0000
Statistical Computations at FreeStatistics.org, Office for Research Development and Education, URL https://freestatistics.org/blog/index.php?pk=301568, Retrieved Fri, 01 Nov 2024 03:27:49 +0000
QR Codes:

Original text written by user:
IsPrivate?No (this computation is public)
User-defined keywords
Estimated Impact173
Family? (F = Feedback message, R = changed R code, M = changed R Module, P = changed Parameters, D = changed Data)
-       [Exponential Smoothing] [] [2016-12-20 10:08:01] [b2e25925e4919b0d6985405fcb461c0d] [Current]
Feedback Forum

Post a new message
Dataseries X:
4400
4400
5400
7300
7200
7100
7000
10000
10100
9400
8500
8300
9200
10400
11700
12200
10400
10400
9800
9200


Summary of computational transaction
Raw Input view raw input (R code)
Raw Outputview raw output of R engine
Computing time1 seconds
R ServerBig Analytics Cloud Computing Center

\begin{tabular}{lllllllll}
\hline
Summary of computational transaction \tabularnewline
Raw Input view raw input (R code)  \tabularnewline
Raw Outputview raw output of R engine  \tabularnewline
Computing time1 seconds \tabularnewline
R ServerBig Analytics Cloud Computing Center \tabularnewline
\hline
\end{tabular}
%Source: https://freestatistics.org/blog/index.php?pk=301568&T=0

[TABLE]
[ROW]
Summary of computational transaction[/C][/ROW] [ROW]Raw Input[/C] view raw input (R code) [/C][/ROW] [ROW]Raw Output[/C]view raw output of R engine [/C][/ROW] [ROW]Computing time[/C]1 seconds[/C][/ROW] [ROW]R Server[/C]Big Analytics Cloud Computing Center[/C][/ROW] [/TABLE] Source: https://freestatistics.org/blog/index.php?pk=301568&T=0

Globally Unique Identifier (entire table): ba.freestatistics.org/blog/index.php?pk=301568&T=0

As an alternative you can also use a QR Code:  

The GUIDs for individual cells are displayed in the table below:

Summary of computational transaction
Raw Input view raw input (R code)
Raw Outputview raw output of R engine
Computing time1 seconds
R ServerBig Analytics Cloud Computing Center


Estimated Parameters of Exponential Smoothing
ParameterValue
alpha0.579111871216531
beta0
gamma0

\begin{tabular}{lllllllll}
\hline
Estimated Parameters of Exponential Smoothing \tabularnewline
Parameter & Value \tabularnewline
alpha & 0.579111871216531 \tabularnewline
beta & 0 \tabularnewline
gamma & 0 \tabularnewline
\hline
\end{tabular}
%Source: https://freestatistics.org/blog/index.php?pk=301568&T=1

[TABLE]
[ROW][C]Estimated Parameters of Exponential Smoothing[/C][/ROW]
[ROW][C]Parameter[/C][C]Value[/C][/ROW]
[ROW][C]alpha[/C][C]0.579111871216531[/C][/ROW]
[ROW][C]beta[/C][C]0[/C][/ROW]
[ROW][C]gamma[/C][C]0[/C][/ROW]
[/TABLE]
Source: https://freestatistics.org/blog/index.php?pk=301568&T=1

Globally Unique Identifier (entire table): ba.freestatistics.org/blog/index.php?pk=301568&T=1

As an alternative you can also use a QR Code:  

The GUIDs for individual cells are displayed in the table below:

Estimated Parameters of Exponential Smoothing
ParameterValue
alpha0.579111871216531
beta0
gamma0


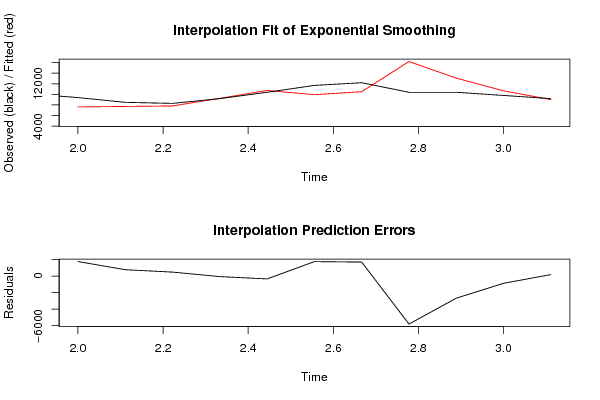
Interpolation Forecasts of Exponential Smoothing
tObservedFittedResiduals
1094007639.467648771471760.53235122853
1185007726.35511922791773.644880772087
1283007816.1761326082483.823867391799
1392009261.50745308265-61.5074530826514
141040010742.0828907365-342.082890736525
15117009948.261545333511751.73845466649
161220010504.55344509291695.44655490715
171040016201.8863778255-5801.88637782549
181040013071.1360135098-2671.13601350983
19980010673.2497512481-873.249751248137
2092009016.27864181186183.721358188137

\begin{tabular}{lllllllll}
\hline
Interpolation Forecasts of Exponential Smoothing \tabularnewline
t & Observed & Fitted & Residuals \tabularnewline
10 & 9400 & 7639.46764877147 & 1760.53235122853 \tabularnewline
11 & 8500 & 7726.35511922791 & 773.644880772087 \tabularnewline
12 & 8300 & 7816.1761326082 & 483.823867391799 \tabularnewline
13 & 9200 & 9261.50745308265 & -61.5074530826514 \tabularnewline
14 & 10400 & 10742.0828907365 & -342.082890736525 \tabularnewline
15 & 11700 & 9948.26154533351 & 1751.73845466649 \tabularnewline
16 & 12200 & 10504.5534450929 & 1695.44655490715 \tabularnewline
17 & 10400 & 16201.8863778255 & -5801.88637782549 \tabularnewline
18 & 10400 & 13071.1360135098 & -2671.13601350983 \tabularnewline
19 & 9800 & 10673.2497512481 & -873.249751248137 \tabularnewline
20 & 9200 & 9016.27864181186 & 183.721358188137 \tabularnewline
\hline
\end{tabular}
%Source: https://freestatistics.org/blog/index.php?pk=301568&T=2

[TABLE]
[ROW][C]Interpolation Forecasts of Exponential Smoothing[/C][/ROW]
[ROW][C]t[/C][C]Observed[/C][C]Fitted[/C][C]Residuals[/C][/ROW]
[ROW][C]10[/C][C]9400[/C][C]7639.46764877147[/C][C]1760.53235122853[/C][/ROW]
[ROW][C]11[/C][C]8500[/C][C]7726.35511922791[/C][C]773.644880772087[/C][/ROW]
[ROW][C]12[/C][C]8300[/C][C]7816.1761326082[/C][C]483.823867391799[/C][/ROW]
[ROW][C]13[/C][C]9200[/C][C]9261.50745308265[/C][C]-61.5074530826514[/C][/ROW]
[ROW][C]14[/C][C]10400[/C][C]10742.0828907365[/C][C]-342.082890736525[/C][/ROW]
[ROW][C]15[/C][C]11700[/C][C]9948.26154533351[/C][C]1751.73845466649[/C][/ROW]
[ROW][C]16[/C][C]12200[/C][C]10504.5534450929[/C][C]1695.44655490715[/C][/ROW]
[ROW][C]17[/C][C]10400[/C][C]16201.8863778255[/C][C]-5801.88637782549[/C][/ROW]
[ROW][C]18[/C][C]10400[/C][C]13071.1360135098[/C][C]-2671.13601350983[/C][/ROW]
[ROW][C]19[/C][C]9800[/C][C]10673.2497512481[/C][C]-873.249751248137[/C][/ROW]
[ROW][C]20[/C][C]9200[/C][C]9016.27864181186[/C][C]183.721358188137[/C][/ROW]
[/TABLE]
Source: https://freestatistics.org/blog/index.php?pk=301568&T=2

Globally Unique Identifier (entire table): ba.freestatistics.org/blog/index.php?pk=301568&T=2

As an alternative you can also use a QR Code:  

The GUIDs for individual cells are displayed in the table below:

Interpolation Forecasts of Exponential Smoothing
tObservedFittedResiduals
1094007639.467648771471760.53235122853
1185007726.35511922791773.644880772087
1283007816.1761326082483.823867391799
1392009261.50745308265-61.5074530826514
141040010742.0828907365-342.082890736525
15117009948.261545333511751.73845466649
161220010504.55344509291695.44655490715
171040016201.8863778255-5801.88637782549
181040013071.1360135098-2671.13601350983
19980010673.2497512481-873.249751248137
2092009016.27864181186183.721358188137


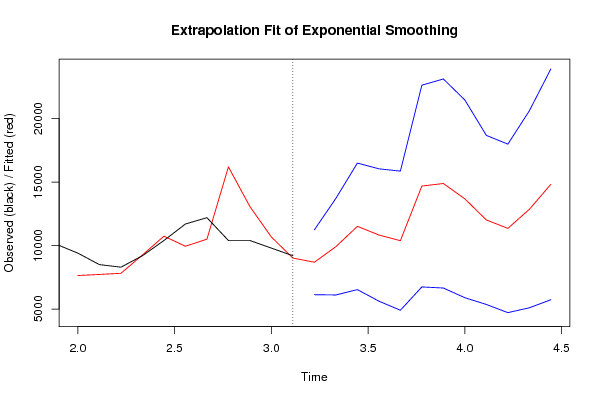
Extrapolation Forecasts of Exponential Smoothing
tForecast95% Lower Bound95% Upper Bound
218688.535023506216132.4291861029111244.6408609095
229914.978699414346108.3950186118313721.5623802169
2311516.95386308426531.3918799312716502.5158462372
2410835.32813172845620.5414508903816050.1148125664
2510386.11341952624905.0285354593715867.198303593
2614690.89812335456741.7668051151622640.0294415939
2714892.37881546066655.7203044778823129.0373264433
2813682.55663225045892.1109005565721473.0023639443
2912021.92599527895360.4078718586718683.4441186991
3011355.63428122014715.8011461616717995.4674162785
3112858.17150089025097.9392909186320618.4037108617
3214826.52380075765733.6097052713423919.4378962439

\begin{tabular}{lllllllll}
\hline
Extrapolation Forecasts of Exponential Smoothing \tabularnewline
t & Forecast & 95% Lower Bound & 95% Upper Bound \tabularnewline
21 & 8688.53502350621 & 6132.42918610291 & 11244.6408609095 \tabularnewline
22 & 9914.97869941434 & 6108.39501861183 & 13721.5623802169 \tabularnewline
23 & 11516.9538630842 & 6531.39187993127 & 16502.5158462372 \tabularnewline
24 & 10835.3281317284 & 5620.54145089038 & 16050.1148125664 \tabularnewline
25 & 10386.1134195262 & 4905.02853545937 & 15867.198303593 \tabularnewline
26 & 14690.8981233545 & 6741.76680511516 & 22640.0294415939 \tabularnewline
27 & 14892.3788154606 & 6655.72030447788 & 23129.0373264433 \tabularnewline
28 & 13682.5566322504 & 5892.11090055657 & 21473.0023639443 \tabularnewline
29 & 12021.9259952789 & 5360.40787185867 & 18683.4441186991 \tabularnewline
30 & 11355.6342812201 & 4715.80114616167 & 17995.4674162785 \tabularnewline
31 & 12858.1715008902 & 5097.93929091863 & 20618.4037108617 \tabularnewline
32 & 14826.5238007576 & 5733.60970527134 & 23919.4378962439 \tabularnewline
\hline
\end{tabular}
%Source: https://freestatistics.org/blog/index.php?pk=301568&T=3

[TABLE]
[ROW][C]Extrapolation Forecasts of Exponential Smoothing[/C][/ROW]
[ROW][C]t[/C][C]Forecast[/C][C]95% Lower Bound[/C][C]95% Upper Bound[/C][/ROW]
[ROW][C]21[/C][C]8688.53502350621[/C][C]6132.42918610291[/C][C]11244.6408609095[/C][/ROW]
[ROW][C]22[/C][C]9914.97869941434[/C][C]6108.39501861183[/C][C]13721.5623802169[/C][/ROW]
[ROW][C]23[/C][C]11516.9538630842[/C][C]6531.39187993127[/C][C]16502.5158462372[/C][/ROW]
[ROW][C]24[/C][C]10835.3281317284[/C][C]5620.54145089038[/C][C]16050.1148125664[/C][/ROW]
[ROW][C]25[/C][C]10386.1134195262[/C][C]4905.02853545937[/C][C]15867.198303593[/C][/ROW]
[ROW][C]26[/C][C]14690.8981233545[/C][C]6741.76680511516[/C][C]22640.0294415939[/C][/ROW]
[ROW][C]27[/C][C]14892.3788154606[/C][C]6655.72030447788[/C][C]23129.0373264433[/C][/ROW]
[ROW][C]28[/C][C]13682.5566322504[/C][C]5892.11090055657[/C][C]21473.0023639443[/C][/ROW]
[ROW][C]29[/C][C]12021.9259952789[/C][C]5360.40787185867[/C][C]18683.4441186991[/C][/ROW]
[ROW][C]30[/C][C]11355.6342812201[/C][C]4715.80114616167[/C][C]17995.4674162785[/C][/ROW]
[ROW][C]31[/C][C]12858.1715008902[/C][C]5097.93929091863[/C][C]20618.4037108617[/C][/ROW]
[ROW][C]32[/C][C]14826.5238007576[/C][C]5733.60970527134[/C][C]23919.4378962439[/C][/ROW]
[/TABLE]
Source: https://freestatistics.org/blog/index.php?pk=301568&T=3

Globally Unique Identifier (entire table): ba.freestatistics.org/blog/index.php?pk=301568&T=3

As an alternative you can also use a QR Code:  

The GUIDs for individual cells are displayed in the table below:

Extrapolation Forecasts of Exponential Smoothing
tForecast95% Lower Bound95% Upper Bound
218688.535023506216132.4291861029111244.6408609095
229914.978699414346108.3950186118313721.5623802169
2311516.95386308426531.3918799312716502.5158462372
2410835.32813172845620.5414508903816050.1148125664
2510386.11341952624905.0285354593715867.198303593
2614690.89812335456741.7668051151622640.0294415939
2714892.37881546066655.7203044778823129.0373264433
2813682.55663225045892.1109005565721473.0023639443
2912021.92599527895360.4078718586718683.4441186991
3011355.63428122014715.8011461616717995.4674162785
3112858.17150089025097.9392909186320618.4037108617
3214826.52380075765733.6097052713423919.4378962439


Parameters (Session):
par1 = 60 ; par2 = 1 ; par3 = 1 ; par4 = 1 ; par5 = 12 ; par6 = White Noise ; par7 = 0.95 ;
Parameters (R input):
par1 = 9 ; par2 = Triple ; par3 = multiplicative ; par4 = 12 ;
R code (references can be found in the software module):
par4 <- '12'
par3 <- 'multiplicative'
par2 <- 'Triple'
par1 <- '12'
par1 <- as.numeric(par1)
par4 <- as.numeric(par4)
if (par2 == 'Single') K <- 1
if (par2 == 'Double') K <- 2
if (par2 == 'Triple') K <- par1
nx <- length(x)
nxmK <- nx - K
x <- ts(x, frequency = par1)
if (par2 == 'Single') fit <- HoltWinters(x, gamma=F, beta=F)
if (par2 == 'Double') fit <- HoltWinters(x, gamma=F)
if (par2 == 'Triple') fit <- HoltWinters(x, seasonal=par3)
fit
myresid <- x - fit$fitted[,'xhat']
bitmap(file='test1.png')
op <- par(mfrow=c(2,1))
plot(fit,ylab='Observed (black) / Fitted (red)',main='Interpolation Fit of Exponential Smoothing')
plot(myresid,ylab='Residuals',main='Interpolation Prediction Errors')
par(op)
dev.off()
bitmap(file='test2.png')
p <- predict(fit, par4, prediction.interval=TRUE)
np <- length(p[,1])
plot(fit,p,ylab='Observed (black) / Fitted (red)',main='Extrapolation Fit of Exponential Smoothing')
dev.off()
bitmap(file='test3.png')
op <- par(mfrow = c(2,2))
acf(as.numeric(myresid),lag.max = nx/2,main='Residual ACF')
spectrum(myresid,main='Residals Periodogram')
cpgram(myresid,main='Residal Cumulative Periodogram')
qqnorm(myresid,main='Residual Normal QQ Plot')
qqline(myresid)
par(op)
dev.off()
load(file='createtable')
a<-table.start()
a<-table.row.start(a)
a<-table.element(a,'Estimated Parameters of Exponential Smoothing',2,TRUE)
a<-table.row.end(a)
a<-table.row.start(a)
a<-table.element(a,'Parameter',header=TRUE)
a<-table.element(a,'Value',header=TRUE)
a<-table.row.end(a)
a<-table.row.start(a)
a<-table.element(a,'alpha',header=TRUE)
a<-table.element(a,fit$alpha)
a<-table.row.end(a)
a<-table.row.start(a)
a<-table.element(a,'beta',header=TRUE)
a<-table.element(a,fit$beta)
a<-table.row.end(a)
a<-table.row.start(a)
a<-table.element(a,'gamma',header=TRUE)
a<-table.element(a,fit$gamma)
a<-table.row.end(a)
a<-table.end(a)
table.save(a,file='mytable.tab')
a<-table.start()
a<-table.row.start(a)
a<-table.element(a,'Interpolation Forecasts of Exponential Smoothing',4,TRUE)
a<-table.row.end(a)
a<-table.row.start(a)
a<-table.element(a,'t',header=TRUE)
a<-table.element(a,'Observed',header=TRUE)
a<-table.element(a,'Fitted',header=TRUE)
a<-table.element(a,'Residuals',header=TRUE)
a<-table.row.end(a)
for (i in 1:nxmK) {
a<-table.row.start(a)
a<-table.element(a,i+K,header=TRUE)
a<-table.element(a,x[i+K])
a<-table.element(a,fit$fitted[i,'xhat'])
a<-table.element(a,myresid[i])
a<-table.row.end(a)
}
a<-table.end(a)
table.save(a,file='mytable1.tab')
a<-table.start()
a<-table.row.start(a)
a<-table.element(a,'Extrapolation Forecasts of Exponential Smoothing',4,TRUE)
a<-table.row.end(a)
a<-table.row.start(a)
a<-table.element(a,'t',header=TRUE)
a<-table.element(a,'Forecast',header=TRUE)
a<-table.element(a,'95% Lower Bound',header=TRUE)
a<-table.element(a,'95% Upper Bound',header=TRUE)
a<-table.row.end(a)
for (i in 1:np) {
a<-table.row.start(a)
a<-table.element(a,nx+i,header=TRUE)
a<-table.element(a,p[i,'fit'])
a<-table.element(a,p[i,'lwr'])
a<-table.element(a,p[i,'upr'])
a<-table.row.end(a)
}
a<-table.end(a)
table.save(a,file='mytable2.tab')