Free Statistics

of Irreproducible Research!

Author's title

Author*The author of this computation has been verified*
R Software Modulerwasp_univariatedataseries.wasp
Title produced by softwareUnivariate Data Series
Date of computationMon, 19 Dec 2016 22:27:58 +0100
Cite this page as followsStatistical Computations at FreeStatistics.org, Office for Research Development and Education, URL https://freestatistics.org/blog/index.php?v=date/2016/Dec/19/t1482183370bq9pgo8oiwzbu51.htm/, Retrieved Fri, 01 Nov 2024 03:30:46 +0000
Statistical Computations at FreeStatistics.org, Office for Research Development and Education, URL https://freestatistics.org/blog/index.php?pk=301531, Retrieved Fri, 01 Nov 2024 03:30:46 +0000
QR Codes:

Original text written by user:
IsPrivate?No (this computation is public)
User-defined keywords
Estimated Impact110
Family? (F = Feedback message, R = changed R code, M = changed R Module, P = changed Parameters, D = changed Data)
-       [Univariate Data Series] [Plot Forecast N20...] [2016-12-19 21:27:58] [070714f07871aeb0c40d04255feda5cb] [Current]
Feedback Forum

Post a new message
Dataseries X:
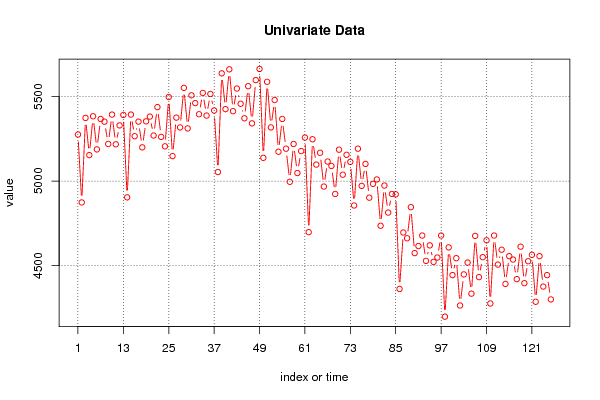
5276
4874
5374
5154
5384
5188
5368
5352
5220
5394
5218
5330
5392
4904
5394
5266
5352
5200
5354
5382
5270
5438
5262
5206
5498
5148
5376
5318
5552
5312
5508
5462
5396
5522
5388
5516
5418
5054
5638
5426
5662
5414
5548
5458
5372
5562
5342
5598
5664
5138
5588
5318
5480
5174
5368
5192
4996
5220
5048
5178
5258
4698
5248
5098
5168
4968
5116
5090
4924
5186
5038
5156
5114
4856
5192
4972
5102
4902
4984
5010
4736
4974
4814
4924
4922
4362
4696
4662
4846
4574
4616
4678
4528
4620
4522
4548
4678
4198
4608
4444
4544
4264
4448
4518
4334
4676
4432
4550
4650
4276
4678
4506
4594
4392
4556
4536
4420
4612
4396
4526
4564
4286
4556
4376
4444
4300


Summary of computational transaction
Raw Input view raw input (R code)
Raw Outputview raw output of R engine
Computing time1 seconds
R ServerBig Analytics Cloud Computing Center

\begin{tabular}{lllllllll}
\hline
Summary of computational transaction \tabularnewline
Raw Input view raw input (R code)  \tabularnewline
Raw Outputview raw output of R engine  \tabularnewline
Computing time1 seconds \tabularnewline
R ServerBig Analytics Cloud Computing Center \tabularnewline
\hline
\end{tabular}
%Source: https://freestatistics.org/blog/index.php?pk=301531&T=0

[TABLE]
[ROW]
Summary of computational transaction[/C][/ROW] [ROW]Raw Input[/C] view raw input (R code) [/C][/ROW] [ROW]Raw Output[/C]view raw output of R engine [/C][/ROW] [ROW]Computing time[/C]1 seconds[/C][/ROW] [ROW]R Server[/C]Big Analytics Cloud Computing Center[/C][/ROW] [/TABLE] Source: https://freestatistics.org/blog/index.php?pk=301531&T=0

Globally Unique Identifier (entire table): ba.freestatistics.org/blog/index.php?pk=301531&T=0

As an alternative you can also use a QR Code:  

The GUIDs for individual cells are displayed in the table below:

Summary of computational transaction
Raw Input view raw input (R code)
Raw Outputview raw output of R engine
Computing time1 seconds
R ServerBig Analytics Cloud Computing Center


Univariate Dataseries
Name of dataseries
Source
Description
Number of observations126

\begin{tabular}{lllllllll}
\hline
Univariate Dataseries \tabularnewline
Name of dataseries &  \tabularnewline
Source &  \tabularnewline
Description &  \tabularnewline
Number of observations & 126 \tabularnewline
\hline
\end{tabular}
%Source: https://freestatistics.org/blog/index.php?pk=301531&T=1

[TABLE]
[ROW][C]Univariate Dataseries[/C][/ROW]
[ROW][C]Name of dataseries[/C][C][/C][/ROW]
[ROW][C]Source[/C][C][/C][/ROW]
[ROW][C]Description[/C][C][/C][/ROW]
[ROW][C]Number of observations[/C][C]126[/C][/ROW]
[/TABLE]
Source: https://freestatistics.org/blog/index.php?pk=301531&T=1

Globally Unique Identifier (entire table): ba.freestatistics.org/blog/index.php?pk=301531&T=1

As an alternative you can also use a QR Code:  

The GUIDs for individual cells are displayed in the table below:

Univariate Dataseries
Name of dataseries
Source
Description
Number of observations126


Summary Statistics of dataseries x
> summary(x)
   Min. 1st Qu.  Median    Mean 3rd Qu.    Max. 
   4198    4617    5108    5007    5354    5664 

\begin{tabular}{lllllllll}
\hline
Summary Statistics of dataseries x \tabularnewline
> summary(x)
   Min. 1st Qu.  Median    Mean 3rd Qu.    Max. 
   4198    4617    5108    5007    5354    5664 
\tabularnewline \hline \end{tabular} %Source: https://freestatistics.org/blog/index.php?pk=301531&T=2

[TABLE]
[ROW][C]Summary Statistics of dataseries x[/C][/ROW]
[ROW][C]
> summary(x)
   Min. 1st Qu.  Median    Mean 3rd Qu.    Max. 
   4198    4617    5108    5007    5354    5664 
[/C][/ROW] [/TABLE] Source: https://freestatistics.org/blog/index.php?pk=301531&T=2

Globally Unique Identifier (entire table): ba.freestatistics.org/blog/index.php?pk=301531&T=2

As an alternative you can also use a QR Code:  

The GUIDs for individual cells are displayed in the table below:

Summary Statistics of dataseries x
> summary(x)
   Min. 1st Qu.  Median    Mean 3rd Qu.    Max. 
   4198    4617    5108    5007    5354    5664 


Parameters (Session):
par4 = 12 ;
Parameters (R input):
par1 = ; par2 = ; par3 = ; par4 = 12 ;
R code (references can be found in the software module):
if (par4 != 'No season') {
par4 <- as.numeric(par4)
if (par4 < 4) par4 <- 12
}
summary(x)
n <- length(x)
bitmap(file='test1.png')
if (par4=='No season') {
plot(x,col=2,type='b',main=main,xlab=xlab,ylab=ylab,xaxt='n')
axis(1,at=seq(1,n,10))
}
if (par4!='No season') {
plot(x,col=2,type='b',main=main,xlab=xlab,ylab=ylab,xaxt='n')
axis(1,at=seq(1,n,par4))
grid(nx=0,ny=NULL,col='black')
abline(v=seq(1,n,par4),col='black',lty='dotted')
}
dev.off()
load(file='createtable')
a<-table.start()
a<-table.row.start(a)
a<-table.element(a,'Univariate Dataseries',2,TRUE)
a<-table.row.end(a)
a<-table.row.start(a)
a<-table.element(a,'Name of dataseries',header=TRUE)
a<-table.element(a,par1)
a<-table.row.end(a)
a<-table.row.start(a)
a<-table.element(a,'Source',header=TRUE)
a<-table.element(a,par2)
a<-table.row.end(a)
a<-table.row.start(a)
a<-table.element(a,'Description',header=TRUE)
a<-table.element(a,par3)
a<-table.row.end(a)
a<-table.row.start(a)
a<-table.element(a,'Number of observations',header=TRUE)
a<-table.element(a,length(x))
a<-table.row.end(a)
a<-table.end(a)
table.save(a,file='mytable.tab')
a<-table.start()
a<-table.row.start(a)
a<-table.element(a,'Summary Statistics of dataseries x',1,TRUE)
a<-table.row.end(a)
a<-table.row.start(a)
a<-table.element(a,paste('
',RC.texteval('summary(x)'),'
',sep=''))
a<-table.row.end(a)
a<-table.end(a)
table.save(a,file='mytable1.tab')