Free Statistics

of Irreproducible Research!

Author's title

Author*The author of this computation has been verified*
R Software Modulerwasp_arimaforecasting.wasp
Title produced by softwareARIMA Forecasting
Date of computationMon, 19 Dec 2016 17:35:55 +0100
Cite this page as followsStatistical Computations at FreeStatistics.org, Office for Research Development and Education, URL https://freestatistics.org/blog/index.php?v=date/2016/Dec/19/t1482165519n65k6cbbe9ipofc.htm/, Retrieved Fri, 01 Nov 2024 03:36:44 +0000
Statistical Computations at FreeStatistics.org, Office for Research Development and Education, URL https://freestatistics.org/blog/index.php?pk=301414, Retrieved Fri, 01 Nov 2024 03:36:44 +0000
QR Codes:

Original text written by user:
IsPrivate?No (this computation is public)
User-defined keywords
Estimated Impact105
Family? (F = Feedback message, R = changed R code, M = changed R Module, P = changed Parameters, D = changed Data)
-     [Univariate Explorative Data Analysis] [Monthly US soldie...] [2010-11-02 12:07:39] [b98453cac15ba1066b407e146608df68]
- RMP   [Variance Reduction Matrix] [Soldiers] [2010-11-29 09:51:25] [b98453cac15ba1066b407e146608df68]
- RM      [Standard Deviation-Mean Plot] [Soldiers] [2010-11-29 11:02:42] [b98453cac15ba1066b407e146608df68]
- RMP       [ARIMA Backward Selection] [Soldiers] [2010-11-29 17:56:11] [b98453cac15ba1066b407e146608df68]
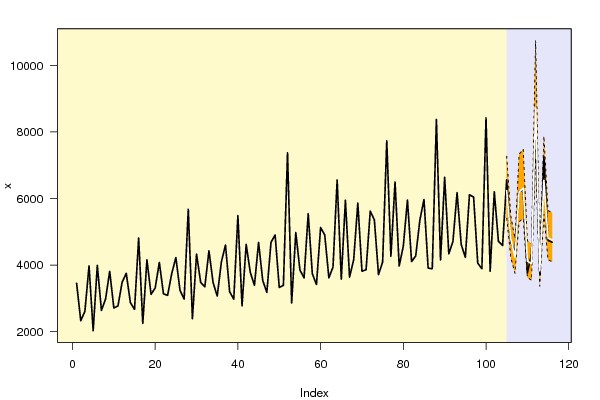
- RMPD          [ARIMA Forecasting] [forecast: N2572] [2016-12-19 16:35:55] [b7216e4bc5ee29192acbe9c506cee18c] [Current]
Feedback Forum

Post a new message
Dataseries X:
3450.3
2328.96
2610.24
3974.04
2025.3
3991.02
2636.88
2980.98
3813.36
2709.42
2772
3482.64
3752.64
2873.16
2667.84
4810.8
2247.54
4156.92
3121.02
3312.54
4081.14
3135.06
3089.64
3744.24
4227.24
3241.26
2976.36
5675.58
2387.64
4329.06
3478.2
3346.56
4428.48
3473.16
3069.78
4091.58
4602.6
3202.2
2973.42
5486.28
2774.76
4621.44
3778.44
3391.38
4680.78
3540.72
3178.02
4682.1
4906.26
3327.78
3390.9
7373.82
2861.46
4976.7
3853.38
3612.78
5544.6
3737.7
3414.9
5128.14
4904.4
3616.74
3939.84
6555.96
3578.1
5948.4
3637.86
4163.4
5864.52
3814.92
3859.2
5619.3
5358.36
3713.82
4092.3
7733.52
4261.5
6494.94
3971.46
4568.16
5953.98
4105.56
4272.78
5347.8
5971.44
3908.46
3888.3
8376.24
4151.16
6636.06
4339.74
4707.72
6176.34
4619.16
4230.42
6114
6042.78
4059.42
3888.3
8422.8
3813.6
6203.34
4715.58
4585.56
6561
4683.9
4385.7
6218.16
6241.86
3764.82
4327.62
8301.06
3731.04
7252.68
4743
4686.06


Summary of computational transaction
Raw Input view raw input (R code)
Raw Outputview raw output of R engine
Computing time2 seconds
R ServerBig Analytics Cloud Computing Center

\begin{tabular}{lllllllll}
\hline
Summary of computational transaction \tabularnewline
Raw Input view raw input (R code)  \tabularnewline
Raw Outputview raw output of R engine  \tabularnewline
Computing time2 seconds \tabularnewline
R ServerBig Analytics Cloud Computing Center \tabularnewline
\hline
\end{tabular}
%Source: https://freestatistics.org/blog/index.php?pk=301414&T=0

[TABLE]
[ROW]
Summary of computational transaction[/C][/ROW] [ROW]Raw Input[/C] view raw input (R code) [/C][/ROW] [ROW]Raw Output[/C]view raw output of R engine [/C][/ROW] [ROW]Computing time[/C]2 seconds[/C][/ROW] [ROW]R Server[/C]Big Analytics Cloud Computing Center[/C][/ROW] [/TABLE] Source: https://freestatistics.org/blog/index.php?pk=301414&T=0

Globally Unique Identifier (entire table): ba.freestatistics.org/blog/index.php?pk=301414&T=0

As an alternative you can also use a QR Code:  

The GUIDs for individual cells are displayed in the table below:

Summary of computational transaction
Raw Input view raw input (R code)
Raw Outputview raw output of R engine
Computing time2 seconds
R ServerBig Analytics Cloud Computing Center


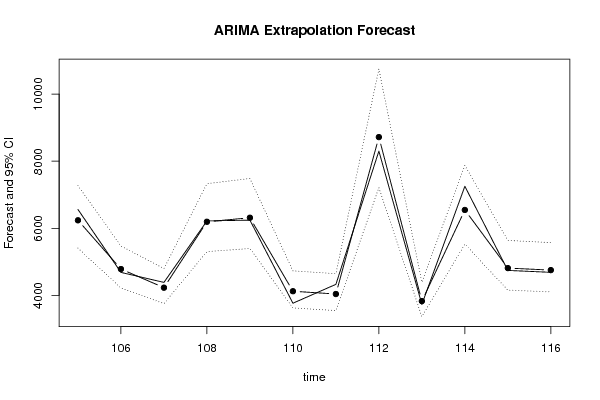
Univariate ARIMA Extrapolation Forecast
timeY[t]F[t]95% LB95% UBp-value(H0: Y[t] = F[t])P(F[t]>Y[t-1])P(F[t]>Y[t-s])P(F[t]>Y[104])
924707.72-------
936176.34-------
944619.16-------
954230.42-------
966114-------
976042.78-------
984059.42-------
993888.3-------
1008422.8-------
1013813.6-------
1026203.34-------
1034715.58-------
1044585.56-------
10565616237.28425407.88137273.2240.27010.99910.54590.9991
1064683.94783.78544218.32795471.05610.387900.68060.7141
1074385.74228.76563753.79534799.93530.29510.05920.49770.1104
1086218.166193.95435302.7717330.23540.48330.99910.55480.9972
1096241.866313.80295398.10697483.91010.4520.56360.67510.9981
1103764.824122.44223624.43934730.60650.124500.58050.0678
1114327.624039.52283545.27724644.81480.17540.81310.68780.0385
1128301.068718.36857212.42310750.36720.343610.61221
1133731.043827.29393364.45414392.64960.369300.51890.0043
1147252.686545.70285527.79447873.02340.148310.69340.9981
11547434812.50674155.7915638.140.434500.5910.705
1164686.064752.6174102.17955570.97140.43670.50920.65550.6555

\begin{tabular}{lllllllll}
\hline
Univariate ARIMA Extrapolation Forecast \tabularnewline
time & Y[t] & F[t] & 95% LB & 95% UB & p-value(H0: Y[t] = F[t]) & P(F[t]>Y[t-1]) & P(F[t]>Y[t-s]) & P(F[t]>Y[104]) \tabularnewline
92 & 4707.72 & - & - & - & - & - & - & - \tabularnewline
93 & 6176.34 & - & - & - & - & - & - & - \tabularnewline
94 & 4619.16 & - & - & - & - & - & - & - \tabularnewline
95 & 4230.42 & - & - & - & - & - & - & - \tabularnewline
96 & 6114 & - & - & - & - & - & - & - \tabularnewline
97 & 6042.78 & - & - & - & - & - & - & - \tabularnewline
98 & 4059.42 & - & - & - & - & - & - & - \tabularnewline
99 & 3888.3 & - & - & - & - & - & - & - \tabularnewline
100 & 8422.8 & - & - & - & - & - & - & - \tabularnewline
101 & 3813.6 & - & - & - & - & - & - & - \tabularnewline
102 & 6203.34 & - & - & - & - & - & - & - \tabularnewline
103 & 4715.58 & - & - & - & - & - & - & - \tabularnewline
104 & 4585.56 & - & - & - & - & - & - & - \tabularnewline
105 & 6561 & 6237.2842 & 5407.8813 & 7273.224 & 0.2701 & 0.9991 & 0.5459 & 0.9991 \tabularnewline
106 & 4683.9 & 4783.7854 & 4218.3279 & 5471.0561 & 0.3879 & 0 & 0.6806 & 0.7141 \tabularnewline
107 & 4385.7 & 4228.7656 & 3753.7953 & 4799.9353 & 0.2951 & 0.0592 & 0.4977 & 0.1104 \tabularnewline
108 & 6218.16 & 6193.9543 & 5302.771 & 7330.2354 & 0.4833 & 0.9991 & 0.5548 & 0.9972 \tabularnewline
109 & 6241.86 & 6313.8029 & 5398.1069 & 7483.9101 & 0.452 & 0.5636 & 0.6751 & 0.9981 \tabularnewline
110 & 3764.82 & 4122.4422 & 3624.4393 & 4730.6065 & 0.1245 & 0 & 0.5805 & 0.0678 \tabularnewline
111 & 4327.62 & 4039.5228 & 3545.2772 & 4644.8148 & 0.1754 & 0.8131 & 0.6878 & 0.0385 \tabularnewline
112 & 8301.06 & 8718.3685 & 7212.423 & 10750.3672 & 0.3436 & 1 & 0.6122 & 1 \tabularnewline
113 & 3731.04 & 3827.2939 & 3364.4541 & 4392.6496 & 0.3693 & 0 & 0.5189 & 0.0043 \tabularnewline
114 & 7252.68 & 6545.7028 & 5527.7944 & 7873.0234 & 0.1483 & 1 & 0.6934 & 0.9981 \tabularnewline
115 & 4743 & 4812.5067 & 4155.791 & 5638.14 & 0.4345 & 0 & 0.591 & 0.705 \tabularnewline
116 & 4686.06 & 4752.617 & 4102.1795 & 5570.9714 & 0.4367 & 0.5092 & 0.6555 & 0.6555 \tabularnewline
\hline
\end{tabular}
%Source: https://freestatistics.org/blog/index.php?pk=301414&T=1

[TABLE]
[ROW][C]Univariate ARIMA Extrapolation Forecast[/C][/ROW]
[ROW][C]time[/C][C]Y[t][/C][C]F[t][/C][C]95% LB[/C][C]95% UB[/C][C]p-value(H0: Y[t] = F[t])[/C][C]P(F[t]>Y[t-1])[/C][C]P(F[t]>Y[t-s])[/C][C]P(F[t]>Y[104])[/C][/ROW]
[ROW][C]92[/C][C]4707.72[/C][C]-[/C][C]-[/C][C]-[/C][C]-[/C][C]-[/C][C]-[/C][C]-[/C][/ROW]
[ROW][C]93[/C][C]6176.34[/C][C]-[/C][C]-[/C][C]-[/C][C]-[/C][C]-[/C][C]-[/C][C]-[/C][/ROW]
[ROW][C]94[/C][C]4619.16[/C][C]-[/C][C]-[/C][C]-[/C][C]-[/C][C]-[/C][C]-[/C][C]-[/C][/ROW]
[ROW][C]95[/C][C]4230.42[/C][C]-[/C][C]-[/C][C]-[/C][C]-[/C][C]-[/C][C]-[/C][C]-[/C][/ROW]
[ROW][C]96[/C][C]6114[/C][C]-[/C][C]-[/C][C]-[/C][C]-[/C][C]-[/C][C]-[/C][C]-[/C][/ROW]
[ROW][C]97[/C][C]6042.78[/C][C]-[/C][C]-[/C][C]-[/C][C]-[/C][C]-[/C][C]-[/C][C]-[/C][/ROW]
[ROW][C]98[/C][C]4059.42[/C][C]-[/C][C]-[/C][C]-[/C][C]-[/C][C]-[/C][C]-[/C][C]-[/C][/ROW]
[ROW][C]99[/C][C]3888.3[/C][C]-[/C][C]-[/C][C]-[/C][C]-[/C][C]-[/C][C]-[/C][C]-[/C][/ROW]
[ROW][C]100[/C][C]8422.8[/C][C]-[/C][C]-[/C][C]-[/C][C]-[/C][C]-[/C][C]-[/C][C]-[/C][/ROW]
[ROW][C]101[/C][C]3813.6[/C][C]-[/C][C]-[/C][C]-[/C][C]-[/C][C]-[/C][C]-[/C][C]-[/C][/ROW]
[ROW][C]102[/C][C]6203.34[/C][C]-[/C][C]-[/C][C]-[/C][C]-[/C][C]-[/C][C]-[/C][C]-[/C][/ROW]
[ROW][C]103[/C][C]4715.58[/C][C]-[/C][C]-[/C][C]-[/C][C]-[/C][C]-[/C][C]-[/C][C]-[/C][/ROW]
[ROW][C]104[/C][C]4585.56[/C][C]-[/C][C]-[/C][C]-[/C][C]-[/C][C]-[/C][C]-[/C][C]-[/C][/ROW]
[ROW][C]105[/C][C]6561[/C][C]6237.2842[/C][C]5407.8813[/C][C]7273.224[/C][C]0.2701[/C][C]0.9991[/C][C]0.5459[/C][C]0.9991[/C][/ROW]
[ROW][C]106[/C][C]4683.9[/C][C]4783.7854[/C][C]4218.3279[/C][C]5471.0561[/C][C]0.3879[/C][C]0[/C][C]0.6806[/C][C]0.7141[/C][/ROW]
[ROW][C]107[/C][C]4385.7[/C][C]4228.7656[/C][C]3753.7953[/C][C]4799.9353[/C][C]0.2951[/C][C]0.0592[/C][C]0.4977[/C][C]0.1104[/C][/ROW]
[ROW][C]108[/C][C]6218.16[/C][C]6193.9543[/C][C]5302.771[/C][C]7330.2354[/C][C]0.4833[/C][C]0.9991[/C][C]0.5548[/C][C]0.9972[/C][/ROW]
[ROW][C]109[/C][C]6241.86[/C][C]6313.8029[/C][C]5398.1069[/C][C]7483.9101[/C][C]0.452[/C][C]0.5636[/C][C]0.6751[/C][C]0.9981[/C][/ROW]
[ROW][C]110[/C][C]3764.82[/C][C]4122.4422[/C][C]3624.4393[/C][C]4730.6065[/C][C]0.1245[/C][C]0[/C][C]0.5805[/C][C]0.0678[/C][/ROW]
[ROW][C]111[/C][C]4327.62[/C][C]4039.5228[/C][C]3545.2772[/C][C]4644.8148[/C][C]0.1754[/C][C]0.8131[/C][C]0.6878[/C][C]0.0385[/C][/ROW]
[ROW][C]112[/C][C]8301.06[/C][C]8718.3685[/C][C]7212.423[/C][C]10750.3672[/C][C]0.3436[/C][C]1[/C][C]0.6122[/C][C]1[/C][/ROW]
[ROW][C]113[/C][C]3731.04[/C][C]3827.2939[/C][C]3364.4541[/C][C]4392.6496[/C][C]0.3693[/C][C]0[/C][C]0.5189[/C][C]0.0043[/C][/ROW]
[ROW][C]114[/C][C]7252.68[/C][C]6545.7028[/C][C]5527.7944[/C][C]7873.0234[/C][C]0.1483[/C][C]1[/C][C]0.6934[/C][C]0.9981[/C][/ROW]
[ROW][C]115[/C][C]4743[/C][C]4812.5067[/C][C]4155.791[/C][C]5638.14[/C][C]0.4345[/C][C]0[/C][C]0.591[/C][C]0.705[/C][/ROW]
[ROW][C]116[/C][C]4686.06[/C][C]4752.617[/C][C]4102.1795[/C][C]5570.9714[/C][C]0.4367[/C][C]0.5092[/C][C]0.6555[/C][C]0.6555[/C][/ROW]
[/TABLE]
Source: https://freestatistics.org/blog/index.php?pk=301414&T=1

Globally Unique Identifier (entire table): ba.freestatistics.org/blog/index.php?pk=301414&T=1

As an alternative you can also use a QR Code:  

The GUIDs for individual cells are displayed in the table below:

Univariate ARIMA Extrapolation Forecast
timeY[t]F[t]95% LB95% UBp-value(H0: Y[t] = F[t])P(F[t]>Y[t-1])P(F[t]>Y[t-s])P(F[t]>Y[104])
924707.72-------
936176.34-------
944619.16-------
954230.42-------
966114-------
976042.78-------
984059.42-------
993888.3-------
1008422.8-------
1013813.6-------
1026203.34-------
1034715.58-------
1044585.56-------
10565616237.28425407.88137273.2240.27010.99910.54590.9991
1064683.94783.78544218.32795471.05610.387900.68060.7141
1074385.74228.76563753.79534799.93530.29510.05920.49770.1104
1086218.166193.95435302.7717330.23540.48330.99910.55480.9972
1096241.866313.80295398.10697483.91010.4520.56360.67510.9981
1103764.824122.44223624.43934730.60650.124500.58050.0678
1114327.624039.52283545.27724644.81480.17540.81310.68780.0385
1128301.068718.36857212.42310750.36720.343610.61221
1133731.043827.29393364.45414392.64960.369300.51890.0043
1147252.686545.70285527.79447873.02340.148310.69340.9981
11547434812.50674155.7915638.140.434500.5910.705
1164686.064752.6174102.17955570.97140.43670.50920.65550.6555


Univariate ARIMA Extrapolation Forecast Performance
time% S.E.PEMAPEsMAPESq.EMSERMSEScaledEMASE
1050.08470.04930.04930.0506104791.9107000.16410.1641
1060.0733-0.02130.03530.03589977.090457384.5005239.5506-0.05060.1073
1070.06890.03580.03550.03624628.420146465.8071215.55930.07950.0981
1080.09360.00390.02760.028585.91634995.8343187.07170.01230.0766
1090.0946-0.01150.02440.02475175.776329031.8227170.3873-0.03650.0686
1100.0753-0.0950.03610.0357127893.659645508.7955213.3279-0.18130.0874
1110.07650.06660.04050.040482999.986150864.6799225.5320.1460.0957
1120.1189-0.05030.04170.0415174146.370866274.8913257.4391-0.21150.1102
1130.0754-0.02580.03990.03979264.806959940.4374244.8274-0.04880.1034
1140.10350.09750.04570.046499816.7226103928.066322.37880.35830.1289
1150.0875-0.01470.04290.04314831.18894919.2589308.0897-0.03520.1204
1160.0879-0.01420.04050.04074429.837387378.4737295.5985-0.03370.1132

\begin{tabular}{lllllllll}
\hline
Univariate ARIMA Extrapolation Forecast Performance \tabularnewline
time & % S.E. & PE & MAPE & sMAPE & Sq.E & MSE & RMSE & ScaledE & MASE \tabularnewline
105 & 0.0847 & 0.0493 & 0.0493 & 0.0506 & 104791.9107 & 0 & 0 & 0.1641 & 0.1641 \tabularnewline
106 & 0.0733 & -0.0213 & 0.0353 & 0.0358 & 9977.0904 & 57384.5005 & 239.5506 & -0.0506 & 0.1073 \tabularnewline
107 & 0.0689 & 0.0358 & 0.0355 & 0.036 & 24628.4201 & 46465.8071 & 215.5593 & 0.0795 & 0.0981 \tabularnewline
108 & 0.0936 & 0.0039 & 0.0276 & 0.028 & 585.916 & 34995.8343 & 187.0717 & 0.0123 & 0.0766 \tabularnewline
109 & 0.0946 & -0.0115 & 0.0244 & 0.0247 & 5175.7763 & 29031.8227 & 170.3873 & -0.0365 & 0.0686 \tabularnewline
110 & 0.0753 & -0.095 & 0.0361 & 0.0357 & 127893.6596 & 45508.7955 & 213.3279 & -0.1813 & 0.0874 \tabularnewline
111 & 0.0765 & 0.0666 & 0.0405 & 0.0404 & 82999.9861 & 50864.6799 & 225.532 & 0.146 & 0.0957 \tabularnewline
112 & 0.1189 & -0.0503 & 0.0417 & 0.0415 & 174146.3708 & 66274.8913 & 257.4391 & -0.2115 & 0.1102 \tabularnewline
113 & 0.0754 & -0.0258 & 0.0399 & 0.0397 & 9264.8069 & 59940.4374 & 244.8274 & -0.0488 & 0.1034 \tabularnewline
114 & 0.1035 & 0.0975 & 0.0457 & 0.046 & 499816.7226 & 103928.066 & 322.3788 & 0.3583 & 0.1289 \tabularnewline
115 & 0.0875 & -0.0147 & 0.0429 & 0.0431 & 4831.188 & 94919.2589 & 308.0897 & -0.0352 & 0.1204 \tabularnewline
116 & 0.0879 & -0.0142 & 0.0405 & 0.0407 & 4429.8373 & 87378.4737 & 295.5985 & -0.0337 & 0.1132 \tabularnewline
\hline
\end{tabular}
%Source: https://freestatistics.org/blog/index.php?pk=301414&T=2

[TABLE]
[ROW][C]Univariate ARIMA Extrapolation Forecast Performance[/C][/ROW]
[ROW][C]time[/C][C]% S.E.[/C][C]PE[/C][C]MAPE[/C][C]sMAPE[/C][C]Sq.E[/C][C]MSE[/C][C]RMSE[/C][C]ScaledE[/C][C]MASE[/C][/ROW]
[ROW][C]105[/C][C]0.0847[/C][C]0.0493[/C][C]0.0493[/C][C]0.0506[/C][C]104791.9107[/C][C]0[/C][C]0[/C][C]0.1641[/C][C]0.1641[/C][/ROW]
[ROW][C]106[/C][C]0.0733[/C][C]-0.0213[/C][C]0.0353[/C][C]0.0358[/C][C]9977.0904[/C][C]57384.5005[/C][C]239.5506[/C][C]-0.0506[/C][C]0.1073[/C][/ROW]
[ROW][C]107[/C][C]0.0689[/C][C]0.0358[/C][C]0.0355[/C][C]0.036[/C][C]24628.4201[/C][C]46465.8071[/C][C]215.5593[/C][C]0.0795[/C][C]0.0981[/C][/ROW]
[ROW][C]108[/C][C]0.0936[/C][C]0.0039[/C][C]0.0276[/C][C]0.028[/C][C]585.916[/C][C]34995.8343[/C][C]187.0717[/C][C]0.0123[/C][C]0.0766[/C][/ROW]
[ROW][C]109[/C][C]0.0946[/C][C]-0.0115[/C][C]0.0244[/C][C]0.0247[/C][C]5175.7763[/C][C]29031.8227[/C][C]170.3873[/C][C]-0.0365[/C][C]0.0686[/C][/ROW]
[ROW][C]110[/C][C]0.0753[/C][C]-0.095[/C][C]0.0361[/C][C]0.0357[/C][C]127893.6596[/C][C]45508.7955[/C][C]213.3279[/C][C]-0.1813[/C][C]0.0874[/C][/ROW]
[ROW][C]111[/C][C]0.0765[/C][C]0.0666[/C][C]0.0405[/C][C]0.0404[/C][C]82999.9861[/C][C]50864.6799[/C][C]225.532[/C][C]0.146[/C][C]0.0957[/C][/ROW]
[ROW][C]112[/C][C]0.1189[/C][C]-0.0503[/C][C]0.0417[/C][C]0.0415[/C][C]174146.3708[/C][C]66274.8913[/C][C]257.4391[/C][C]-0.2115[/C][C]0.1102[/C][/ROW]
[ROW][C]113[/C][C]0.0754[/C][C]-0.0258[/C][C]0.0399[/C][C]0.0397[/C][C]9264.8069[/C][C]59940.4374[/C][C]244.8274[/C][C]-0.0488[/C][C]0.1034[/C][/ROW]
[ROW][C]114[/C][C]0.1035[/C][C]0.0975[/C][C]0.0457[/C][C]0.046[/C][C]499816.7226[/C][C]103928.066[/C][C]322.3788[/C][C]0.3583[/C][C]0.1289[/C][/ROW]
[ROW][C]115[/C][C]0.0875[/C][C]-0.0147[/C][C]0.0429[/C][C]0.0431[/C][C]4831.188[/C][C]94919.2589[/C][C]308.0897[/C][C]-0.0352[/C][C]0.1204[/C][/ROW]
[ROW][C]116[/C][C]0.0879[/C][C]-0.0142[/C][C]0.0405[/C][C]0.0407[/C][C]4429.8373[/C][C]87378.4737[/C][C]295.5985[/C][C]-0.0337[/C][C]0.1132[/C][/ROW]
[/TABLE]
Source: https://freestatistics.org/blog/index.php?pk=301414&T=2

Globally Unique Identifier (entire table): ba.freestatistics.org/blog/index.php?pk=301414&T=2

As an alternative you can also use a QR Code:  

The GUIDs for individual cells are displayed in the table below:

Univariate ARIMA Extrapolation Forecast Performance
time% S.E.PEMAPEsMAPESq.EMSERMSEScaledEMASE
1050.08470.04930.04930.0506104791.9107000.16410.1641
1060.0733-0.02130.03530.03589977.090457384.5005239.5506-0.05060.1073
1070.06890.03580.03550.03624628.420146465.8071215.55930.07950.0981
1080.09360.00390.02760.028585.91634995.8343187.07170.01230.0766
1090.0946-0.01150.02440.02475175.776329031.8227170.3873-0.03650.0686
1100.0753-0.0950.03610.0357127893.659645508.7955213.3279-0.18130.0874
1110.07650.06660.04050.040482999.986150864.6799225.5320.1460.0957
1120.1189-0.05030.04170.0415174146.370866274.8913257.4391-0.21150.1102
1130.0754-0.02580.03990.03979264.806959940.4374244.8274-0.04880.1034
1140.10350.09750.04570.046499816.7226103928.066322.37880.35830.1289
1150.0875-0.01470.04290.04314831.18894919.2589308.0897-0.03520.1204
1160.0879-0.01420.04050.04074429.837387378.4737295.5985-0.03370.1132


Parameters (Session):
par1 = 12 ; par2 = -0.5 ; par3 = 1 ; par4 = 1 ; par5 = 12 ; par6 = 3 ; par7 = 1 ; par8 = 1 ; par9 = 1 ; par10 = FALSE ;
Parameters (R input):
par1 = 12 ; par2 = -0.5 ; par3 = 1 ; par4 = 1 ; par5 = 12 ; par6 = 3 ; par7 = 1 ; par8 = 1 ; par9 = 1 ; par10 = FALSE ;
R code (references can be found in the software module):
par1 <- as.numeric(par1) #cut off periods
par2 <- as.numeric(par2) #lambda
par3 <- as.numeric(par3) #degree of non-seasonal differencing
par4 <- as.numeric(par4) #degree of seasonal differencing
par5 <- as.numeric(par5) #seasonal period
par6 <- as.numeric(par6) #p
par7 <- as.numeric(par7) #q
par8 <- as.numeric(par8) #P
par9 <- as.numeric(par9) #Q
if (par10 == 'TRUE') par10 <- TRUE
if (par10 == 'FALSE') par10 <- FALSE
if (par2 == 0) x <- log(x)
if (par2 != 0) x <- x^par2
lx <- length(x)
first <- lx - 2*par1
nx <- lx - par1
nx1 <- nx + 1
fx <- lx - nx
if (fx < 1) {
fx <- par5*2
nx1 <- lx + fx - 1
first <- lx - 2*fx
}
first <- 1
if (fx < 3) fx <- round(lx/10,0)
(arima.out <- arima(x[1:nx], order=c(par6,par3,par7), seasonal=list(order=c(par8,par4,par9), period=par5), include.mean=par10, method='ML'))
(forecast <- predict(arima.out,fx))
(lb <- forecast$pred - 1.96 * forecast$se)
(ub <- forecast$pred + 1.96 * forecast$se)
if (par2 == 0) {
x <- exp(x)
forecast$pred <- exp(forecast$pred)
lb <- exp(lb)
ub <- exp(ub)
}
if (par2 != 0) {
x <- x^(1/par2)
forecast$pred <- forecast$pred^(1/par2)
lb <- lb^(1/par2)
ub <- ub^(1/par2)
}
if (par2 < 0) {
olb <- lb
lb <- ub
ub <- olb
}
(actandfor <- c(x[1:nx], forecast$pred))
(perc.se <- (ub-forecast$pred)/1.96/forecast$pred)
bitmap(file='test1.png')
opar <- par(mar=c(4,4,2,2),las=1)
ylim <- c( min(x[first:nx],lb), max(x[first:nx],ub))
plot(x,ylim=ylim,type='n',xlim=c(first,lx))
usr <- par('usr')
rect(usr[1],usr[3],nx+1,usr[4],border=NA,col='lemonchiffon')
rect(nx1,usr[3],usr[2],usr[4],border=NA,col='lavender')
abline(h= (-3:3)*2 , col ='gray', lty =3)
polygon( c(nx1:lx,lx:nx1), c(lb,rev(ub)), col = 'orange', lty=2,border=NA)
lines(nx1:lx, lb , lty=2)
lines(nx1:lx, ub , lty=2)
lines(x, lwd=2)
lines(nx1:lx, forecast$pred , lwd=2 , col ='white')
box()
par(opar)
dev.off()
prob.dec <- array(NA, dim=fx)
prob.sdec <- array(NA, dim=fx)
prob.ldec <- array(NA, dim=fx)
prob.pval <- array(NA, dim=fx)
perf.pe <- array(0, dim=fx)
perf.spe <- array(0, dim=fx)
perf.scalederr <- array(0, dim=fx)
perf.mase <- array(0, dim=fx)
perf.mase1 <- array(0, dim=fx)
perf.mape <- array(0, dim=fx)
perf.smape <- array(0, dim=fx)
perf.mape1 <- array(0, dim=fx)
perf.smape1 <- array(0,dim=fx)
perf.se <- array(0, dim=fx)
perf.mse <- array(0, dim=fx)
perf.mse1 <- array(0, dim=fx)
perf.rmse <- array(0, dim=fx)
perf.scaleddenom <- 0
for (i in 2:fx) {
perf.scaleddenom = perf.scaleddenom + abs(x[nx+i] - x[nx+i-1])
}
perf.scaleddenom = perf.scaleddenom / (fx-1)
for (i in 1:fx) {
locSD <- (ub[i] - forecast$pred[i]) / 1.96
perf.scalederr[i] = (x[nx+i] - forecast$pred[i]) / perf.scaleddenom
perf.pe[i] = (x[nx+i] - forecast$pred[i]) / x[nx+i]
perf.spe[i] = 2*(x[nx+i] - forecast$pred[i]) / (x[nx+i] + forecast$pred[i])
perf.se[i] = (x[nx+i] - forecast$pred[i])^2
prob.dec[i] = pnorm((x[nx+i-1] - forecast$pred[i]) / locSD)
prob.sdec[i] = pnorm((x[nx+i-par5] - forecast$pred[i]) / locSD)
prob.ldec[i] = pnorm((x[nx] - forecast$pred[i]) / locSD)
prob.pval[i] = pnorm(abs(x[nx+i] - forecast$pred[i]) / locSD)
}
perf.mape[1] = abs(perf.pe[1])
perf.smape[1] = abs(perf.spe[1])
perf.mape1[1] = perf.mape[1]
perf.smape1[1] = perf.smape[1]
perf.mse[1] = perf.se[1]
perf.mase[1] = abs(perf.scalederr[1])
perf.mase1[1] = perf.mase[1]
for (i in 2:fx) {
perf.mape[i] = perf.mape[i-1] + abs(perf.pe[i])
perf.mape1[i] = perf.mape[i] / i
perf.smape[i] = perf.smape[i-1] + abs(perf.spe[i])
perf.smape1[i] = perf.smape[i] / i
perf.mse[i] = perf.mse[i-1] + perf.se[i]
perf.mse1[i] = perf.mse[i] / i
perf.mase[i] = perf.mase[i-1] + abs(perf.scalederr[i])
perf.mase1[i] = perf.mase[i] / i
}
perf.rmse = sqrt(perf.mse1)
bitmap(file='test2.png')
plot(forecast$pred, pch=19, type='b',main='ARIMA Extrapolation Forecast', ylab='Forecast and 95% CI', xlab='time',ylim=c(min(lb),max(ub)))
dum <- forecast$pred
dum[1:par1] <- x[(nx+1):lx]
lines(dum, lty=1)
lines(ub,lty=3)
lines(lb,lty=3)
dev.off()
load(file='createtable')
a<-table.start()
a<-table.row.start(a)
a<-table.element(a,'Univariate ARIMA Extrapolation Forecast',9,TRUE)
a<-table.row.end(a)
a<-table.row.start(a)
a<-table.element(a,'time',1,header=TRUE)
a<-table.element(a,'Y[t]',1,header=TRUE)
a<-table.element(a,'F[t]',1,header=TRUE)
a<-table.element(a,'95% LB',1,header=TRUE)
a<-table.element(a,'95% UB',1,header=TRUE)
a<-table.element(a,'p-value
(H0: Y[t] = F[t])',1,header=TRUE)
a<-table.element(a,'P(F[t]>Y[t-1])',1,header=TRUE)
a<-table.element(a,'P(F[t]>Y[t-s])',1,header=TRUE)
mylab <- paste('P(F[t]>Y[',nx,sep='')
mylab <- paste(mylab,'])',sep='')
a<-table.element(a,mylab,1,header=TRUE)
a<-table.row.end(a)
for (i in (nx-par5):nx) {
a<-table.row.start(a)
a<-table.element(a,i,header=TRUE)
a<-table.element(a,x[i])
a<-table.element(a,'-')
a<-table.row.end(a)
}
for (i in 1:fx) {
a<-table.row.start(a)
a<-table.element(a,nx+i,header=TRUE)
a<-table.element(a,round(x[nx+i],4))
a<-table.element(a,round(forecast$pred[i],4))
a<-table.element(a,round(lb[i],4))
a<-table.element(a,round(ub[i],4))
a<-table.element(a,round((1-prob.pval[i]),4))
a<-table.element(a,round((1-prob.dec[i]),4))
a<-table.element(a,round((1-prob.sdec[i]),4))
a<-table.element(a,round((1-prob.ldec[i]),4))
a<-table.row.end(a)
}
a<-table.end(a)
table.save(a,file='mytable.tab')
a<-table.start()
a<-table.row.start(a)
a<-table.element(a,'Univariate ARIMA Extrapolation Forecast Performance',10,TRUE)
a<-table.row.end(a)
a<-table.row.start(a)
a<-table.element(a,'time',1,header=TRUE)
a<-table.element(a,'% S.E.',1,header=TRUE)
a<-table.element(a,'PE',1,header=TRUE)
a<-table.element(a,'MAPE',1,header=TRUE)
a<-table.element(a,'sMAPE',1,header=TRUE)
a<-table.element(a,'Sq.E',1,header=TRUE)
a<-table.element(a,'MSE',1,header=TRUE)
a<-table.element(a,'RMSE',1,header=TRUE)
a<-table.element(a,'ScaledE',1,header=TRUE)
a<-table.element(a,'MASE',1,header=TRUE)
a<-table.row.end(a)
for (i in 1:fx) {
a<-table.row.start(a)
a<-table.element(a,nx+i,header=TRUE)
a<-table.element(a,round(perc.se[i],4))
a<-table.element(a,round(perf.pe[i],4))
a<-table.element(a,round(perf.mape1[i],4))
a<-table.element(a,round(perf.smape1[i],4))
a<-table.element(a,round(perf.se[i],4))
a<-table.element(a,round(perf.mse1[i],4))
a<-table.element(a,round(perf.rmse[i],4))
a<-table.element(a,round(perf.scalederr[i],4))
a<-table.element(a,round(perf.mase1[i],4))
a<-table.row.end(a)
}
a<-table.end(a)
table.save(a,file='mytable1.tab')