Free Statistics

of Irreproducible Research!

Author's title

Author*The author of this computation has been verified*
R Software Modulerwasp_autocorrelation.wasp
Title produced by software(Partial) Autocorrelation Function
Date of computationMon, 19 Dec 2016 16:26:32 +0100
Cite this page as followsStatistical Computations at FreeStatistics.org, Office for Research Development and Education, URL https://freestatistics.org/blog/index.php?v=date/2016/Dec/19/t148216121430l0ug0rufabh5h.htm/, Retrieved Fri, 01 Nov 2024 03:45:53 +0000
Statistical Computations at FreeStatistics.org, Office for Research Development and Education, URL https://freestatistics.org/blog/index.php?pk=301390, Retrieved Fri, 01 Nov 2024 03:45:53 +0000
QR Codes:

Original text written by user:
IsPrivate?No (this computation is public)
User-defined keywords
Estimated Impact108
Family? (F = Feedback message, R = changed R code, M = changed R Module, P = changed Parameters, D = changed Data)
-       [(Partial) Autocorrelation Function] [ACF ] [2016-12-19 15:26:32] [9fb47d69755d1f4b66b6f2591280f9e0] [Current]
Feedback Forum

Post a new message
Dataseries X:
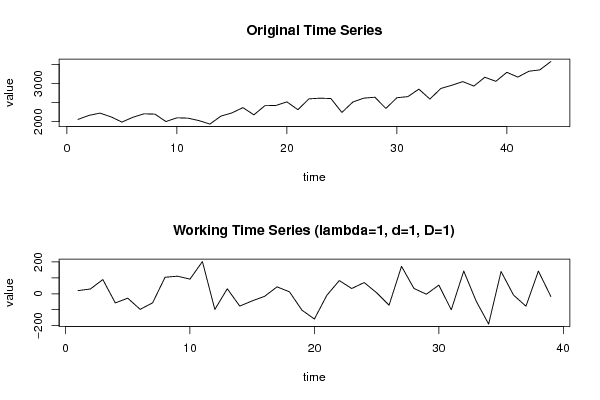
2058.44
2163.84
2223.38
2126.36
1989.96
2115.1
2204.74
2197.16
2003.2
2100.46
2091.98
2027.38
1937.32
2145.32
2228.88
2367.04
2178.48
2417.94
2424.08
2517.46
2313
2595.96
2614.1
2604.26
2240.9
2514.2
2615.36
2638.56
2345.84
2625.46
2654.58
2850.46
2591.16
2868.08
2951.72
3046.74
2930.46
3161.2
3054.26
3289.48
3165.14
3317.62
3353.74
3571.6


Summary of computational transaction
Raw Input view raw input (R code)
Raw Outputview raw output of R engine
Computing time2 seconds
R ServerBig Analytics Cloud Computing Center

\begin{tabular}{lllllllll}
\hline
Summary of computational transaction \tabularnewline
Raw Input view raw input (R code)  \tabularnewline
Raw Outputview raw output of R engine  \tabularnewline
Computing time2 seconds \tabularnewline
R ServerBig Analytics Cloud Computing Center \tabularnewline
\hline
\end{tabular}
%Source: https://freestatistics.org/blog/index.php?pk=301390&T=0

[TABLE]
[ROW]
Summary of computational transaction[/C][/ROW] [ROW]Raw Input[/C] view raw input (R code) [/C][/ROW] [ROW]Raw Output[/C]view raw output of R engine [/C][/ROW] [ROW]Computing time[/C]2 seconds[/C][/ROW] [ROW]R Server[/C]Big Analytics Cloud Computing Center[/C][/ROW] [/TABLE] Source: https://freestatistics.org/blog/index.php?pk=301390&T=0

Globally Unique Identifier (entire table): ba.freestatistics.org/blog/index.php?pk=301390&T=0

As an alternative you can also use a QR Code:  

The GUIDs for individual cells are displayed in the table below:

Summary of computational transaction
Raw Input view raw input (R code)
Raw Outputview raw output of R engine
Computing time2 seconds
R ServerBig Analytics Cloud Computing Center


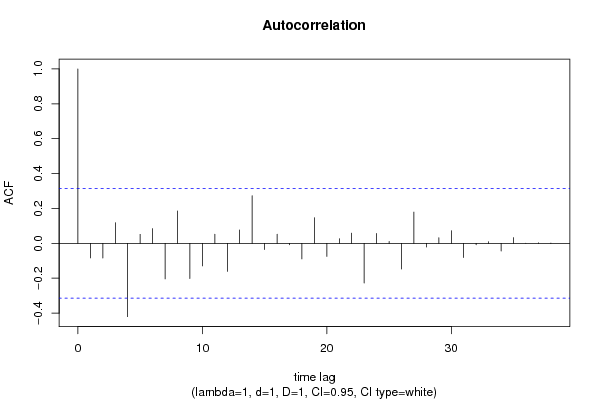
Autocorrelation Function
Time lag kACF(k)T-STATP-value
1-0.083504-0.52150.30249
2-0.084075-0.5250.301262
30.118310.73880.232212
4-0.420258-2.62450.006163
50.0516880.32280.374289
60.0843370.52670.300699
7-0.203719-1.27220.105413
80.1853951.15780.126995
9-0.201312-1.25720.10808
10-0.129363-0.80790.212032
110.0518170.32360.373985
12-0.16093-1.0050.160543
130.0764930.47770.317766
140.2730011.70490.048085
15-0.035448-0.22140.412978
160.0518510.32380.373907
17-0.008082-0.05050.480002
18-0.088984-0.55570.290793
190.1465390.91510.182873
20-0.074535-0.46550.322092
210.02620.16360.435439
220.0585280.36550.358354
23-0.227743-1.42230.081451
240.0570.3560.361893
250.0102530.0640.474636
26-0.147485-0.9210.181346
270.1791141.11860.135084
28-0.020715-0.12940.448868
290.0319050.19920.421553
300.0726350.45360.326313
31-0.080763-0.50440.308421
32-0.00786-0.04910.48055
330.0091670.05720.47732
34-0.043425-0.27120.393839
350.0328020.20480.419379
36-0.00071-0.00440.498243
370.0027610.01720.493165
38-0.000884-0.00550.497812
39NANANA
40NANANA
41NANANA
42NANANA
43NANANA
44NANANA
45NANANA
46NANANA
47NANANA
48NANANA

\begin{tabular}{lllllllll}
\hline
Autocorrelation Function \tabularnewline
Time lag k & ACF(k) & T-STAT & P-value \tabularnewline
1 & -0.083504 & -0.5215 & 0.30249 \tabularnewline
2 & -0.084075 & -0.525 & 0.301262 \tabularnewline
3 & 0.11831 & 0.7388 & 0.232212 \tabularnewline
4 & -0.420258 & -2.6245 & 0.006163 \tabularnewline
5 & 0.051688 & 0.3228 & 0.374289 \tabularnewline
6 & 0.084337 & 0.5267 & 0.300699 \tabularnewline
7 & -0.203719 & -1.2722 & 0.105413 \tabularnewline
8 & 0.185395 & 1.1578 & 0.126995 \tabularnewline
9 & -0.201312 & -1.2572 & 0.10808 \tabularnewline
10 & -0.129363 & -0.8079 & 0.212032 \tabularnewline
11 & 0.051817 & 0.3236 & 0.373985 \tabularnewline
12 & -0.16093 & -1.005 & 0.160543 \tabularnewline
13 & 0.076493 & 0.4777 & 0.317766 \tabularnewline
14 & 0.273001 & 1.7049 & 0.048085 \tabularnewline
15 & -0.035448 & -0.2214 & 0.412978 \tabularnewline
16 & 0.051851 & 0.3238 & 0.373907 \tabularnewline
17 & -0.008082 & -0.0505 & 0.480002 \tabularnewline
18 & -0.088984 & -0.5557 & 0.290793 \tabularnewline
19 & 0.146539 & 0.9151 & 0.182873 \tabularnewline
20 & -0.074535 & -0.4655 & 0.322092 \tabularnewline
21 & 0.0262 & 0.1636 & 0.435439 \tabularnewline
22 & 0.058528 & 0.3655 & 0.358354 \tabularnewline
23 & -0.227743 & -1.4223 & 0.081451 \tabularnewline
24 & 0.057 & 0.356 & 0.361893 \tabularnewline
25 & 0.010253 & 0.064 & 0.474636 \tabularnewline
26 & -0.147485 & -0.921 & 0.181346 \tabularnewline
27 & 0.179114 & 1.1186 & 0.135084 \tabularnewline
28 & -0.020715 & -0.1294 & 0.448868 \tabularnewline
29 & 0.031905 & 0.1992 & 0.421553 \tabularnewline
30 & 0.072635 & 0.4536 & 0.326313 \tabularnewline
31 & -0.080763 & -0.5044 & 0.308421 \tabularnewline
32 & -0.00786 & -0.0491 & 0.48055 \tabularnewline
33 & 0.009167 & 0.0572 & 0.47732 \tabularnewline
34 & -0.043425 & -0.2712 & 0.393839 \tabularnewline
35 & 0.032802 & 0.2048 & 0.419379 \tabularnewline
36 & -0.00071 & -0.0044 & 0.498243 \tabularnewline
37 & 0.002761 & 0.0172 & 0.493165 \tabularnewline
38 & -0.000884 & -0.0055 & 0.497812 \tabularnewline
39 & NA & NA & NA \tabularnewline
40 & NA & NA & NA \tabularnewline
41 & NA & NA & NA \tabularnewline
42 & NA & NA & NA \tabularnewline
43 & NA & NA & NA \tabularnewline
44 & NA & NA & NA \tabularnewline
45 & NA & NA & NA \tabularnewline
46 & NA & NA & NA \tabularnewline
47 & NA & NA & NA \tabularnewline
48 & NA & NA & NA \tabularnewline
\hline
\end{tabular}
%Source: https://freestatistics.org/blog/index.php?pk=301390&T=1

[TABLE]
[ROW][C]Autocorrelation Function[/C][/ROW]
[ROW][C]Time lag k[/C][C]ACF(k)[/C][C]T-STAT[/C][C]P-value[/C][/ROW]
[ROW][C]1[/C][C]-0.083504[/C][C]-0.5215[/C][C]0.30249[/C][/ROW]
[ROW][C]2[/C][C]-0.084075[/C][C]-0.525[/C][C]0.301262[/C][/ROW]
[ROW][C]3[/C][C]0.11831[/C][C]0.7388[/C][C]0.232212[/C][/ROW]
[ROW][C]4[/C][C]-0.420258[/C][C]-2.6245[/C][C]0.006163[/C][/ROW]
[ROW][C]5[/C][C]0.051688[/C][C]0.3228[/C][C]0.374289[/C][/ROW]
[ROW][C]6[/C][C]0.084337[/C][C]0.5267[/C][C]0.300699[/C][/ROW]
[ROW][C]7[/C][C]-0.203719[/C][C]-1.2722[/C][C]0.105413[/C][/ROW]
[ROW][C]8[/C][C]0.185395[/C][C]1.1578[/C][C]0.126995[/C][/ROW]
[ROW][C]9[/C][C]-0.201312[/C][C]-1.2572[/C][C]0.10808[/C][/ROW]
[ROW][C]10[/C][C]-0.129363[/C][C]-0.8079[/C][C]0.212032[/C][/ROW]
[ROW][C]11[/C][C]0.051817[/C][C]0.3236[/C][C]0.373985[/C][/ROW]
[ROW][C]12[/C][C]-0.16093[/C][C]-1.005[/C][C]0.160543[/C][/ROW]
[ROW][C]13[/C][C]0.076493[/C][C]0.4777[/C][C]0.317766[/C][/ROW]
[ROW][C]14[/C][C]0.273001[/C][C]1.7049[/C][C]0.048085[/C][/ROW]
[ROW][C]15[/C][C]-0.035448[/C][C]-0.2214[/C][C]0.412978[/C][/ROW]
[ROW][C]16[/C][C]0.051851[/C][C]0.3238[/C][C]0.373907[/C][/ROW]
[ROW][C]17[/C][C]-0.008082[/C][C]-0.0505[/C][C]0.480002[/C][/ROW]
[ROW][C]18[/C][C]-0.088984[/C][C]-0.5557[/C][C]0.290793[/C][/ROW]
[ROW][C]19[/C][C]0.146539[/C][C]0.9151[/C][C]0.182873[/C][/ROW]
[ROW][C]20[/C][C]-0.074535[/C][C]-0.4655[/C][C]0.322092[/C][/ROW]
[ROW][C]21[/C][C]0.0262[/C][C]0.1636[/C][C]0.435439[/C][/ROW]
[ROW][C]22[/C][C]0.058528[/C][C]0.3655[/C][C]0.358354[/C][/ROW]
[ROW][C]23[/C][C]-0.227743[/C][C]-1.4223[/C][C]0.081451[/C][/ROW]
[ROW][C]24[/C][C]0.057[/C][C]0.356[/C][C]0.361893[/C][/ROW]
[ROW][C]25[/C][C]0.010253[/C][C]0.064[/C][C]0.474636[/C][/ROW]
[ROW][C]26[/C][C]-0.147485[/C][C]-0.921[/C][C]0.181346[/C][/ROW]
[ROW][C]27[/C][C]0.179114[/C][C]1.1186[/C][C]0.135084[/C][/ROW]
[ROW][C]28[/C][C]-0.020715[/C][C]-0.1294[/C][C]0.448868[/C][/ROW]
[ROW][C]29[/C][C]0.031905[/C][C]0.1992[/C][C]0.421553[/C][/ROW]
[ROW][C]30[/C][C]0.072635[/C][C]0.4536[/C][C]0.326313[/C][/ROW]
[ROW][C]31[/C][C]-0.080763[/C][C]-0.5044[/C][C]0.308421[/C][/ROW]
[ROW][C]32[/C][C]-0.00786[/C][C]-0.0491[/C][C]0.48055[/C][/ROW]
[ROW][C]33[/C][C]0.009167[/C][C]0.0572[/C][C]0.47732[/C][/ROW]
[ROW][C]34[/C][C]-0.043425[/C][C]-0.2712[/C][C]0.393839[/C][/ROW]
[ROW][C]35[/C][C]0.032802[/C][C]0.2048[/C][C]0.419379[/C][/ROW]
[ROW][C]36[/C][C]-0.00071[/C][C]-0.0044[/C][C]0.498243[/C][/ROW]
[ROW][C]37[/C][C]0.002761[/C][C]0.0172[/C][C]0.493165[/C][/ROW]
[ROW][C]38[/C][C]-0.000884[/C][C]-0.0055[/C][C]0.497812[/C][/ROW]
[ROW][C]39[/C][C]NA[/C][C]NA[/C][C]NA[/C][/ROW]
[ROW][C]40[/C][C]NA[/C][C]NA[/C][C]NA[/C][/ROW]
[ROW][C]41[/C][C]NA[/C][C]NA[/C][C]NA[/C][/ROW]
[ROW][C]42[/C][C]NA[/C][C]NA[/C][C]NA[/C][/ROW]
[ROW][C]43[/C][C]NA[/C][C]NA[/C][C]NA[/C][/ROW]
[ROW][C]44[/C][C]NA[/C][C]NA[/C][C]NA[/C][/ROW]
[ROW][C]45[/C][C]NA[/C][C]NA[/C][C]NA[/C][/ROW]
[ROW][C]46[/C][C]NA[/C][C]NA[/C][C]NA[/C][/ROW]
[ROW][C]47[/C][C]NA[/C][C]NA[/C][C]NA[/C][/ROW]
[ROW][C]48[/C][C]NA[/C][C]NA[/C][C]NA[/C][/ROW]
[/TABLE]
Source: https://freestatistics.org/blog/index.php?pk=301390&T=1

Globally Unique Identifier (entire table): ba.freestatistics.org/blog/index.php?pk=301390&T=1

As an alternative you can also use a QR Code:  

The GUIDs for individual cells are displayed in the table below:

Autocorrelation Function
Time lag kACF(k)T-STATP-value
1-0.083504-0.52150.30249
2-0.084075-0.5250.301262
30.118310.73880.232212
4-0.420258-2.62450.006163
50.0516880.32280.374289
60.0843370.52670.300699
7-0.203719-1.27220.105413
80.1853951.15780.126995
9-0.201312-1.25720.10808
10-0.129363-0.80790.212032
110.0518170.32360.373985
12-0.16093-1.0050.160543
130.0764930.47770.317766
140.2730011.70490.048085
15-0.035448-0.22140.412978
160.0518510.32380.373907
17-0.008082-0.05050.480002
18-0.088984-0.55570.290793
190.1465390.91510.182873
20-0.074535-0.46550.322092
210.02620.16360.435439
220.0585280.36550.358354
23-0.227743-1.42230.081451
240.0570.3560.361893
250.0102530.0640.474636
26-0.147485-0.9210.181346
270.1791141.11860.135084
28-0.020715-0.12940.448868
290.0319050.19920.421553
300.0726350.45360.326313
31-0.080763-0.50440.308421
32-0.00786-0.04910.48055
330.0091670.05720.47732
34-0.043425-0.27120.393839
350.0328020.20480.419379
36-0.00071-0.00440.498243
370.0027610.01720.493165
38-0.000884-0.00550.497812
39NANANA
40NANANA
41NANANA
42NANANA
43NANANA
44NANANA
45NANANA
46NANANA
47NANANA
48NANANA


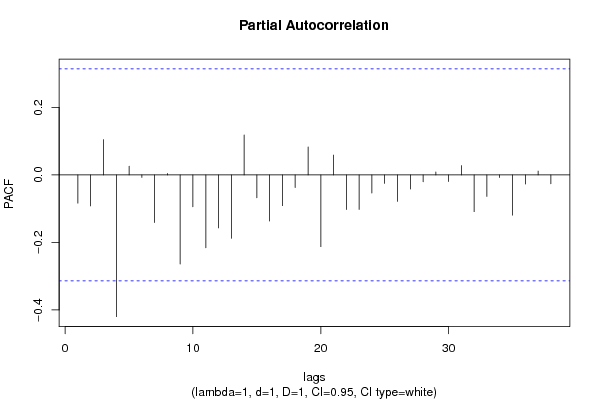
Partial Autocorrelation Function
Time lag kPACF(k)T-STATP-value
1-0.083504-0.52150.30249
2-0.091687-0.57260.285106
30.1045920.65320.258738
4-0.419732-2.62120.006213
50.0255770.15970.436959
6-0.007224-0.04510.482122
7-0.140897-0.87990.192151
80.0041660.0260.489688
9-0.263736-1.6470.053794
10-0.094179-0.58810.279912
11-0.215789-1.34760.092782
12-0.15696-0.98020.166511
13-0.187576-1.17140.12427
140.1184250.73960.231996
15-0.067768-0.42320.337233
16-0.136618-0.85320.199386
17-0.09101-0.56840.286525
18-0.037204-0.23230.408745
190.0828260.51720.303952
20-0.212405-1.32650.0962
210.0586810.36650.358001
22-0.102311-0.63890.263301
23-0.102144-0.63790.263637
24-0.053621-0.33490.369762
25-0.025128-0.15690.438056
26-0.078483-0.49010.313395
27-0.041527-0.25930.39837
28-0.020184-0.1260.450171
290.0085060.05310.478953
30-0.019319-0.12060.452294
310.0275890.17230.432049
32-0.108722-0.6790.250583
33-0.06349-0.39650.346951
34-0.007597-0.04740.481201
35-0.119193-0.74440.23056
36-0.026849-0.16770.433854
370.0112620.07030.472146
38-0.026252-0.16390.435312
39NANANA
40NANANA
41NANANA
42NANANA
43NANANA
44NANANA
45NANANA
46NANANA
47NANANA
48NANANA

\begin{tabular}{lllllllll}
\hline
Partial Autocorrelation Function \tabularnewline
Time lag k & PACF(k) & T-STAT & P-value \tabularnewline
1 & -0.083504 & -0.5215 & 0.30249 \tabularnewline
2 & -0.091687 & -0.5726 & 0.285106 \tabularnewline
3 & 0.104592 & 0.6532 & 0.258738 \tabularnewline
4 & -0.419732 & -2.6212 & 0.006213 \tabularnewline
5 & 0.025577 & 0.1597 & 0.436959 \tabularnewline
6 & -0.007224 & -0.0451 & 0.482122 \tabularnewline
7 & -0.140897 & -0.8799 & 0.192151 \tabularnewline
8 & 0.004166 & 0.026 & 0.489688 \tabularnewline
9 & -0.263736 & -1.647 & 0.053794 \tabularnewline
10 & -0.094179 & -0.5881 & 0.279912 \tabularnewline
11 & -0.215789 & -1.3476 & 0.092782 \tabularnewline
12 & -0.15696 & -0.9802 & 0.166511 \tabularnewline
13 & -0.187576 & -1.1714 & 0.12427 \tabularnewline
14 & 0.118425 & 0.7396 & 0.231996 \tabularnewline
15 & -0.067768 & -0.4232 & 0.337233 \tabularnewline
16 & -0.136618 & -0.8532 & 0.199386 \tabularnewline
17 & -0.09101 & -0.5684 & 0.286525 \tabularnewline
18 & -0.037204 & -0.2323 & 0.408745 \tabularnewline
19 & 0.082826 & 0.5172 & 0.303952 \tabularnewline
20 & -0.212405 & -1.3265 & 0.0962 \tabularnewline
21 & 0.058681 & 0.3665 & 0.358001 \tabularnewline
22 & -0.102311 & -0.6389 & 0.263301 \tabularnewline
23 & -0.102144 & -0.6379 & 0.263637 \tabularnewline
24 & -0.053621 & -0.3349 & 0.369762 \tabularnewline
25 & -0.025128 & -0.1569 & 0.438056 \tabularnewline
26 & -0.078483 & -0.4901 & 0.313395 \tabularnewline
27 & -0.041527 & -0.2593 & 0.39837 \tabularnewline
28 & -0.020184 & -0.126 & 0.450171 \tabularnewline
29 & 0.008506 & 0.0531 & 0.478953 \tabularnewline
30 & -0.019319 & -0.1206 & 0.452294 \tabularnewline
31 & 0.027589 & 0.1723 & 0.432049 \tabularnewline
32 & -0.108722 & -0.679 & 0.250583 \tabularnewline
33 & -0.06349 & -0.3965 & 0.346951 \tabularnewline
34 & -0.007597 & -0.0474 & 0.481201 \tabularnewline
35 & -0.119193 & -0.7444 & 0.23056 \tabularnewline
36 & -0.026849 & -0.1677 & 0.433854 \tabularnewline
37 & 0.011262 & 0.0703 & 0.472146 \tabularnewline
38 & -0.026252 & -0.1639 & 0.435312 \tabularnewline
39 & NA & NA & NA \tabularnewline
40 & NA & NA & NA \tabularnewline
41 & NA & NA & NA \tabularnewline
42 & NA & NA & NA \tabularnewline
43 & NA & NA & NA \tabularnewline
44 & NA & NA & NA \tabularnewline
45 & NA & NA & NA \tabularnewline
46 & NA & NA & NA \tabularnewline
47 & NA & NA & NA \tabularnewline
48 & NA & NA & NA \tabularnewline
\hline
\end{tabular}
%Source: https://freestatistics.org/blog/index.php?pk=301390&T=2

[TABLE]
[ROW][C]Partial Autocorrelation Function[/C][/ROW]
[ROW][C]Time lag k[/C][C]PACF(k)[/C][C]T-STAT[/C][C]P-value[/C][/ROW]
[ROW][C]1[/C][C]-0.083504[/C][C]-0.5215[/C][C]0.30249[/C][/ROW]
[ROW][C]2[/C][C]-0.091687[/C][C]-0.5726[/C][C]0.285106[/C][/ROW]
[ROW][C]3[/C][C]0.104592[/C][C]0.6532[/C][C]0.258738[/C][/ROW]
[ROW][C]4[/C][C]-0.419732[/C][C]-2.6212[/C][C]0.006213[/C][/ROW]
[ROW][C]5[/C][C]0.025577[/C][C]0.1597[/C][C]0.436959[/C][/ROW]
[ROW][C]6[/C][C]-0.007224[/C][C]-0.0451[/C][C]0.482122[/C][/ROW]
[ROW][C]7[/C][C]-0.140897[/C][C]-0.8799[/C][C]0.192151[/C][/ROW]
[ROW][C]8[/C][C]0.004166[/C][C]0.026[/C][C]0.489688[/C][/ROW]
[ROW][C]9[/C][C]-0.263736[/C][C]-1.647[/C][C]0.053794[/C][/ROW]
[ROW][C]10[/C][C]-0.094179[/C][C]-0.5881[/C][C]0.279912[/C][/ROW]
[ROW][C]11[/C][C]-0.215789[/C][C]-1.3476[/C][C]0.092782[/C][/ROW]
[ROW][C]12[/C][C]-0.15696[/C][C]-0.9802[/C][C]0.166511[/C][/ROW]
[ROW][C]13[/C][C]-0.187576[/C][C]-1.1714[/C][C]0.12427[/C][/ROW]
[ROW][C]14[/C][C]0.118425[/C][C]0.7396[/C][C]0.231996[/C][/ROW]
[ROW][C]15[/C][C]-0.067768[/C][C]-0.4232[/C][C]0.337233[/C][/ROW]
[ROW][C]16[/C][C]-0.136618[/C][C]-0.8532[/C][C]0.199386[/C][/ROW]
[ROW][C]17[/C][C]-0.09101[/C][C]-0.5684[/C][C]0.286525[/C][/ROW]
[ROW][C]18[/C][C]-0.037204[/C][C]-0.2323[/C][C]0.408745[/C][/ROW]
[ROW][C]19[/C][C]0.082826[/C][C]0.5172[/C][C]0.303952[/C][/ROW]
[ROW][C]20[/C][C]-0.212405[/C][C]-1.3265[/C][C]0.0962[/C][/ROW]
[ROW][C]21[/C][C]0.058681[/C][C]0.3665[/C][C]0.358001[/C][/ROW]
[ROW][C]22[/C][C]-0.102311[/C][C]-0.6389[/C][C]0.263301[/C][/ROW]
[ROW][C]23[/C][C]-0.102144[/C][C]-0.6379[/C][C]0.263637[/C][/ROW]
[ROW][C]24[/C][C]-0.053621[/C][C]-0.3349[/C][C]0.369762[/C][/ROW]
[ROW][C]25[/C][C]-0.025128[/C][C]-0.1569[/C][C]0.438056[/C][/ROW]
[ROW][C]26[/C][C]-0.078483[/C][C]-0.4901[/C][C]0.313395[/C][/ROW]
[ROW][C]27[/C][C]-0.041527[/C][C]-0.2593[/C][C]0.39837[/C][/ROW]
[ROW][C]28[/C][C]-0.020184[/C][C]-0.126[/C][C]0.450171[/C][/ROW]
[ROW][C]29[/C][C]0.008506[/C][C]0.0531[/C][C]0.478953[/C][/ROW]
[ROW][C]30[/C][C]-0.019319[/C][C]-0.1206[/C][C]0.452294[/C][/ROW]
[ROW][C]31[/C][C]0.027589[/C][C]0.1723[/C][C]0.432049[/C][/ROW]
[ROW][C]32[/C][C]-0.108722[/C][C]-0.679[/C][C]0.250583[/C][/ROW]
[ROW][C]33[/C][C]-0.06349[/C][C]-0.3965[/C][C]0.346951[/C][/ROW]
[ROW][C]34[/C][C]-0.007597[/C][C]-0.0474[/C][C]0.481201[/C][/ROW]
[ROW][C]35[/C][C]-0.119193[/C][C]-0.7444[/C][C]0.23056[/C][/ROW]
[ROW][C]36[/C][C]-0.026849[/C][C]-0.1677[/C][C]0.433854[/C][/ROW]
[ROW][C]37[/C][C]0.011262[/C][C]0.0703[/C][C]0.472146[/C][/ROW]
[ROW][C]38[/C][C]-0.026252[/C][C]-0.1639[/C][C]0.435312[/C][/ROW]
[ROW][C]39[/C][C]NA[/C][C]NA[/C][C]NA[/C][/ROW]
[ROW][C]40[/C][C]NA[/C][C]NA[/C][C]NA[/C][/ROW]
[ROW][C]41[/C][C]NA[/C][C]NA[/C][C]NA[/C][/ROW]
[ROW][C]42[/C][C]NA[/C][C]NA[/C][C]NA[/C][/ROW]
[ROW][C]43[/C][C]NA[/C][C]NA[/C][C]NA[/C][/ROW]
[ROW][C]44[/C][C]NA[/C][C]NA[/C][C]NA[/C][/ROW]
[ROW][C]45[/C][C]NA[/C][C]NA[/C][C]NA[/C][/ROW]
[ROW][C]46[/C][C]NA[/C][C]NA[/C][C]NA[/C][/ROW]
[ROW][C]47[/C][C]NA[/C][C]NA[/C][C]NA[/C][/ROW]
[ROW][C]48[/C][C]NA[/C][C]NA[/C][C]NA[/C][/ROW]
[/TABLE]
Source: https://freestatistics.org/blog/index.php?pk=301390&T=2

Globally Unique Identifier (entire table): ba.freestatistics.org/blog/index.php?pk=301390&T=2

As an alternative you can also use a QR Code:  

The GUIDs for individual cells are displayed in the table below:

Partial Autocorrelation Function
Time lag kPACF(k)T-STATP-value
1-0.083504-0.52150.30249
2-0.091687-0.57260.285106
30.1045920.65320.258738
4-0.419732-2.62120.006213
50.0255770.15970.436959
6-0.007224-0.04510.482122
7-0.140897-0.87990.192151
80.0041660.0260.489688
9-0.263736-1.6470.053794
10-0.094179-0.58810.279912
11-0.215789-1.34760.092782
12-0.15696-0.98020.166511
13-0.187576-1.17140.12427
140.1184250.73960.231996
15-0.067768-0.42320.337233
16-0.136618-0.85320.199386
17-0.09101-0.56840.286525
18-0.037204-0.23230.408745
190.0828260.51720.303952
20-0.212405-1.32650.0962
210.0586810.36650.358001
22-0.102311-0.63890.263301
23-0.102144-0.63790.263637
24-0.053621-0.33490.369762
25-0.025128-0.15690.438056
26-0.078483-0.49010.313395
27-0.041527-0.25930.39837
28-0.020184-0.1260.450171
290.0085060.05310.478953
30-0.019319-0.12060.452294
310.0275890.17230.432049
32-0.108722-0.6790.250583
33-0.06349-0.39650.346951
34-0.007597-0.04740.481201
35-0.119193-0.74440.23056
36-0.026849-0.16770.433854
370.0112620.07030.472146
38-0.026252-0.16390.435312
39NANANA
40NANANA
41NANANA
42NANANA
43NANANA
44NANANA
45NANANA
46NANANA
47NANANA
48NANANA


Parameters (Session):
par1 = 48 ; par2 = 1 ; par3 = 1 ; par4 = 1 ; par5 = 4 ; par6 = White Noise ; par7 = 0.95 ;
Parameters (R input):
par1 = 48 ; par2 = 1 ; par3 = 1 ; par4 = 1 ; par5 = 4 ; par6 = White Noise ; par7 = 0.95 ; par8 = ;
R code (references can be found in the software module):
par8 <- ''
par7 <- '0.95'
par6 <- 'White Noise'
par5 <- '4'
par4 <- '0'
par3 <- '0'
par2 <- '1'
par1 <- '48'
if (par1 == 'Default') {
par1 = 10*log10(length(x))
} else {
par1 <- as.numeric(par1)
}
par2 <- as.numeric(par2)
par3 <- as.numeric(par3)
par4 <- as.numeric(par4)
par5 <- as.numeric(par5)
if (par6 == 'White Noise') par6 <- 'white' else par6 <- 'ma'
par7 <- as.numeric(par7)
if (par8 != '') par8 <- as.numeric(par8)
x <- na.omit(x)
ox <- x
if (par8 == '') {
if (par2 == 0) {
x <- log(x)
} else {
x <- (x ^ par2 - 1) / par2
}
} else {
x <- log(x,base=par8)
}
if (par3 > 0) x <- diff(x,lag=1,difference=par3)
if (par4 > 0) x <- diff(x,lag=par5,difference=par4)
bitmap(file='picts.png')
op <- par(mfrow=c(2,1))
plot(ox,type='l',main='Original Time Series',xlab='time',ylab='value')
if (par8=='') {
mytitle <- paste('Working Time Series (lambda=',par2,', d=',par3,', D=',par4,')',sep='')
mysub <- paste('(lambda=',par2,', d=',par3,', D=',par4,', CI=', par7, ', CI type=',par6,')',sep='')
} else {
mytitle <- paste('Working Time Series (base=',par8,', d=',par3,', D=',par4,')',sep='')
mysub <- paste('(base=',par8,', d=',par3,', D=',par4,', CI=', par7, ', CI type=',par6,')',sep='')
}
plot(x,type='l', main=mytitle,xlab='time',ylab='value')
par(op)
dev.off()
bitmap(file='pic1.png')
racf <- acf(x, par1, main='Autocorrelation', xlab='time lag', ylab='ACF', ci.type=par6, ci=par7, sub=mysub)
dev.off()
bitmap(file='pic2.png')
rpacf <- pacf(x,par1,main='Partial Autocorrelation',xlab='lags',ylab='PACF',sub=mysub)
dev.off()
(myacf <- c(racf$acf))
(mypacf <- c(rpacf$acf))
lengthx <- length(x)
sqrtn <- sqrt(lengthx)
load(file='createtable')
a<-table.start()
a<-table.row.start(a)
a<-table.element(a,'Autocorrelation Function',4,TRUE)
a<-table.row.end(a)
a<-table.row.start(a)
a<-table.element(a,'Time lag k',header=TRUE)
a<-table.element(a,'ACF(k)',header=TRUE)
a<-table.element(a,'T-STAT',header=TRUE)
a<-table.element(a,'P-value',header=TRUE)
a<-table.row.end(a)
for (i in 2:(par1+1)) {
a<-table.row.start(a)
a<-table.element(a,i-1,header=TRUE)
a<-table.element(a,round(myacf[i],6))
mytstat <- myacf[i]*sqrtn
a<-table.element(a,round(mytstat,4))
a<-table.element(a,round(1-pt(abs(mytstat),lengthx),6))
a<-table.row.end(a)
}
a<-table.end(a)
table.save(a,file='mytable.tab')
a<-table.start()
a<-table.row.start(a)
a<-table.element(a,'Partial Autocorrelation Function',4,TRUE)
a<-table.row.end(a)
a<-table.row.start(a)
a<-table.element(a,'Time lag k',header=TRUE)
a<-table.element(a,'PACF(k)',header=TRUE)
a<-table.element(a,'T-STAT',header=TRUE)
a<-table.element(a,'P-value',header=TRUE)
a<-table.row.end(a)
for (i in 1:par1) {
a<-table.row.start(a)
a<-table.element(a,i,header=TRUE)
a<-table.element(a,round(mypacf[i],6))
mytstat <- mypacf[i]*sqrtn
a<-table.element(a,round(mytstat,4))
a<-table.element(a,round(1-pt(abs(mytstat),lengthx),6))
a<-table.row.end(a)
}
a<-table.end(a)
table.save(a,file='mytable1.tab')