Free Statistics

of Irreproducible Research!

Author's title

Author*Unverified author*
R Software Modulerwasp_exponentialsmoothing.wasp
Title produced by softwareExponential Smoothing
Date of computationMon, 19 Dec 2016 16:12:37 +0100
Cite this page as followsStatistical Computations at FreeStatistics.org, Office for Research Development and Education, URL https://freestatistics.org/blog/index.php?v=date/2016/Dec/19/t1482160435d6aq66r0c6k2r7b.htm/, Retrieved Fri, 01 Nov 2024 03:35:29 +0000
Statistical Computations at FreeStatistics.org, Office for Research Development and Education, URL https://freestatistics.org/blog/index.php?pk=301387, Retrieved Fri, 01 Nov 2024 03:35:29 +0000
QR Codes:

Original text written by user:
IsPrivate?No (this computation is public)
User-defined keywords
Estimated Impact116
Family? (F = Feedback message, R = changed R code, M = changed R Module, P = changed Parameters, D = changed Data)
-       [Exponential Smoothing] [Exponential Smoot...] [2016-12-19 15:12:37] [d41d8cd98f00b204e9800998ecf8427e] [Current]
Feedback Forum

Post a new message
Dataseries X:
3329.04
3170
2555.12
2221.44
3618.64
3504.4
2757.28
2687.6
3709.68
3771.44
2792.56
2930.24
3751.76
3631.92
2789.2
3158.24
4548.96
4191.36
3088.96
3480.16
4703.44
4584.64
3496.16
4215.52
4250.48
4779.6
3626.24
4571.44
5091.04
5398.24
4272.56
5206.56
5318.8
6039.76
4922.24
5694.64
5940.88
4937.92
4710.32
6057.2
5401.6


Summary of computational transaction
Raw Input view raw input (R code)
Raw Outputview raw output of R engine
Computing time1 seconds
R ServerBig Analytics Cloud Computing Center

\begin{tabular}{lllllllll}
\hline
Summary of computational transaction \tabularnewline
Raw Input view raw input (R code)  \tabularnewline
Raw Outputview raw output of R engine  \tabularnewline
Computing time1 seconds \tabularnewline
R ServerBig Analytics Cloud Computing Center \tabularnewline
\hline
\end{tabular}
%Source: https://freestatistics.org/blog/index.php?pk=301387&T=0

[TABLE]
[ROW]
Summary of computational transaction[/C][/ROW] [ROW]Raw Input[/C] view raw input (R code) [/C][/ROW] [ROW]Raw Output[/C]view raw output of R engine [/C][/ROW] [ROW]Computing time[/C]1 seconds[/C][/ROW] [ROW]R Server[/C]Big Analytics Cloud Computing Center[/C][/ROW] [/TABLE] Source: https://freestatistics.org/blog/index.php?pk=301387&T=0

Globally Unique Identifier (entire table): ba.freestatistics.org/blog/index.php?pk=301387&T=0

As an alternative you can also use a QR Code:  

The GUIDs for individual cells are displayed in the table below:

Summary of computational transaction
Raw Input view raw input (R code)
Raw Outputview raw output of R engine
Computing time1 seconds
R ServerBig Analytics Cloud Computing Center


Estimated Parameters of Exponential Smoothing
ParameterValue
alpha0.0193118616985213
beta1
gamma1

\begin{tabular}{lllllllll}
\hline
Estimated Parameters of Exponential Smoothing \tabularnewline
Parameter & Value \tabularnewline
alpha & 0.0193118616985213 \tabularnewline
beta & 1 \tabularnewline
gamma & 1 \tabularnewline
\hline
\end{tabular}
%Source: https://freestatistics.org/blog/index.php?pk=301387&T=1

[TABLE]
[ROW][C]Estimated Parameters of Exponential Smoothing[/C][/ROW]
[ROW][C]Parameter[/C][C]Value[/C][/ROW]
[ROW][C]alpha[/C][C]0.0193118616985213[/C][/ROW]
[ROW][C]beta[/C][C]1[/C][/ROW]
[ROW][C]gamma[/C][C]1[/C][/ROW]
[/TABLE]
Source: https://freestatistics.org/blog/index.php?pk=301387&T=1

Globally Unique Identifier (entire table): ba.freestatistics.org/blog/index.php?pk=301387&T=1

As an alternative you can also use a QR Code:  

The GUIDs for individual cells are displayed in the table below:

Estimated Parameters of Exponential Smoothing
ParameterValue
alpha0.0193118616985213
beta1
gamma1


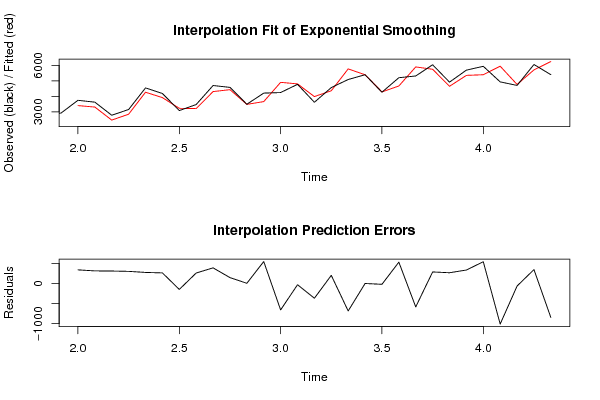
Interpolation Forecasts of Exponential Smoothing
tObservedFittedResiduals
133751.763410.93194444445340.828055555552
143631.923316.53281117315.387188830004
152789.22477.26641450135311.933585498647
163158.242854.85734058509303.382659414912
174548.964271.91201632725277.047983672752
184191.363925.81843279814265.541567201856
193088.963235.92740763319-146.967407633186
203480.163217.86518527974262.294814720255
214703.444312.39197954894391.04802045106
224584.644436.85043654221147.789563457785
233496.163489.815211467026.34478853297878
244215.523667.14095413916548.379045860844
254250.484908.55397233372-658.073972333721
264779.64809.0039156445-29.4039156445015
273626.243992.12278552947-365.882785529472
284571.444367.57886030238203.861139697618
295091.045774.30437675385-683.264376753852
305398.245397.254638753970.985361246026514
314272.564291.47628047211-18.9162804721082
325206.564673.48287465936533.077125340636
335318.85900.97233558896-582.172335588962
346039.765750.74732993016289.012670069844
354922.244653.12537164931269.114628350687
365694.645357.56602933044337.073970669556
375940.885398.13726787641542.742732123593
384937.925947.88957003225-1009.96957003225
394710.324772.7375920471-62.4175920470998
406057.25709.30226877225347.897731227752
415401.66248.10455829136-846.504558291361

\begin{tabular}{lllllllll}
\hline
Interpolation Forecasts of Exponential Smoothing \tabularnewline
t & Observed & Fitted & Residuals \tabularnewline
13 & 3751.76 & 3410.93194444445 & 340.828055555552 \tabularnewline
14 & 3631.92 & 3316.53281117 & 315.387188830004 \tabularnewline
15 & 2789.2 & 2477.26641450135 & 311.933585498647 \tabularnewline
16 & 3158.24 & 2854.85734058509 & 303.382659414912 \tabularnewline
17 & 4548.96 & 4271.91201632725 & 277.047983672752 \tabularnewline
18 & 4191.36 & 3925.81843279814 & 265.541567201856 \tabularnewline
19 & 3088.96 & 3235.92740763319 & -146.967407633186 \tabularnewline
20 & 3480.16 & 3217.86518527974 & 262.294814720255 \tabularnewline
21 & 4703.44 & 4312.39197954894 & 391.04802045106 \tabularnewline
22 & 4584.64 & 4436.85043654221 & 147.789563457785 \tabularnewline
23 & 3496.16 & 3489.81521146702 & 6.34478853297878 \tabularnewline
24 & 4215.52 & 3667.14095413916 & 548.379045860844 \tabularnewline
25 & 4250.48 & 4908.55397233372 & -658.073972333721 \tabularnewline
26 & 4779.6 & 4809.0039156445 & -29.4039156445015 \tabularnewline
27 & 3626.24 & 3992.12278552947 & -365.882785529472 \tabularnewline
28 & 4571.44 & 4367.57886030238 & 203.861139697618 \tabularnewline
29 & 5091.04 & 5774.30437675385 & -683.264376753852 \tabularnewline
30 & 5398.24 & 5397.25463875397 & 0.985361246026514 \tabularnewline
31 & 4272.56 & 4291.47628047211 & -18.9162804721082 \tabularnewline
32 & 5206.56 & 4673.48287465936 & 533.077125340636 \tabularnewline
33 & 5318.8 & 5900.97233558896 & -582.172335588962 \tabularnewline
34 & 6039.76 & 5750.74732993016 & 289.012670069844 \tabularnewline
35 & 4922.24 & 4653.12537164931 & 269.114628350687 \tabularnewline
36 & 5694.64 & 5357.56602933044 & 337.073970669556 \tabularnewline
37 & 5940.88 & 5398.13726787641 & 542.742732123593 \tabularnewline
38 & 4937.92 & 5947.88957003225 & -1009.96957003225 \tabularnewline
39 & 4710.32 & 4772.7375920471 & -62.4175920470998 \tabularnewline
40 & 6057.2 & 5709.30226877225 & 347.897731227752 \tabularnewline
41 & 5401.6 & 6248.10455829136 & -846.504558291361 \tabularnewline
\hline
\end{tabular}
%Source: https://freestatistics.org/blog/index.php?pk=301387&T=2

[TABLE]
[ROW][C]Interpolation Forecasts of Exponential Smoothing[/C][/ROW]
[ROW][C]t[/C][C]Observed[/C][C]Fitted[/C][C]Residuals[/C][/ROW]
[ROW][C]13[/C][C]3751.76[/C][C]3410.93194444445[/C][C]340.828055555552[/C][/ROW]
[ROW][C]14[/C][C]3631.92[/C][C]3316.53281117[/C][C]315.387188830004[/C][/ROW]
[ROW][C]15[/C][C]2789.2[/C][C]2477.26641450135[/C][C]311.933585498647[/C][/ROW]
[ROW][C]16[/C][C]3158.24[/C][C]2854.85734058509[/C][C]303.382659414912[/C][/ROW]
[ROW][C]17[/C][C]4548.96[/C][C]4271.91201632725[/C][C]277.047983672752[/C][/ROW]
[ROW][C]18[/C][C]4191.36[/C][C]3925.81843279814[/C][C]265.541567201856[/C][/ROW]
[ROW][C]19[/C][C]3088.96[/C][C]3235.92740763319[/C][C]-146.967407633186[/C][/ROW]
[ROW][C]20[/C][C]3480.16[/C][C]3217.86518527974[/C][C]262.294814720255[/C][/ROW]
[ROW][C]21[/C][C]4703.44[/C][C]4312.39197954894[/C][C]391.04802045106[/C][/ROW]
[ROW][C]22[/C][C]4584.64[/C][C]4436.85043654221[/C][C]147.789563457785[/C][/ROW]
[ROW][C]23[/C][C]3496.16[/C][C]3489.81521146702[/C][C]6.34478853297878[/C][/ROW]
[ROW][C]24[/C][C]4215.52[/C][C]3667.14095413916[/C][C]548.379045860844[/C][/ROW]
[ROW][C]25[/C][C]4250.48[/C][C]4908.55397233372[/C][C]-658.073972333721[/C][/ROW]
[ROW][C]26[/C][C]4779.6[/C][C]4809.0039156445[/C][C]-29.4039156445015[/C][/ROW]
[ROW][C]27[/C][C]3626.24[/C][C]3992.12278552947[/C][C]-365.882785529472[/C][/ROW]
[ROW][C]28[/C][C]4571.44[/C][C]4367.57886030238[/C][C]203.861139697618[/C][/ROW]
[ROW][C]29[/C][C]5091.04[/C][C]5774.30437675385[/C][C]-683.264376753852[/C][/ROW]
[ROW][C]30[/C][C]5398.24[/C][C]5397.25463875397[/C][C]0.985361246026514[/C][/ROW]
[ROW][C]31[/C][C]4272.56[/C][C]4291.47628047211[/C][C]-18.9162804721082[/C][/ROW]
[ROW][C]32[/C][C]5206.56[/C][C]4673.48287465936[/C][C]533.077125340636[/C][/ROW]
[ROW][C]33[/C][C]5318.8[/C][C]5900.97233558896[/C][C]-582.172335588962[/C][/ROW]
[ROW][C]34[/C][C]6039.76[/C][C]5750.74732993016[/C][C]289.012670069844[/C][/ROW]
[ROW][C]35[/C][C]4922.24[/C][C]4653.12537164931[/C][C]269.114628350687[/C][/ROW]
[ROW][C]36[/C][C]5694.64[/C][C]5357.56602933044[/C][C]337.073970669556[/C][/ROW]
[ROW][C]37[/C][C]5940.88[/C][C]5398.13726787641[/C][C]542.742732123593[/C][/ROW]
[ROW][C]38[/C][C]4937.92[/C][C]5947.88957003225[/C][C]-1009.96957003225[/C][/ROW]
[ROW][C]39[/C][C]4710.32[/C][C]4772.7375920471[/C][C]-62.4175920470998[/C][/ROW]
[ROW][C]40[/C][C]6057.2[/C][C]5709.30226877225[/C][C]347.897731227752[/C][/ROW]
[ROW][C]41[/C][C]5401.6[/C][C]6248.10455829136[/C][C]-846.504558291361[/C][/ROW]
[/TABLE]
Source: https://freestatistics.org/blog/index.php?pk=301387&T=2

Globally Unique Identifier (entire table): ba.freestatistics.org/blog/index.php?pk=301387&T=2

As an alternative you can also use a QR Code:  

The GUIDs for individual cells are displayed in the table below:

Interpolation Forecasts of Exponential Smoothing
tObservedFittedResiduals
133751.763410.93194444445340.828055555552
143631.923316.53281117315.387188830004
152789.22477.26641450135311.933585498647
163158.242854.85734058509303.382659414912
174548.964271.91201632725277.047983672752
184191.363925.81843279814265.541567201856
193088.963235.92740763319-146.967407633186
203480.163217.86518527974262.294814720255
214703.444312.39197954894391.04802045106
224584.644436.85043654221147.789563457785
233496.163489.815211467026.34478853297878
244215.523667.14095413916548.379045860844
254250.484908.55397233372-658.073972333721
264779.64809.0039156445-29.4039156445015
273626.243992.12278552947-365.882785529472
284571.444367.57886030238203.861139697618
295091.045774.30437675385-683.264376753852
305398.245397.254638753970.985361246026514
314272.564291.47628047211-18.9162804721082
325206.564673.48287465936533.077125340636
335318.85900.97233558896-582.172335588962
346039.765750.74732993016289.012670069844
354922.244653.12537164931269.114628350687
365694.645357.56602933044337.073970669556
375940.885398.13726787641542.742732123593
384937.925947.88957003225-1009.96957003225
394710.324772.7375920471-62.4175920470998
406057.25709.30226877225347.897731227752
415401.66248.10455829136-846.504558291361


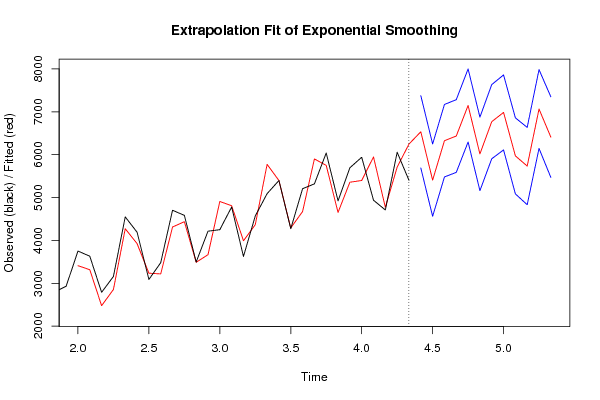
Extrapolation Forecasts of Exponential Smoothing
tForecast95% Lower Bound95% Upper Bound
426535.074107865895691.565352419387378.58286331239
435405.876544989634561.738854205426250.01423577384
446326.064270394155480.513185539087171.61535524922
456435.734827428275587.676858271727283.79279658482
467148.544011748886296.58380311398000.50422038386
476017.676091585735160.127853009246875.22433016223
486770.218645518855905.122476033287635.31481500441
496986.119826871316111.263204183917860.97644955871
505972.325400879955085.26966692996859.38113483
515735.096374793764833.20758601586636.98516357171
527065.628795836876146.111880781527985.14571089221
536410.028795836875469.96364137897350.09395029483

\begin{tabular}{lllllllll}
\hline
Extrapolation Forecasts of Exponential Smoothing \tabularnewline
t & Forecast & 95% Lower Bound & 95% Upper Bound \tabularnewline
42 & 6535.07410786589 & 5691.56535241938 & 7378.58286331239 \tabularnewline
43 & 5405.87654498963 & 4561.73885420542 & 6250.01423577384 \tabularnewline
44 & 6326.06427039415 & 5480.51318553908 & 7171.61535524922 \tabularnewline
45 & 6435.73482742827 & 5587.67685827172 & 7283.79279658482 \tabularnewline
46 & 7148.54401174888 & 6296.5838031139 & 8000.50422038386 \tabularnewline
47 & 6017.67609158573 & 5160.12785300924 & 6875.22433016223 \tabularnewline
48 & 6770.21864551885 & 5905.12247603328 & 7635.31481500441 \tabularnewline
49 & 6986.11982687131 & 6111.26320418391 & 7860.97644955871 \tabularnewline
50 & 5972.32540087995 & 5085.2696669299 & 6859.38113483 \tabularnewline
51 & 5735.09637479376 & 4833.2075860158 & 6636.98516357171 \tabularnewline
52 & 7065.62879583687 & 6146.11188078152 & 7985.14571089221 \tabularnewline
53 & 6410.02879583687 & 5469.9636413789 & 7350.09395029483 \tabularnewline
\hline
\end{tabular}
%Source: https://freestatistics.org/blog/index.php?pk=301387&T=3

[TABLE]
[ROW][C]Extrapolation Forecasts of Exponential Smoothing[/C][/ROW]
[ROW][C]t[/C][C]Forecast[/C][C]95% Lower Bound[/C][C]95% Upper Bound[/C][/ROW]
[ROW][C]42[/C][C]6535.07410786589[/C][C]5691.56535241938[/C][C]7378.58286331239[/C][/ROW]
[ROW][C]43[/C][C]5405.87654498963[/C][C]4561.73885420542[/C][C]6250.01423577384[/C][/ROW]
[ROW][C]44[/C][C]6326.06427039415[/C][C]5480.51318553908[/C][C]7171.61535524922[/C][/ROW]
[ROW][C]45[/C][C]6435.73482742827[/C][C]5587.67685827172[/C][C]7283.79279658482[/C][/ROW]
[ROW][C]46[/C][C]7148.54401174888[/C][C]6296.5838031139[/C][C]8000.50422038386[/C][/ROW]
[ROW][C]47[/C][C]6017.67609158573[/C][C]5160.12785300924[/C][C]6875.22433016223[/C][/ROW]
[ROW][C]48[/C][C]6770.21864551885[/C][C]5905.12247603328[/C][C]7635.31481500441[/C][/ROW]
[ROW][C]49[/C][C]6986.11982687131[/C][C]6111.26320418391[/C][C]7860.97644955871[/C][/ROW]
[ROW][C]50[/C][C]5972.32540087995[/C][C]5085.2696669299[/C][C]6859.38113483[/C][/ROW]
[ROW][C]51[/C][C]5735.09637479376[/C][C]4833.2075860158[/C][C]6636.98516357171[/C][/ROW]
[ROW][C]52[/C][C]7065.62879583687[/C][C]6146.11188078152[/C][C]7985.14571089221[/C][/ROW]
[ROW][C]53[/C][C]6410.02879583687[/C][C]5469.9636413789[/C][C]7350.09395029483[/C][/ROW]
[/TABLE]
Source: https://freestatistics.org/blog/index.php?pk=301387&T=3

Globally Unique Identifier (entire table): ba.freestatistics.org/blog/index.php?pk=301387&T=3

As an alternative you can also use a QR Code:  

The GUIDs for individual cells are displayed in the table below:

Extrapolation Forecasts of Exponential Smoothing
tForecast95% Lower Bound95% Upper Bound
426535.074107865895691.565352419387378.58286331239
435405.876544989634561.738854205426250.01423577384
446326.064270394155480.513185539087171.61535524922
456435.734827428275587.676858271727283.79279658482
467148.544011748886296.58380311398000.50422038386
476017.676091585735160.127853009246875.22433016223
486770.218645518855905.122476033287635.31481500441
496986.119826871316111.263204183917860.97644955871
505972.325400879955085.26966692996859.38113483
515735.096374793764833.20758601586636.98516357171
527065.628795836876146.111880781527985.14571089221
536410.028795836875469.96364137897350.09395029483


Parameters (Session):
par4 = 12 ;
Parameters (R input):
par1 = 12 ; par2 = Triple ; par3 = additive ; par4 = 12 ;
R code (references can be found in the software module):
par1 <- as.numeric(par1)
par4 <- as.numeric(par4)
if (par2 == 'Single') K <- 1
if (par2 == 'Double') K <- 2
if (par2 == 'Triple') K <- par1
nx <- length(x)
nxmK <- nx - K
x <- ts(x, frequency = par1)
if (par2 == 'Single') fit <- HoltWinters(x, gamma=F, beta=F)
if (par2 == 'Double') fit <- HoltWinters(x, gamma=F)
if (par2 == 'Triple') fit <- HoltWinters(x, seasonal=par3)
fit
myresid <- x - fit$fitted[,'xhat']
bitmap(file='test1.png')
op <- par(mfrow=c(2,1))
plot(fit,ylab='Observed (black) / Fitted (red)',main='Interpolation Fit of Exponential Smoothing')
plot(myresid,ylab='Residuals',main='Interpolation Prediction Errors')
par(op)
dev.off()
bitmap(file='test2.png')
p <- predict(fit, par4, prediction.interval=TRUE)
np <- length(p[,1])
plot(fit,p,ylab='Observed (black) / Fitted (red)',main='Extrapolation Fit of Exponential Smoothing')
dev.off()
bitmap(file='test3.png')
op <- par(mfrow = c(2,2))
acf(as.numeric(myresid),lag.max = nx/2,main='Residual ACF')
spectrum(myresid,main='Residals Periodogram')
cpgram(myresid,main='Residal Cumulative Periodogram')
qqnorm(myresid,main='Residual Normal QQ Plot')
qqline(myresid)
par(op)
dev.off()
load(file='createtable')
a<-table.start()
a<-table.row.start(a)
a<-table.element(a,'Estimated Parameters of Exponential Smoothing',2,TRUE)
a<-table.row.end(a)
a<-table.row.start(a)
a<-table.element(a,'Parameter',header=TRUE)
a<-table.element(a,'Value',header=TRUE)
a<-table.row.end(a)
a<-table.row.start(a)
a<-table.element(a,'alpha',header=TRUE)
a<-table.element(a,fit$alpha)
a<-table.row.end(a)
a<-table.row.start(a)
a<-table.element(a,'beta',header=TRUE)
a<-table.element(a,fit$beta)
a<-table.row.end(a)
a<-table.row.start(a)
a<-table.element(a,'gamma',header=TRUE)
a<-table.element(a,fit$gamma)
a<-table.row.end(a)
a<-table.end(a)
table.save(a,file='mytable.tab')
a<-table.start()
a<-table.row.start(a)
a<-table.element(a,'Interpolation Forecasts of Exponential Smoothing',4,TRUE)
a<-table.row.end(a)
a<-table.row.start(a)
a<-table.element(a,'t',header=TRUE)
a<-table.element(a,'Observed',header=TRUE)
a<-table.element(a,'Fitted',header=TRUE)
a<-table.element(a,'Residuals',header=TRUE)
a<-table.row.end(a)
for (i in 1:nxmK) {
a<-table.row.start(a)
a<-table.element(a,i+K,header=TRUE)
a<-table.element(a,x[i+K])
a<-table.element(a,fit$fitted[i,'xhat'])
a<-table.element(a,myresid[i])
a<-table.row.end(a)
}
a<-table.end(a)
table.save(a,file='mytable1.tab')
a<-table.start()
a<-table.row.start(a)
a<-table.element(a,'Extrapolation Forecasts of Exponential Smoothing',4,TRUE)
a<-table.row.end(a)
a<-table.row.start(a)
a<-table.element(a,'t',header=TRUE)
a<-table.element(a,'Forecast',header=TRUE)
a<-table.element(a,'95% Lower Bound',header=TRUE)
a<-table.element(a,'95% Upper Bound',header=TRUE)
a<-table.row.end(a)
for (i in 1:np) {
a<-table.row.start(a)
a<-table.element(a,nx+i,header=TRUE)
a<-table.element(a,p[i,'fit'])
a<-table.element(a,p[i,'lwr'])
a<-table.element(a,p[i,'upr'])
a<-table.row.end(a)
}
a<-table.end(a)
table.save(a,file='mytable2.tab')