Free Statistics

of Irreproducible Research!

Author's title

Author*Unverified author*
R Software Modulerwasp_structuraltimeseries.wasp
Title produced by softwareStructural Time Series Models
Date of computationMon, 19 Dec 2016 15:25:39 +0100
Cite this page as followsStatistical Computations at FreeStatistics.org, Office for Research Development and Education, URL https://freestatistics.org/blog/index.php?v=date/2016/Dec/19/t1482157716pc2aq1pra4vo9rc.htm/, Retrieved Fri, 01 Nov 2024 03:39:44 +0000
Statistical Computations at FreeStatistics.org, Office for Research Development and Education, URL https://freestatistics.org/blog/index.php?pk=301368, Retrieved Fri, 01 Nov 2024 03:39:44 +0000
QR Codes:

Original text written by user:
IsPrivate?No (this computation is public)
User-defined keywords
Estimated Impact95
Family? (F = Feedback message, R = changed R code, M = changed R Module, P = changed Parameters, D = changed Data)
-       [Structural Time Series Models] [Structural Time S...] [2016-12-19 14:25:39] [d41d8cd98f00b204e9800998ecf8427e] [Current]
Feedback Forum

Post a new message
Dataseries X:
3329.04
3170
2555.12
2221.44
3618.64
3504.4
2757.28
2687.6
3709.68
3771.44
2792.56
2930.24
3751.76
3631.92
2789.2
3158.24
4548.96
4191.36
3088.96
3480.16
4703.44
4584.64
3496.16
4215.52
4250.48
4779.6
3626.24
4571.44
5091.04
5398.24
4272.56
5206.56
5318.8
6039.76
4922.24
5694.64
5940.88
4937.92
4710.32
6057.2
5401.6


Summary of computational transaction
Raw Input view raw input (R code)
Raw Outputview raw output of R engine
Computing time3 seconds
R ServerBig Analytics Cloud Computing Center

\begin{tabular}{lllllllll}
\hline
Summary of computational transaction \tabularnewline
Raw Input view raw input (R code)  \tabularnewline
Raw Outputview raw output of R engine  \tabularnewline
Computing time3 seconds \tabularnewline
R ServerBig Analytics Cloud Computing Center \tabularnewline
\hline
\end{tabular}
%Source: https://freestatistics.org/blog/index.php?pk=301368&T=0

[TABLE]
[ROW]
Summary of computational transaction[/C][/ROW] [ROW]Raw Input[/C] view raw input (R code) [/C][/ROW] [ROW]Raw Output[/C]view raw output of R engine [/C][/ROW] [ROW]Computing time[/C]3 seconds[/C][/ROW] [ROW]R Server[/C]Big Analytics Cloud Computing Center[/C][/ROW] [/TABLE] Source: https://freestatistics.org/blog/index.php?pk=301368&T=0

Globally Unique Identifier (entire table): ba.freestatistics.org/blog/index.php?pk=301368&T=0

As an alternative you can also use a QR Code:  

The GUIDs for individual cells are displayed in the table below:

Summary of computational transaction
Raw Input view raw input (R code)
Raw Outputview raw output of R engine
Computing time3 seconds
R ServerBig Analytics Cloud Computing Center


Structural Time Series Model -- Interpolation
tObservedLevelSlopeSeasonalStand. Residuals
13329.043329.04000
231703207.8479374221-39.3547150391507-31.630686468661-0.153463327824524
32555.122889.66845413137-111.514231404545-255.468651042102-1.04340105759395
42221.442585.57329868229-157.462179421419-257.996032281887-1.12272770298407
53618.642707.05447508298-86.3372722049523702.8647418714792.03187125627798
63504.42974.268505545130.907749974069461317.662769472882.21099809168144
72757.283034.0083952824115.2870984196354-311.123928681590.364129876657335
82687.63087.6479753889824.8412883534318-422.7705658531050.239245390365535
93709.683157.2113307412136.2289537463822526.6167859010690.275321462792798
103771.443309.3902312940165.5433978476379395.1524888105070.712469926810037
112792.563305.7968329346348.122523322178-473.372880672289-0.424800754351398
122930.243358.9951914069249.4027965104124-431.6755894414140.0311331827010582
133751.763359.5785112351637.0814603336335420.123392814556-0.298595256480817
143631.923317.6413764301817.1474039510814359.579231205597-0.483832206303482
152789.23292.98824889046.60366873567198-479.815001789566-0.256023193007986
163158.243383.4182904949827.7485029887216-273.2451797491880.513356474392139
174548.963668.0908296159592.550763956468733.6150210212191.57304107866289
184191.363826.61738233021109.191762456759326.9242562719740.403977213800857
193088.963847.6710122224286.960140048995-708.190276145819-0.539673186523364
203480.163908.1053237964680.2693817332913-412.740774327307-0.162418737893414
214703.443983.4515640336879.0276100803621722.810300111171-0.0301442675150803
224584.644114.0098969617992.0253203711874441.0934548637880.315521847591354
233496.164208.4132901363592.625148523267-713.6163487526560.0145607953801838
244215.524423.40284554418123.48945534539-278.0195389302060.74923134271947
254250.484205.7387902365637.4394666107642240.283043769728-2.08886617813225
264779.64231.5702279851934.5115447396528554.683244051969-0.0710753992833326
273626.244289.5149747525140.4221588935206-676.7063586927450.143480219362783
284571.444456.9752561736872.465294861158241.64933509450110.777847724749705
295091.044666.68285279603107.082256751933345.6929461743330.840327291150996
305398.244835.33133548709122.611256629781527.6202879262520.376966732307136
314272.564999.10022842535132.992547644749-750.1308570158020.252006000403545
325206.565181.45369135637145.442971629031-3.186254700619130.3022342457886
335318.85220.88160270421118.702534353043158.683835938311-0.649124527689888
346039.765396.56723050093133.075518992095610.5313470730120.348904427147006
354922.245592.60696508883148.957136612779-706.4566313640550.385526515253582
365694.645719.83924609946143.477423320386-12.7470495494523-0.13302012606378
375940.885845.70172963011139.03436411188105.274755941016-0.10785533143602
384937.925388.78133188718-11.2847583425371-109.273525038917-3.64899904161466
394710.325289.05984924864-33.5913689103867-528.049916709575-0.541493319041613
406057.25490.7663779430225.7583934237869431.5661826843041.44071640576735
415401.65354.5469406282-15.0976696998917139.895092715885-0.991781568789819

\begin{tabular}{lllllllll}
\hline
Structural Time Series Model -- Interpolation \tabularnewline
t & Observed & Level & Slope & Seasonal & Stand. Residuals \tabularnewline
1 & 3329.04 & 3329.04 & 0 & 0 & 0 \tabularnewline
2 & 3170 & 3207.8479374221 & -39.3547150391507 & -31.630686468661 & -0.153463327824524 \tabularnewline
3 & 2555.12 & 2889.66845413137 & -111.514231404545 & -255.468651042102 & -1.04340105759395 \tabularnewline
4 & 2221.44 & 2585.57329868229 & -157.462179421419 & -257.996032281887 & -1.12272770298407 \tabularnewline
5 & 3618.64 & 2707.05447508298 & -86.3372722049523 & 702.864741871479 & 2.03187125627798 \tabularnewline
6 & 3504.4 & 2974.26850554513 & 0.907749974069461 & 317.66276947288 & 2.21099809168144 \tabularnewline
7 & 2757.28 & 3034.00839528241 & 15.2870984196354 & -311.12392868159 & 0.364129876657335 \tabularnewline
8 & 2687.6 & 3087.64797538898 & 24.8412883534318 & -422.770565853105 & 0.239245390365535 \tabularnewline
9 & 3709.68 & 3157.21133074121 & 36.2289537463822 & 526.616785901069 & 0.275321462792798 \tabularnewline
10 & 3771.44 & 3309.39023129401 & 65.5433978476379 & 395.152488810507 & 0.712469926810037 \tabularnewline
11 & 2792.56 & 3305.79683293463 & 48.122523322178 & -473.372880672289 & -0.424800754351398 \tabularnewline
12 & 2930.24 & 3358.99519140692 & 49.4027965104124 & -431.675589441414 & 0.0311331827010582 \tabularnewline
13 & 3751.76 & 3359.57851123516 & 37.0814603336335 & 420.123392814556 & -0.298595256480817 \tabularnewline
14 & 3631.92 & 3317.64137643018 & 17.1474039510814 & 359.579231205597 & -0.483832206303482 \tabularnewline
15 & 2789.2 & 3292.9882488904 & 6.60366873567198 & -479.815001789566 & -0.256023193007986 \tabularnewline
16 & 3158.24 & 3383.41829049498 & 27.7485029887216 & -273.245179749188 & 0.513356474392139 \tabularnewline
17 & 4548.96 & 3668.09082961595 & 92.550763956468 & 733.615021021219 & 1.57304107866289 \tabularnewline
18 & 4191.36 & 3826.61738233021 & 109.191762456759 & 326.924256271974 & 0.403977213800857 \tabularnewline
19 & 3088.96 & 3847.67101222242 & 86.960140048995 & -708.190276145819 & -0.539673186523364 \tabularnewline
20 & 3480.16 & 3908.10532379646 & 80.2693817332913 & -412.740774327307 & -0.162418737893414 \tabularnewline
21 & 4703.44 & 3983.45156403368 & 79.0276100803621 & 722.810300111171 & -0.0301442675150803 \tabularnewline
22 & 4584.64 & 4114.00989696179 & 92.0253203711874 & 441.093454863788 & 0.315521847591354 \tabularnewline
23 & 3496.16 & 4208.41329013635 & 92.625148523267 & -713.616348752656 & 0.0145607953801838 \tabularnewline
24 & 4215.52 & 4423.40284554418 & 123.48945534539 & -278.019538930206 & 0.74923134271947 \tabularnewline
25 & 4250.48 & 4205.73879023656 & 37.4394666107642 & 240.283043769728 & -2.08886617813225 \tabularnewline
26 & 4779.6 & 4231.57022798519 & 34.5115447396528 & 554.683244051969 & -0.0710753992833326 \tabularnewline
27 & 3626.24 & 4289.51497475251 & 40.4221588935206 & -676.706358692745 & 0.143480219362783 \tabularnewline
28 & 4571.44 & 4456.97525617368 & 72.4652948611582 & 41.6493350945011 & 0.777847724749705 \tabularnewline
29 & 5091.04 & 4666.68285279603 & 107.082256751933 & 345.692946174333 & 0.840327291150996 \tabularnewline
30 & 5398.24 & 4835.33133548709 & 122.611256629781 & 527.620287926252 & 0.376966732307136 \tabularnewline
31 & 4272.56 & 4999.10022842535 & 132.992547644749 & -750.130857015802 & 0.252006000403545 \tabularnewline
32 & 5206.56 & 5181.45369135637 & 145.442971629031 & -3.18625470061913 & 0.3022342457886 \tabularnewline
33 & 5318.8 & 5220.88160270421 & 118.702534353043 & 158.683835938311 & -0.649124527689888 \tabularnewline
34 & 6039.76 & 5396.56723050093 & 133.075518992095 & 610.531347073012 & 0.348904427147006 \tabularnewline
35 & 4922.24 & 5592.60696508883 & 148.957136612779 & -706.456631364055 & 0.385526515253582 \tabularnewline
36 & 5694.64 & 5719.83924609946 & 143.477423320386 & -12.7470495494523 & -0.13302012606378 \tabularnewline
37 & 5940.88 & 5845.70172963011 & 139.03436411188 & 105.274755941016 & -0.10785533143602 \tabularnewline
38 & 4937.92 & 5388.78133188718 & -11.2847583425371 & -109.273525038917 & -3.64899904161466 \tabularnewline
39 & 4710.32 & 5289.05984924864 & -33.5913689103867 & -528.049916709575 & -0.541493319041613 \tabularnewline
40 & 6057.2 & 5490.76637794302 & 25.7583934237869 & 431.566182684304 & 1.44071640576735 \tabularnewline
41 & 5401.6 & 5354.5469406282 & -15.0976696998917 & 139.895092715885 & -0.991781568789819 \tabularnewline
\hline
\end{tabular}
%Source: https://freestatistics.org/blog/index.php?pk=301368&T=1

[TABLE]
[ROW][C]Structural Time Series Model -- Interpolation[/C][/ROW]
[ROW][C]t[/C][C]Observed[/C][C]Level[/C][C]Slope[/C][C]Seasonal[/C][C]Stand. Residuals[/C][/ROW]
[ROW][C]1[/C][C]3329.04[/C][C]3329.04[/C][C]0[/C][C]0[/C][C]0[/C][/ROW]
[ROW][C]2[/C][C]3170[/C][C]3207.8479374221[/C][C]-39.3547150391507[/C][C]-31.630686468661[/C][C]-0.153463327824524[/C][/ROW]
[ROW][C]3[/C][C]2555.12[/C][C]2889.66845413137[/C][C]-111.514231404545[/C][C]-255.468651042102[/C][C]-1.04340105759395[/C][/ROW]
[ROW][C]4[/C][C]2221.44[/C][C]2585.57329868229[/C][C]-157.462179421419[/C][C]-257.996032281887[/C][C]-1.12272770298407[/C][/ROW]
[ROW][C]5[/C][C]3618.64[/C][C]2707.05447508298[/C][C]-86.3372722049523[/C][C]702.864741871479[/C][C]2.03187125627798[/C][/ROW]
[ROW][C]6[/C][C]3504.4[/C][C]2974.26850554513[/C][C]0.907749974069461[/C][C]317.66276947288[/C][C]2.21099809168144[/C][/ROW]
[ROW][C]7[/C][C]2757.28[/C][C]3034.00839528241[/C][C]15.2870984196354[/C][C]-311.12392868159[/C][C]0.364129876657335[/C][/ROW]
[ROW][C]8[/C][C]2687.6[/C][C]3087.64797538898[/C][C]24.8412883534318[/C][C]-422.770565853105[/C][C]0.239245390365535[/C][/ROW]
[ROW][C]9[/C][C]3709.68[/C][C]3157.21133074121[/C][C]36.2289537463822[/C][C]526.616785901069[/C][C]0.275321462792798[/C][/ROW]
[ROW][C]10[/C][C]3771.44[/C][C]3309.39023129401[/C][C]65.5433978476379[/C][C]395.152488810507[/C][C]0.712469926810037[/C][/ROW]
[ROW][C]11[/C][C]2792.56[/C][C]3305.79683293463[/C][C]48.122523322178[/C][C]-473.372880672289[/C][C]-0.424800754351398[/C][/ROW]
[ROW][C]12[/C][C]2930.24[/C][C]3358.99519140692[/C][C]49.4027965104124[/C][C]-431.675589441414[/C][C]0.0311331827010582[/C][/ROW]
[ROW][C]13[/C][C]3751.76[/C][C]3359.57851123516[/C][C]37.0814603336335[/C][C]420.123392814556[/C][C]-0.298595256480817[/C][/ROW]
[ROW][C]14[/C][C]3631.92[/C][C]3317.64137643018[/C][C]17.1474039510814[/C][C]359.579231205597[/C][C]-0.483832206303482[/C][/ROW]
[ROW][C]15[/C][C]2789.2[/C][C]3292.9882488904[/C][C]6.60366873567198[/C][C]-479.815001789566[/C][C]-0.256023193007986[/C][/ROW]
[ROW][C]16[/C][C]3158.24[/C][C]3383.41829049498[/C][C]27.7485029887216[/C][C]-273.245179749188[/C][C]0.513356474392139[/C][/ROW]
[ROW][C]17[/C][C]4548.96[/C][C]3668.09082961595[/C][C]92.550763956468[/C][C]733.615021021219[/C][C]1.57304107866289[/C][/ROW]
[ROW][C]18[/C][C]4191.36[/C][C]3826.61738233021[/C][C]109.191762456759[/C][C]326.924256271974[/C][C]0.403977213800857[/C][/ROW]
[ROW][C]19[/C][C]3088.96[/C][C]3847.67101222242[/C][C]86.960140048995[/C][C]-708.190276145819[/C][C]-0.539673186523364[/C][/ROW]
[ROW][C]20[/C][C]3480.16[/C][C]3908.10532379646[/C][C]80.2693817332913[/C][C]-412.740774327307[/C][C]-0.162418737893414[/C][/ROW]
[ROW][C]21[/C][C]4703.44[/C][C]3983.45156403368[/C][C]79.0276100803621[/C][C]722.810300111171[/C][C]-0.0301442675150803[/C][/ROW]
[ROW][C]22[/C][C]4584.64[/C][C]4114.00989696179[/C][C]92.0253203711874[/C][C]441.093454863788[/C][C]0.315521847591354[/C][/ROW]
[ROW][C]23[/C][C]3496.16[/C][C]4208.41329013635[/C][C]92.625148523267[/C][C]-713.616348752656[/C][C]0.0145607953801838[/C][/ROW]
[ROW][C]24[/C][C]4215.52[/C][C]4423.40284554418[/C][C]123.48945534539[/C][C]-278.019538930206[/C][C]0.74923134271947[/C][/ROW]
[ROW][C]25[/C][C]4250.48[/C][C]4205.73879023656[/C][C]37.4394666107642[/C][C]240.283043769728[/C][C]-2.08886617813225[/C][/ROW]
[ROW][C]26[/C][C]4779.6[/C][C]4231.57022798519[/C][C]34.5115447396528[/C][C]554.683244051969[/C][C]-0.0710753992833326[/C][/ROW]
[ROW][C]27[/C][C]3626.24[/C][C]4289.51497475251[/C][C]40.4221588935206[/C][C]-676.706358692745[/C][C]0.143480219362783[/C][/ROW]
[ROW][C]28[/C][C]4571.44[/C][C]4456.97525617368[/C][C]72.4652948611582[/C][C]41.6493350945011[/C][C]0.777847724749705[/C][/ROW]
[ROW][C]29[/C][C]5091.04[/C][C]4666.68285279603[/C][C]107.082256751933[/C][C]345.692946174333[/C][C]0.840327291150996[/C][/ROW]
[ROW][C]30[/C][C]5398.24[/C][C]4835.33133548709[/C][C]122.611256629781[/C][C]527.620287926252[/C][C]0.376966732307136[/C][/ROW]
[ROW][C]31[/C][C]4272.56[/C][C]4999.10022842535[/C][C]132.992547644749[/C][C]-750.130857015802[/C][C]0.252006000403545[/C][/ROW]
[ROW][C]32[/C][C]5206.56[/C][C]5181.45369135637[/C][C]145.442971629031[/C][C]-3.18625470061913[/C][C]0.3022342457886[/C][/ROW]
[ROW][C]33[/C][C]5318.8[/C][C]5220.88160270421[/C][C]118.702534353043[/C][C]158.683835938311[/C][C]-0.649124527689888[/C][/ROW]
[ROW][C]34[/C][C]6039.76[/C][C]5396.56723050093[/C][C]133.075518992095[/C][C]610.531347073012[/C][C]0.348904427147006[/C][/ROW]
[ROW][C]35[/C][C]4922.24[/C][C]5592.60696508883[/C][C]148.957136612779[/C][C]-706.456631364055[/C][C]0.385526515253582[/C][/ROW]
[ROW][C]36[/C][C]5694.64[/C][C]5719.83924609946[/C][C]143.477423320386[/C][C]-12.7470495494523[/C][C]-0.13302012606378[/C][/ROW]
[ROW][C]37[/C][C]5940.88[/C][C]5845.70172963011[/C][C]139.03436411188[/C][C]105.274755941016[/C][C]-0.10785533143602[/C][/ROW]
[ROW][C]38[/C][C]4937.92[/C][C]5388.78133188718[/C][C]-11.2847583425371[/C][C]-109.273525038917[/C][C]-3.64899904161466[/C][/ROW]
[ROW][C]39[/C][C]4710.32[/C][C]5289.05984924864[/C][C]-33.5913689103867[/C][C]-528.049916709575[/C][C]-0.541493319041613[/C][/ROW]
[ROW][C]40[/C][C]6057.2[/C][C]5490.76637794302[/C][C]25.7583934237869[/C][C]431.566182684304[/C][C]1.44071640576735[/C][/ROW]
[ROW][C]41[/C][C]5401.6[/C][C]5354.5469406282[/C][C]-15.0976696998917[/C][C]139.895092715885[/C][C]-0.991781568789819[/C][/ROW]
[/TABLE]
Source: https://freestatistics.org/blog/index.php?pk=301368&T=1

Globally Unique Identifier (entire table): ba.freestatistics.org/blog/index.php?pk=301368&T=1

As an alternative you can also use a QR Code:  

The GUIDs for individual cells are displayed in the table below:

Structural Time Series Model -- Interpolation
tObservedLevelSlopeSeasonalStand. Residuals
13329.043329.04000
231703207.8479374221-39.3547150391507-31.630686468661-0.153463327824524
32555.122889.66845413137-111.514231404545-255.468651042102-1.04340105759395
42221.442585.57329868229-157.462179421419-257.996032281887-1.12272770298407
53618.642707.05447508298-86.3372722049523702.8647418714792.03187125627798
63504.42974.268505545130.907749974069461317.662769472882.21099809168144
72757.283034.0083952824115.2870984196354-311.123928681590.364129876657335
82687.63087.6479753889824.8412883534318-422.7705658531050.239245390365535
93709.683157.2113307412136.2289537463822526.6167859010690.275321462792798
103771.443309.3902312940165.5433978476379395.1524888105070.712469926810037
112792.563305.7968329346348.122523322178-473.372880672289-0.424800754351398
122930.243358.9951914069249.4027965104124-431.6755894414140.0311331827010582
133751.763359.5785112351637.0814603336335420.123392814556-0.298595256480817
143631.923317.6413764301817.1474039510814359.579231205597-0.483832206303482
152789.23292.98824889046.60366873567198-479.815001789566-0.256023193007986
163158.243383.4182904949827.7485029887216-273.2451797491880.513356474392139
174548.963668.0908296159592.550763956468733.6150210212191.57304107866289
184191.363826.61738233021109.191762456759326.9242562719740.403977213800857
193088.963847.6710122224286.960140048995-708.190276145819-0.539673186523364
203480.163908.1053237964680.2693817332913-412.740774327307-0.162418737893414
214703.443983.4515640336879.0276100803621722.810300111171-0.0301442675150803
224584.644114.0098969617992.0253203711874441.0934548637880.315521847591354
233496.164208.4132901363592.625148523267-713.6163487526560.0145607953801838
244215.524423.40284554418123.48945534539-278.0195389302060.74923134271947
254250.484205.7387902365637.4394666107642240.283043769728-2.08886617813225
264779.64231.5702279851934.5115447396528554.683244051969-0.0710753992833326
273626.244289.5149747525140.4221588935206-676.7063586927450.143480219362783
284571.444456.9752561736872.465294861158241.64933509450110.777847724749705
295091.044666.68285279603107.082256751933345.6929461743330.840327291150996
305398.244835.33133548709122.611256629781527.6202879262520.376966732307136
314272.564999.10022842535132.992547644749-750.1308570158020.252006000403545
325206.565181.45369135637145.442971629031-3.186254700619130.3022342457886
335318.85220.88160270421118.702534353043158.683835938311-0.649124527689888
346039.765396.56723050093133.075518992095610.5313470730120.348904427147006
354922.245592.60696508883148.957136612779-706.4566313640550.385526515253582
365694.645719.83924609946143.477423320386-12.7470495494523-0.13302012606378
375940.885845.70172963011139.03436411188105.274755941016-0.10785533143602
384937.925388.78133188718-11.2847583425371-109.273525038917-3.64899904161466
394710.325289.05984924864-33.5913689103867-528.049916709575-0.541493319041613
406057.25490.7663779430225.7583934237869431.5661826843041.44071640576735
415401.65354.5469406282-15.0976696998917139.895092715885-0.991781568789819


Structural Time Series Model -- Extrapolation
tObservedLevelSeasonal
15302.061689089915339.45588552513-37.3941964352186
24705.434058926345324.3540663683-618.920007441963
35825.688534221085309.25224721147516.436287009611
45434.028344922215294.15042805464139.877916867571
55241.65441246265279.04860889781-37.3941964352186
64645.026782299025263.94678974098-618.920007441963
75765.281257593775248.84497058416516.436287009611
85373.62106829495233.74315142733139.877916867571
95181.247135835285218.6413322705-37.3941964352186
104584.619505671715203.53951311367-618.920007441963
115704.873980966455188.43769395684516.436287009611
125313.213791667585173.33587480001139.877916867571

\begin{tabular}{lllllllll}
\hline
Structural Time Series Model -- Extrapolation \tabularnewline
t & Observed & Level & Seasonal \tabularnewline
1 & 5302.06168908991 & 5339.45588552513 & -37.3941964352186 \tabularnewline
2 & 4705.43405892634 & 5324.3540663683 & -618.920007441963 \tabularnewline
3 & 5825.68853422108 & 5309.25224721147 & 516.436287009611 \tabularnewline
4 & 5434.02834492221 & 5294.15042805464 & 139.877916867571 \tabularnewline
5 & 5241.6544124626 & 5279.04860889781 & -37.3941964352186 \tabularnewline
6 & 4645.02678229902 & 5263.94678974098 & -618.920007441963 \tabularnewline
7 & 5765.28125759377 & 5248.84497058416 & 516.436287009611 \tabularnewline
8 & 5373.6210682949 & 5233.74315142733 & 139.877916867571 \tabularnewline
9 & 5181.24713583528 & 5218.6413322705 & -37.3941964352186 \tabularnewline
10 & 4584.61950567171 & 5203.53951311367 & -618.920007441963 \tabularnewline
11 & 5704.87398096645 & 5188.43769395684 & 516.436287009611 \tabularnewline
12 & 5313.21379166758 & 5173.33587480001 & 139.877916867571 \tabularnewline
\hline
\end{tabular}
%Source: https://freestatistics.org/blog/index.php?pk=301368&T=2

[TABLE]
[ROW][C]Structural Time Series Model -- Extrapolation[/C][/ROW]
[ROW][C]t[/C][C]Observed[/C][C]Level[/C][C]Seasonal[/C][/ROW]
[ROW][C]1[/C][C]5302.06168908991[/C][C]5339.45588552513[/C][C]-37.3941964352186[/C][/ROW]
[ROW][C]2[/C][C]4705.43405892634[/C][C]5324.3540663683[/C][C]-618.920007441963[/C][/ROW]
[ROW][C]3[/C][C]5825.68853422108[/C][C]5309.25224721147[/C][C]516.436287009611[/C][/ROW]
[ROW][C]4[/C][C]5434.02834492221[/C][C]5294.15042805464[/C][C]139.877916867571[/C][/ROW]
[ROW][C]5[/C][C]5241.6544124626[/C][C]5279.04860889781[/C][C]-37.3941964352186[/C][/ROW]
[ROW][C]6[/C][C]4645.02678229902[/C][C]5263.94678974098[/C][C]-618.920007441963[/C][/ROW]
[ROW][C]7[/C][C]5765.28125759377[/C][C]5248.84497058416[/C][C]516.436287009611[/C][/ROW]
[ROW][C]8[/C][C]5373.6210682949[/C][C]5233.74315142733[/C][C]139.877916867571[/C][/ROW]
[ROW][C]9[/C][C]5181.24713583528[/C][C]5218.6413322705[/C][C]-37.3941964352186[/C][/ROW]
[ROW][C]10[/C][C]4584.61950567171[/C][C]5203.53951311367[/C][C]-618.920007441963[/C][/ROW]
[ROW][C]11[/C][C]5704.87398096645[/C][C]5188.43769395684[/C][C]516.436287009611[/C][/ROW]
[ROW][C]12[/C][C]5313.21379166758[/C][C]5173.33587480001[/C][C]139.877916867571[/C][/ROW]
[/TABLE]
Source: https://freestatistics.org/blog/index.php?pk=301368&T=2

Globally Unique Identifier (entire table): ba.freestatistics.org/blog/index.php?pk=301368&T=2

As an alternative you can also use a QR Code:  

The GUIDs for individual cells are displayed in the table below:

Structural Time Series Model -- Extrapolation
tObservedLevelSeasonal
15302.061689089915339.45588552513-37.3941964352186
24705.434058926345324.3540663683-618.920007441963
35825.688534221085309.25224721147516.436287009611
45434.028344922215294.15042805464139.877916867571
55241.65441246265279.04860889781-37.3941964352186
64645.026782299025263.94678974098-618.920007441963
75765.281257593775248.84497058416516.436287009611
85373.62106829495233.74315142733139.877916867571
95181.247135835285218.6413322705-37.3941964352186
104584.619505671715203.53951311367-618.920007441963
115704.873980966455188.43769395684516.436287009611
125313.213791667585173.33587480001139.877916867571


Parameters (Session):
par4 = 12 ;
Parameters (R input):
par1 = 4 ; par2 = 12 ; par3 = BFGS ;
R code (references can be found in the software module):
par3 <- 'BFGS'
par2 <- '12'
par1 <- '4'
require('stsm')
require('stsm.class')
require('KFKSDS')
par1 <- as.numeric(par1)
par2 <- as.numeric(par2)
nx <- length(x)
x <- ts(x,frequency=par1)
m <- StructTS(x,type='BSM')
print(m$coef)
print(m$fitted)
print(m$resid)
mylevel <- as.numeric(m$fitted[,'level'])
myslope <- as.numeric(m$fitted[,'slope'])
myseas <- as.numeric(m$fitted[,'sea'])
myresid <- as.numeric(m$resid)
myfit <- mylevel+myseas
mm <- stsm.model(model = 'BSM', y = x, transPars = 'StructTS')
fit2 <- stsmFit(mm, stsm.method = 'maxlik.td.optim', method = par3, KF.args = list(P0cov = TRUE))
(fit2.comps <- tsSmooth(fit2, P0cov = FALSE)$states)
m2 <- set.pars(mm, pmax(fit2$par, .Machine$double.eps))
(ss <- char2numeric(m2))
(pred <- predict(ss, x, n.ahead = par2))
mylagmax <- nx/2
bitmap(file='test2.png')
op <- par(mfrow = c(2,2))
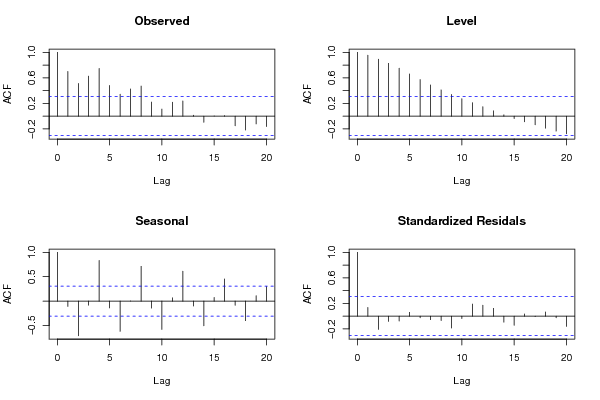
acf(as.numeric(x),lag.max = mylagmax,main='Observed')
acf(mylevel,na.action=na.pass,lag.max = mylagmax,main='Level')
acf(myseas,na.action=na.pass,lag.max = mylagmax,main='Seasonal')
acf(myresid,na.action=na.pass,lag.max = mylagmax,main='Standardized Residals')
par(op)
dev.off()
bitmap(file='test3.png')
op <- par(mfrow = c(2,2))
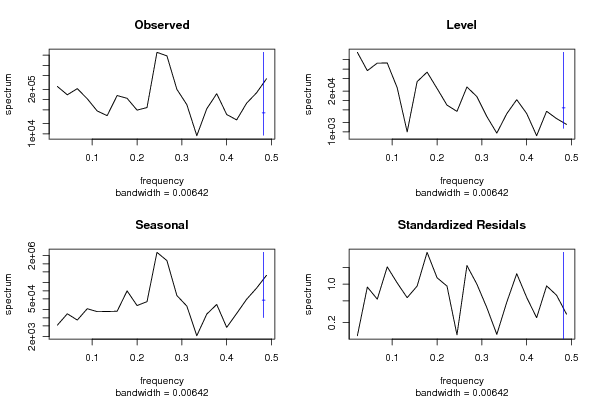
spectrum(as.numeric(x),main='Observed')
spectrum(mylevel,main='Level')
spectrum(myseas,main='Seasonal')
spectrum(myresid,main='Standardized Residals')
par(op)
dev.off()
bitmap(file='test4.png')
op <- par(mfrow = c(2,2))
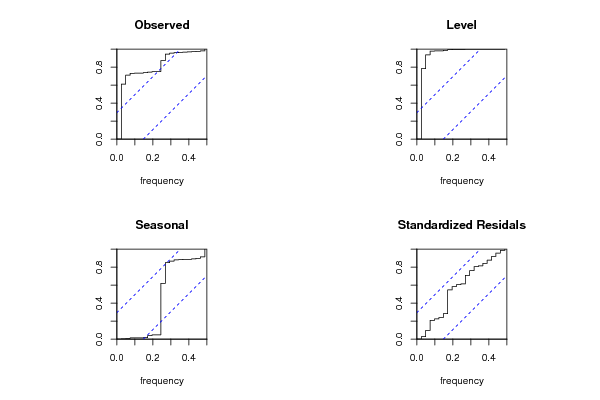
cpgram(as.numeric(x),main='Observed')
cpgram(mylevel,main='Level')
cpgram(myseas,main='Seasonal')
cpgram(myresid,main='Standardized Residals')
par(op)
dev.off()
bitmap(file='test1.png')
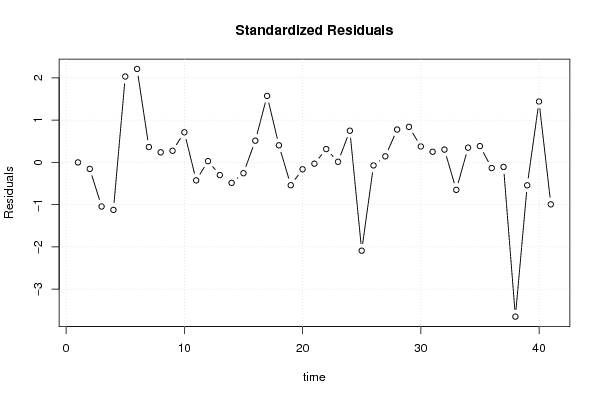
plot(as.numeric(m$resid),main='Standardized Residuals',ylab='Residuals',xlab='time',type='b')
grid()
dev.off()
bitmap(file='test5.png')
op <- par(mfrow = c(2,2))
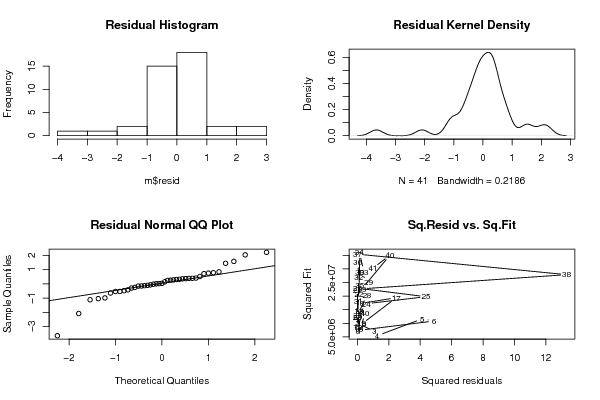
hist(m$resid,main='Residual Histogram')
plot(density(m$resid),main='Residual Kernel Density')
qqnorm(m$resid,main='Residual Normal QQ Plot')
qqline(m$resid)
plot(m$resid^2, myfit^2,main='Sq.Resid vs. Sq.Fit',xlab='Squared residuals',ylab='Squared Fit')
par(op)
dev.off()
bitmap(file='test6.png')
par(mfrow = c(3,1), mar = c(3,3,3,3))
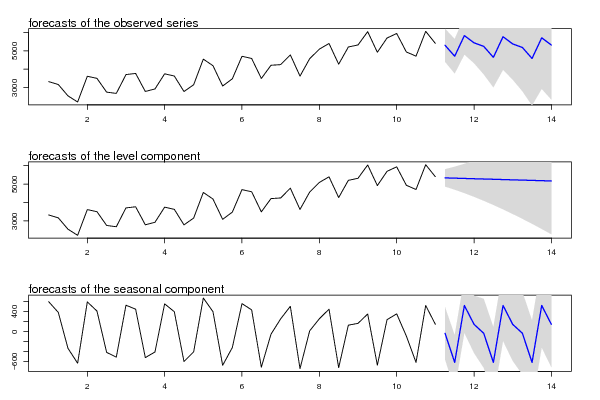
plot(cbind(x, pred$pred), type = 'n', plot.type = 'single', ylab = '')
lines(x)
polygon(c(time(pred$pred), rev(time(pred$pred))), c(pred$pred + 2 * pred$se, rev(pred$pred)), col = 'gray85', border = NA)
polygon(c(time(pred$pred), rev(time(pred$pred))), c(pred$pred - 2 * pred$se, rev(pred$pred)), col = ' gray85', border = NA)
lines(pred$pred, col = 'blue', lwd = 1.5)
mtext(text = 'forecasts of the observed series', side = 3, adj = 0)
plot(cbind(x, pred$a[,1]), type = 'n', plot.type = 'single', ylab = '')
lines(x)
polygon(c(time(pred$a[,1]), rev(time(pred$a[,1]))), c(pred$a[,1] + 2 * sqrt(pred$P[,1]), rev(pred$a[,1])), col = 'gray85', border = NA)
polygon(c(time(pred$a[,1]), rev(time(pred$a[,1]))), c(pred$a[,1] - 2 * sqrt(pred$P[,1]), rev(pred$a[,1])), col = ' gray85', border = NA)
lines(pred$a[,1], col = 'blue', lwd = 1.5)
mtext(text = 'forecasts of the level component', side = 3, adj = 0)
plot(cbind(fit2.comps[,3], pred$a[,3]), type = 'n', plot.type = 'single', ylab = '')
lines(fit2.comps[,3])
polygon(c(time(pred$a[,3]), rev(time(pred$a[,3]))), c(pred$a[,3] + 2 * sqrt(pred$P[,3]), rev(pred$a[,3])), col = 'gray85', border = NA)
polygon(c(time(pred$a[,3]), rev(time(pred$a[,3]))), c(pred$a[,3] - 2 * sqrt(pred$P[,3]), rev(pred$a[,3])), col = ' gray85', border = NA)
lines(pred$a[,3], col = 'blue', lwd = 1.5)
mtext(text = 'forecasts of the seasonal component', side = 3, adj = 0)
dev.off()
load(file='createtable')
a<-table.start()
a<-table.row.start(a)
a<-table.element(a,'Structural Time Series Model -- Interpolation',6,TRUE)
a<-table.row.end(a)
a<-table.row.start(a)
a<-table.element(a,'t',header=TRUE)
a<-table.element(a,'Observed',header=TRUE)
a<-table.element(a,'Level',header=TRUE)
a<-table.element(a,'Slope',header=TRUE)
a<-table.element(a,'Seasonal',header=TRUE)
a<-table.element(a,'Stand. Residuals',header=TRUE)
a<-table.row.end(a)
for (i in 1:nx) {
a<-table.row.start(a)
a<-table.element(a,i,header=TRUE)
a<-table.element(a,x[i])
a<-table.element(a,mylevel[i])
a<-table.element(a,myslope[i])
a<-table.element(a,myseas[i])
a<-table.element(a,myresid[i])
a<-table.row.end(a)
}
a<-table.end(a)
table.save(a,file='mytable.tab')
a<-table.start()
a<-table.row.start(a)
a<-table.element(a,'Structural Time Series Model -- Extrapolation',4,TRUE)
a<-table.row.end(a)
a<-table.row.start(a)
a<-table.element(a,'t',header=TRUE)
a<-table.element(a,'Observed',header=TRUE)
a<-table.element(a,'Level',header=TRUE)
a<-table.element(a,'Seasonal',header=TRUE)
a<-table.row.end(a)
for (i in 1:par2) {
a<-table.row.start(a)
a<-table.element(a,i,header=TRUE)
a<-table.element(a,pred$pred[i])
a<-table.element(a,pred$a[i,1])
a<-table.element(a,pred$a[i,3])
a<-table.row.end(a)
}
a<-table.end(a)
table.save(a,file='mytable1.tab')