Free Statistics

of Irreproducible Research!

Author's title

Author*The author of this computation has been verified*
R Software Modulerwasp_autocorrelation.wasp
Title produced by software(Partial) Autocorrelation Function
Date of computationMon, 19 Dec 2016 15:16:38 +0100
Cite this page as followsStatistical Computations at FreeStatistics.org, Office for Research Development and Education, URL https://freestatistics.org/blog/index.php?v=date/2016/Dec/19/t1482157069cx6mrfoj5y14tw3.htm/, Retrieved Fri, 01 Nov 2024 03:33:46 +0000
Statistical Computations at FreeStatistics.org, Office for Research Development and Education, URL https://freestatistics.org/blog/index.php?pk=301364, Retrieved Fri, 01 Nov 2024 03:33:46 +0000
QR Codes:

Original text written by user:
IsPrivate?No (this computation is public)
User-defined keywords
Estimated Impact107
Family? (F = Feedback message, R = changed R code, M = changed R Module, P = changed Parameters, D = changed Data)
-       [(Partial) Autocorrelation Function] [auto 0 1] [2016-12-19 14:16:38] [06fd994a2f2098873ec640c3e39346e5] [Current]
Feedback Forum

Post a new message
Dataseries X:
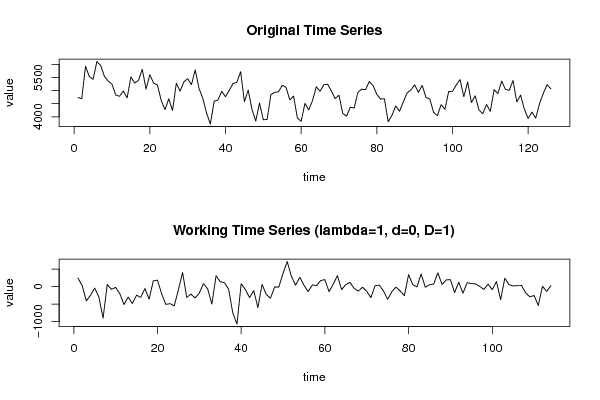
4738.4
4687.2
5930.8
5532
5429.8
6107.4
5960.8
5541.8
5362.2
5237
4827
4781.6
4983.2
4718.4
5523.8
5286.6
5389
5810.4
5057.4
5604.4
5285
5215.2
4625.4
4270.4
4685.4
4233.8
5278.4
4978.8
5333.4
5451
5224
5790.2
5079.4
4705.8
4139.6
3720.8
4594
4638.8
4969.4
4764.4
5010.8
5267.8
5312.2
5723.2
4579.6
5015.2
4282.4
3834.2
4523.4
3884.2
3897.8
4845.6
4929
4955.4
5198.4
5122.2
4643.2
4789.8
3950.8
3824.4
4511.8
4262.4
4616.6
5139.6
4972.8
5222
5242
4979.8
4691.8
4821.6
4123.6
4027.4
4365.2
4333.6
4930
5053
5031.4
5342
5191.4
4852.2
4675.6
4689.2
3809.4
4054.2
4409.6
4210.2
4566.4
4907
5021.8
5215.2
4933.6
5197.8
4734.6
4681.8
4172
4037.8
4462.6
4282.6
4962.4
4969.2
5214.6
5416.8
4764.2
5326.2
4545.4
4797.2
4259
4117
4469.2
4203.2
5033.8
4883
5361.6
5044.6
5005.6
5382
4565.4
4825
4290.2
3933.6
4177.6
3949.4
4492.6
4894.2
5224.4
5071
NA
NA
NA
NA
NA
NA
NA
NA
NA
NA
NA
NA
NA
NA
NA
NA
NA
NA


Summary of computational transaction
Raw Input view raw input (R code)
Raw Outputview raw output of R engine
Computing time1 seconds
R ServerBig Analytics Cloud Computing Center

\begin{tabular}{lllllllll}
\hline
Summary of computational transaction \tabularnewline
Raw Input view raw input (R code)  \tabularnewline
Raw Outputview raw output of R engine  \tabularnewline
Computing time1 seconds \tabularnewline
R ServerBig Analytics Cloud Computing Center \tabularnewline
\hline
\end{tabular}
%Source: https://freestatistics.org/blog/index.php?pk=301364&T=0

[TABLE]
[ROW]
Summary of computational transaction[/C][/ROW] [ROW]Raw Input[/C] view raw input (R code) [/C][/ROW] [ROW]Raw Output[/C]view raw output of R engine [/C][/ROW] [ROW]Computing time[/C]1 seconds[/C][/ROW] [ROW]R Server[/C]Big Analytics Cloud Computing Center[/C][/ROW] [/TABLE] Source: https://freestatistics.org/blog/index.php?pk=301364&T=0

Globally Unique Identifier (entire table): ba.freestatistics.org/blog/index.php?pk=301364&T=0

As an alternative you can also use a QR Code:  

The GUIDs for individual cells are displayed in the table below:

Summary of computational transaction
Raw Input view raw input (R code)
Raw Outputview raw output of R engine
Computing time1 seconds
R ServerBig Analytics Cloud Computing Center


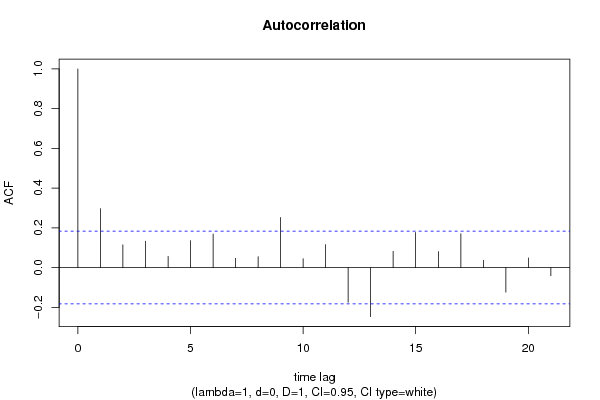
Autocorrelation Function
Time lag kACF(k)T-STATP-value
10.2968473.16950.000981
20.1143271.22070.112362
30.1319941.40930.080733
40.0560690.59870.275297
50.1354111.44580.075489
60.1681591.79540.037616
70.0461980.49330.311389
80.0541930.57860.281991
90.2521822.69260.00408
100.0440190.470.319629
110.1155171.23340.109984
12-0.174793-1.86630.032286
13-0.24736-2.64110.004712
140.0812930.8680.193618
150.1769261.88910.030713
160.0800560.85480.197238
170.1699741.81480.03609
180.0365760.39050.34844
19-0.123903-1.32290.094254
200.0479670.51210.304769
21-0.041404-0.44210.329637

\begin{tabular}{lllllllll}
\hline
Autocorrelation Function \tabularnewline
Time lag k & ACF(k) & T-STAT & P-value \tabularnewline
1 & 0.296847 & 3.1695 & 0.000981 \tabularnewline
2 & 0.114327 & 1.2207 & 0.112362 \tabularnewline
3 & 0.131994 & 1.4093 & 0.080733 \tabularnewline
4 & 0.056069 & 0.5987 & 0.275297 \tabularnewline
5 & 0.135411 & 1.4458 & 0.075489 \tabularnewline
6 & 0.168159 & 1.7954 & 0.037616 \tabularnewline
7 & 0.046198 & 0.4933 & 0.311389 \tabularnewline
8 & 0.054193 & 0.5786 & 0.281991 \tabularnewline
9 & 0.252182 & 2.6926 & 0.00408 \tabularnewline
10 & 0.044019 & 0.47 & 0.319629 \tabularnewline
11 & 0.115517 & 1.2334 & 0.109984 \tabularnewline
12 & -0.174793 & -1.8663 & 0.032286 \tabularnewline
13 & -0.24736 & -2.6411 & 0.004712 \tabularnewline
14 & 0.081293 & 0.868 & 0.193618 \tabularnewline
15 & 0.176926 & 1.8891 & 0.030713 \tabularnewline
16 & 0.080056 & 0.8548 & 0.197238 \tabularnewline
17 & 0.169974 & 1.8148 & 0.03609 \tabularnewline
18 & 0.036576 & 0.3905 & 0.34844 \tabularnewline
19 & -0.123903 & -1.3229 & 0.094254 \tabularnewline
20 & 0.047967 & 0.5121 & 0.304769 \tabularnewline
21 & -0.041404 & -0.4421 & 0.329637 \tabularnewline
\hline
\end{tabular}
%Source: https://freestatistics.org/blog/index.php?pk=301364&T=1

[TABLE]
[ROW][C]Autocorrelation Function[/C][/ROW]
[ROW][C]Time lag k[/C][C]ACF(k)[/C][C]T-STAT[/C][C]P-value[/C][/ROW]
[ROW][C]1[/C][C]0.296847[/C][C]3.1695[/C][C]0.000981[/C][/ROW]
[ROW][C]2[/C][C]0.114327[/C][C]1.2207[/C][C]0.112362[/C][/ROW]
[ROW][C]3[/C][C]0.131994[/C][C]1.4093[/C][C]0.080733[/C][/ROW]
[ROW][C]4[/C][C]0.056069[/C][C]0.5987[/C][C]0.275297[/C][/ROW]
[ROW][C]5[/C][C]0.135411[/C][C]1.4458[/C][C]0.075489[/C][/ROW]
[ROW][C]6[/C][C]0.168159[/C][C]1.7954[/C][C]0.037616[/C][/ROW]
[ROW][C]7[/C][C]0.046198[/C][C]0.4933[/C][C]0.311389[/C][/ROW]
[ROW][C]8[/C][C]0.054193[/C][C]0.5786[/C][C]0.281991[/C][/ROW]
[ROW][C]9[/C][C]0.252182[/C][C]2.6926[/C][C]0.00408[/C][/ROW]
[ROW][C]10[/C][C]0.044019[/C][C]0.47[/C][C]0.319629[/C][/ROW]
[ROW][C]11[/C][C]0.115517[/C][C]1.2334[/C][C]0.109984[/C][/ROW]
[ROW][C]12[/C][C]-0.174793[/C][C]-1.8663[/C][C]0.032286[/C][/ROW]
[ROW][C]13[/C][C]-0.24736[/C][C]-2.6411[/C][C]0.004712[/C][/ROW]
[ROW][C]14[/C][C]0.081293[/C][C]0.868[/C][C]0.193618[/C][/ROW]
[ROW][C]15[/C][C]0.176926[/C][C]1.8891[/C][C]0.030713[/C][/ROW]
[ROW][C]16[/C][C]0.080056[/C][C]0.8548[/C][C]0.197238[/C][/ROW]
[ROW][C]17[/C][C]0.169974[/C][C]1.8148[/C][C]0.03609[/C][/ROW]
[ROW][C]18[/C][C]0.036576[/C][C]0.3905[/C][C]0.34844[/C][/ROW]
[ROW][C]19[/C][C]-0.123903[/C][C]-1.3229[/C][C]0.094254[/C][/ROW]
[ROW][C]20[/C][C]0.047967[/C][C]0.5121[/C][C]0.304769[/C][/ROW]
[ROW][C]21[/C][C]-0.041404[/C][C]-0.4421[/C][C]0.329637[/C][/ROW]
[/TABLE]
Source: https://freestatistics.org/blog/index.php?pk=301364&T=1

Globally Unique Identifier (entire table): ba.freestatistics.org/blog/index.php?pk=301364&T=1

As an alternative you can also use a QR Code:  

The GUIDs for individual cells are displayed in the table below:

Autocorrelation Function
Time lag kACF(k)T-STATP-value
10.2968473.16950.000981
20.1143271.22070.112362
30.1319941.40930.080733
40.0560690.59870.275297
50.1354111.44580.075489
60.1681591.79540.037616
70.0461980.49330.311389
80.0541930.57860.281991
90.2521822.69260.00408
100.0440190.470.319629
110.1155171.23340.109984
12-0.174793-1.86630.032286
13-0.24736-2.64110.004712
140.0812930.8680.193618
150.1769261.88910.030713
160.0800560.85480.197238
170.1699741.81480.03609
180.0365760.39050.34844
19-0.123903-1.32290.094254
200.0479670.51210.304769
21-0.041404-0.44210.329637


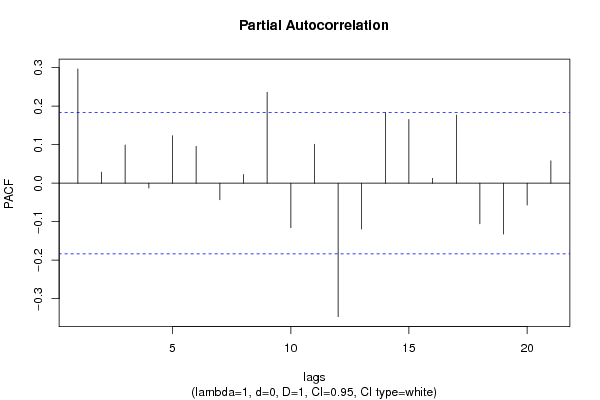
Partial Autocorrelation Function
Time lag kPACF(k)T-STATP-value
10.2968473.16950.000981
20.0287420.30690.379747
30.0993271.06050.145574
4-0.012312-0.13150.447823
50.1233041.31650.095319
60.0958161.0230.15423
7-0.042787-0.45680.324329
80.0224970.24020.405303
90.2361852.52180.006529
10-0.11551-1.23330.109998
110.1014391.08310.140531
12-0.346659-3.70130.000166
13-0.119087-1.27150.10307
140.1838221.96270.026059
150.1656151.76830.039845
160.0125420.13390.446856
170.1769441.88920.0307
18-0.105324-1.12460.13157
19-0.132015-1.40950.080699
20-0.056595-0.60430.273433
210.0580690.620.268245

\begin{tabular}{lllllllll}
\hline
Partial Autocorrelation Function \tabularnewline
Time lag k & PACF(k) & T-STAT & P-value \tabularnewline
1 & 0.296847 & 3.1695 & 0.000981 \tabularnewline
2 & 0.028742 & 0.3069 & 0.379747 \tabularnewline
3 & 0.099327 & 1.0605 & 0.145574 \tabularnewline
4 & -0.012312 & -0.1315 & 0.447823 \tabularnewline
5 & 0.123304 & 1.3165 & 0.095319 \tabularnewline
6 & 0.095816 & 1.023 & 0.15423 \tabularnewline
7 & -0.042787 & -0.4568 & 0.324329 \tabularnewline
8 & 0.022497 & 0.2402 & 0.405303 \tabularnewline
9 & 0.236185 & 2.5218 & 0.006529 \tabularnewline
10 & -0.11551 & -1.2333 & 0.109998 \tabularnewline
11 & 0.101439 & 1.0831 & 0.140531 \tabularnewline
12 & -0.346659 & -3.7013 & 0.000166 \tabularnewline
13 & -0.119087 & -1.2715 & 0.10307 \tabularnewline
14 & 0.183822 & 1.9627 & 0.026059 \tabularnewline
15 & 0.165615 & 1.7683 & 0.039845 \tabularnewline
16 & 0.012542 & 0.1339 & 0.446856 \tabularnewline
17 & 0.176944 & 1.8892 & 0.0307 \tabularnewline
18 & -0.105324 & -1.1246 & 0.13157 \tabularnewline
19 & -0.132015 & -1.4095 & 0.080699 \tabularnewline
20 & -0.056595 & -0.6043 & 0.273433 \tabularnewline
21 & 0.058069 & 0.62 & 0.268245 \tabularnewline
\hline
\end{tabular}
%Source: https://freestatistics.org/blog/index.php?pk=301364&T=2

[TABLE]
[ROW][C]Partial Autocorrelation Function[/C][/ROW]
[ROW][C]Time lag k[/C][C]PACF(k)[/C][C]T-STAT[/C][C]P-value[/C][/ROW]
[ROW][C]1[/C][C]0.296847[/C][C]3.1695[/C][C]0.000981[/C][/ROW]
[ROW][C]2[/C][C]0.028742[/C][C]0.3069[/C][C]0.379747[/C][/ROW]
[ROW][C]3[/C][C]0.099327[/C][C]1.0605[/C][C]0.145574[/C][/ROW]
[ROW][C]4[/C][C]-0.012312[/C][C]-0.1315[/C][C]0.447823[/C][/ROW]
[ROW][C]5[/C][C]0.123304[/C][C]1.3165[/C][C]0.095319[/C][/ROW]
[ROW][C]6[/C][C]0.095816[/C][C]1.023[/C][C]0.15423[/C][/ROW]
[ROW][C]7[/C][C]-0.042787[/C][C]-0.4568[/C][C]0.324329[/C][/ROW]
[ROW][C]8[/C][C]0.022497[/C][C]0.2402[/C][C]0.405303[/C][/ROW]
[ROW][C]9[/C][C]0.236185[/C][C]2.5218[/C][C]0.006529[/C][/ROW]
[ROW][C]10[/C][C]-0.11551[/C][C]-1.2333[/C][C]0.109998[/C][/ROW]
[ROW][C]11[/C][C]0.101439[/C][C]1.0831[/C][C]0.140531[/C][/ROW]
[ROW][C]12[/C][C]-0.346659[/C][C]-3.7013[/C][C]0.000166[/C][/ROW]
[ROW][C]13[/C][C]-0.119087[/C][C]-1.2715[/C][C]0.10307[/C][/ROW]
[ROW][C]14[/C][C]0.183822[/C][C]1.9627[/C][C]0.026059[/C][/ROW]
[ROW][C]15[/C][C]0.165615[/C][C]1.7683[/C][C]0.039845[/C][/ROW]
[ROW][C]16[/C][C]0.012542[/C][C]0.1339[/C][C]0.446856[/C][/ROW]
[ROW][C]17[/C][C]0.176944[/C][C]1.8892[/C][C]0.0307[/C][/ROW]
[ROW][C]18[/C][C]-0.105324[/C][C]-1.1246[/C][C]0.13157[/C][/ROW]
[ROW][C]19[/C][C]-0.132015[/C][C]-1.4095[/C][C]0.080699[/C][/ROW]
[ROW][C]20[/C][C]-0.056595[/C][C]-0.6043[/C][C]0.273433[/C][/ROW]
[ROW][C]21[/C][C]0.058069[/C][C]0.62[/C][C]0.268245[/C][/ROW]
[/TABLE]
Source: https://freestatistics.org/blog/index.php?pk=301364&T=2

Globally Unique Identifier (entire table): ba.freestatistics.org/blog/index.php?pk=301364&T=2

As an alternative you can also use a QR Code:  

The GUIDs for individual cells are displayed in the table below:

Partial Autocorrelation Function
Time lag kPACF(k)T-STATP-value
10.2968473.16950.000981
20.0287420.30690.379747
30.0993271.06050.145574
4-0.012312-0.13150.447823
50.1233041.31650.095319
60.0958161.0230.15423
7-0.042787-0.45680.324329
80.0224970.24020.405303
90.2361852.52180.006529
10-0.11551-1.23330.109998
110.1014391.08310.140531
12-0.346659-3.70130.000166
13-0.119087-1.27150.10307
140.1838221.96270.026059
150.1656151.76830.039845
160.0125420.13390.446856
170.1769441.88920.0307
18-0.105324-1.12460.13157
19-0.132015-1.40950.080699
20-0.056595-0.60430.273433
210.0580690.620.268245


Parameters (Session):
Parameters (R input):
par1 = Default ; par2 = 1 ; par3 = 0 ; par4 = 1 ; par5 = 12 ; par6 = White Noise ; par7 = 0.95 ; par8 = ;
R code (references can be found in the software module):
if (par1 == 'Default') {
par1 = 10*log10(length(x))
} else {
par1 <- as.numeric(par1)
}
par2 <- as.numeric(par2)
par3 <- as.numeric(par3)
par4 <- as.numeric(par4)
par5 <- as.numeric(par5)
if (par6 == 'White Noise') par6 <- 'white' else par6 <- 'ma'
par7 <- as.numeric(par7)
if (par8 != '') par8 <- as.numeric(par8)
x <- na.omit(x)
ox <- x
if (par8 == '') {
if (par2 == 0) {
x <- log(x)
} else {
x <- (x ^ par2 - 1) / par2
}
} else {
x <- log(x,base=par8)
}
if (par3 > 0) x <- diff(x,lag=1,difference=par3)
if (par4 > 0) x <- diff(x,lag=par5,difference=par4)
bitmap(file='picts.png')
op <- par(mfrow=c(2,1))
plot(ox,type='l',main='Original Time Series',xlab='time',ylab='value')
if (par8=='') {
mytitle <- paste('Working Time Series (lambda=',par2,', d=',par3,', D=',par4,')',sep='')
mysub <- paste('(lambda=',par2,', d=',par3,', D=',par4,', CI=', par7, ', CI type=',par6,')',sep='')
} else {
mytitle <- paste('Working Time Series (base=',par8,', d=',par3,', D=',par4,')',sep='')
mysub <- paste('(base=',par8,', d=',par3,', D=',par4,', CI=', par7, ', CI type=',par6,')',sep='')
}
plot(x,type='l', main=mytitle,xlab='time',ylab='value')
par(op)
dev.off()
bitmap(file='pic1.png')
racf <- acf(x, par1, main='Autocorrelation', xlab='time lag', ylab='ACF', ci.type=par6, ci=par7, sub=mysub)
dev.off()
bitmap(file='pic2.png')
rpacf <- pacf(x,par1,main='Partial Autocorrelation',xlab='lags',ylab='PACF',sub=mysub)
dev.off()
(myacf <- c(racf$acf))
(mypacf <- c(rpacf$acf))
lengthx <- length(x)
sqrtn <- sqrt(lengthx)
load(file='createtable')
a<-table.start()
a<-table.row.start(a)
a<-table.element(a,'Autocorrelation Function',4,TRUE)
a<-table.row.end(a)
a<-table.row.start(a)
a<-table.element(a,'Time lag k',header=TRUE)
a<-table.element(a,'ACF(k)',header=TRUE)
a<-table.element(a,'T-STAT',header=TRUE)
a<-table.element(a,'P-value',header=TRUE)
a<-table.row.end(a)
for (i in 2:(par1+1)) {
a<-table.row.start(a)
a<-table.element(a,i-1,header=TRUE)
a<-table.element(a,round(myacf[i],6))
mytstat <- myacf[i]*sqrtn
a<-table.element(a,round(mytstat,4))
a<-table.element(a,round(1-pt(abs(mytstat),lengthx),6))
a<-table.row.end(a)
}
a<-table.end(a)
table.save(a,file='mytable.tab')
a<-table.start()
a<-table.row.start(a)
a<-table.element(a,'Partial Autocorrelation Function',4,TRUE)
a<-table.row.end(a)
a<-table.row.start(a)
a<-table.element(a,'Time lag k',header=TRUE)
a<-table.element(a,'PACF(k)',header=TRUE)
a<-table.element(a,'T-STAT',header=TRUE)
a<-table.element(a,'P-value',header=TRUE)
a<-table.row.end(a)
for (i in 1:par1) {
a<-table.row.start(a)
a<-table.element(a,i,header=TRUE)
a<-table.element(a,round(mypacf[i],6))
mytstat <- mypacf[i]*sqrtn
a<-table.element(a,round(mytstat,4))
a<-table.element(a,round(1-pt(abs(mytstat),lengthx),6))
a<-table.row.end(a)
}
a<-table.end(a)
table.save(a,file='mytable1.tab')