Free Statistics

of Irreproducible Research!

Author's title

Author*The author of this computation has been verified*
R Software Modulerwasp_smp.wasp
Title produced by softwareStandard Deviation-Mean Plot
Date of computationMon, 19 Dec 2016 13:15:19 +0100
Cite this page as followsStatistical Computations at FreeStatistics.org, Office for Research Development and Education, URL https://freestatistics.org/blog/index.php?v=date/2016/Dec/19/t14821497554n5g74e9zz2yugx.htm/, Retrieved Fri, 01 Nov 2024 03:26:58 +0000
Statistical Computations at FreeStatistics.org, Office for Research Development and Education, URL https://freestatistics.org/blog/index.php?pk=301321, Retrieved Fri, 01 Nov 2024 03:26:58 +0000
QR Codes:

Original text written by user:
IsPrivate?No (this computation is public)
User-defined keywords
Estimated Impact122
Family? (F = Feedback message, R = changed R code, M = changed R Module, P = changed Parameters, D = changed Data)
-       [Standard Deviation-Mean Plot] [standard deviatio...] [2016-12-19 12:15:19] [1e2c9196efc58119c3757b6c78ac7c5f] [Current]
Feedback Forum

Post a new message
Dataseries X:
3647
1885
4791
3178
2849
4716
3085
2799
3573
2721
3355
5667
2856
1944
4188
2949
3567
4137
3494
2489
3244
2669
2529
3377
3366
2073
4133
4213
3710
5123
3141
3084
3804
3203
2757
2243
5229
2857
3395
4882
7140
8945
6866
4205
3217
3079
2263
4187
2665
2073
3540
3686
2384
4500
1679
868
1869
3710
6904
3415
938
3359
3551
2278
3033
2280
2901
4812
4882
7896
5048
3741
4418
3471
5055
7595
8124
2333
3008
2744
2833
2428
4269
3207
5170
7767
4544
3741
2193
3432
5282
6635
4222
7317
4132
5048
4383
3761
4081
6491
5859
7139
7682
8649
6146
7137
9948
15819
8370
13222
16711
19059
8303
20781
9638
13444
6072
13442
14457
17705
16463
19194
20688
14739
12702
15760


Summary of computational transaction
Raw Input view raw input (R code)
Raw Outputview raw output of R engine
Computing time1 seconds
R ServerBig Analytics Cloud Computing Center

\begin{tabular}{lllllllll}
\hline
Summary of computational transaction \tabularnewline
Raw Input view raw input (R code)  \tabularnewline
Raw Outputview raw output of R engine  \tabularnewline
Computing time1 seconds \tabularnewline
R ServerBig Analytics Cloud Computing Center \tabularnewline
\hline
\end{tabular}
%Source: https://freestatistics.org/blog/index.php?pk=301321&T=0

[TABLE]
[ROW]
Summary of computational transaction[/C][/ROW] [ROW]Raw Input[/C] view raw input (R code) [/C][/ROW] [ROW]Raw Output[/C]view raw output of R engine [/C][/ROW] [ROW]Computing time[/C]1 seconds[/C][/ROW] [ROW]R Server[/C]Big Analytics Cloud Computing Center[/C][/ROW] [/TABLE] Source: https://freestatistics.org/blog/index.php?pk=301321&T=0

Globally Unique Identifier (entire table): ba.freestatistics.org/blog/index.php?pk=301321&T=0

As an alternative you can also use a QR Code:  

The GUIDs for individual cells are displayed in the table below:

Summary of computational transaction
Raw Input view raw input (R code)
Raw Outputview raw output of R engine
Computing time1 seconds
R ServerBig Analytics Cloud Computing Center


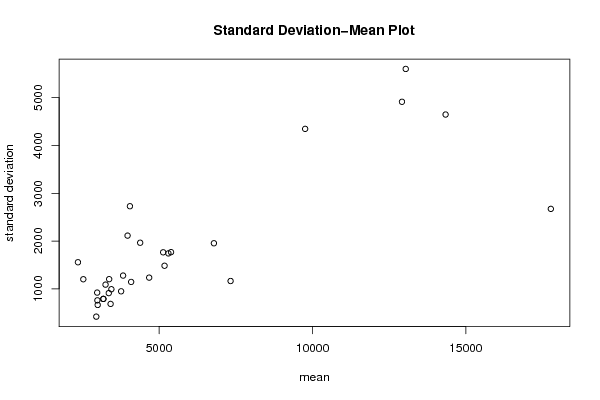
Standard Deviation-Mean Plot
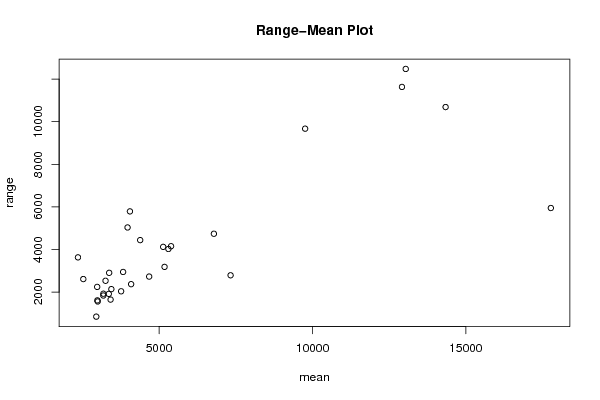
SectionMeanStandard DeviationRange
13375.251202.490297951162906
23362.25911.0767896652111917
338291277.513209325052946
42984.25921.7419649771842244
53421.75685.0602771532831648
62954.75418.280906409397848
73446.25991.9319113057442140
83764.5948.7403930124052039
93001.75663.2522772922331561
104090.751144.246003561592372
1167891954.014841294714740
123186.5788.7414024888011924
132991760.1372683053151613
142357.751556.703862867523632
153974.52113.299237369545035
162531.51201.060781143072613
173256.51087.729286173722532
185391.751767.696500156824155
195134.751764.557050178134124
204052.252728.671517423825791
213184.25790.0402415911061841
225305.51742.114137095124026
234385.51964.703624807914442
245179.751483.268996732113185
2546791234.407820238782730
267332.251163.896723654352790
279762.54346.950080228679673
2814340.54646.9138504316310689
2913041.55600.5672629356612478
30129194913.4569636187211633
31177712673.181999041595949

\begin{tabular}{lllllllll}
\hline
Standard Deviation-Mean Plot \tabularnewline
Section & Mean & Standard Deviation & Range \tabularnewline
1 & 3375.25 & 1202.49029795116 & 2906 \tabularnewline
2 & 3362.25 & 911.076789665211 & 1917 \tabularnewline
3 & 3829 & 1277.51320932505 & 2946 \tabularnewline
4 & 2984.25 & 921.741964977184 & 2244 \tabularnewline
5 & 3421.75 & 685.060277153283 & 1648 \tabularnewline
6 & 2954.75 & 418.280906409397 & 848 \tabularnewline
7 & 3446.25 & 991.931911305744 & 2140 \tabularnewline
8 & 3764.5 & 948.740393012405 & 2039 \tabularnewline
9 & 3001.75 & 663.252277292233 & 1561 \tabularnewline
10 & 4090.75 & 1144.24600356159 & 2372 \tabularnewline
11 & 6789 & 1954.01484129471 & 4740 \tabularnewline
12 & 3186.5 & 788.741402488801 & 1924 \tabularnewline
13 & 2991 & 760.137268305315 & 1613 \tabularnewline
14 & 2357.75 & 1556.70386286752 & 3632 \tabularnewline
15 & 3974.5 & 2113.29923736954 & 5035 \tabularnewline
16 & 2531.5 & 1201.06078114307 & 2613 \tabularnewline
17 & 3256.5 & 1087.72928617372 & 2532 \tabularnewline
18 & 5391.75 & 1767.69650015682 & 4155 \tabularnewline
19 & 5134.75 & 1764.55705017813 & 4124 \tabularnewline
20 & 4052.25 & 2728.67151742382 & 5791 \tabularnewline
21 & 3184.25 & 790.040241591106 & 1841 \tabularnewline
22 & 5305.5 & 1742.11413709512 & 4026 \tabularnewline
23 & 4385.5 & 1964.70362480791 & 4442 \tabularnewline
24 & 5179.75 & 1483.26899673211 & 3185 \tabularnewline
25 & 4679 & 1234.40782023878 & 2730 \tabularnewline
26 & 7332.25 & 1163.89672365435 & 2790 \tabularnewline
27 & 9762.5 & 4346.95008022867 & 9673 \tabularnewline
28 & 14340.5 & 4646.91385043163 & 10689 \tabularnewline
29 & 13041.5 & 5600.56726293566 & 12478 \tabularnewline
30 & 12919 & 4913.45696361872 & 11633 \tabularnewline
31 & 17771 & 2673.18199904159 & 5949 \tabularnewline
\hline
\end{tabular}
%Source: https://freestatistics.org/blog/index.php?pk=301321&T=1

[TABLE]
[ROW][C]Standard Deviation-Mean Plot[/C][/ROW]
[ROW][C]Section[/C][C]Mean[/C][C]Standard Deviation[/C][C]Range[/C][/ROW]
[ROW][C]1[/C][C]3375.25[/C][C]1202.49029795116[/C][C]2906[/C][/ROW]
[ROW][C]2[/C][C]3362.25[/C][C]911.076789665211[/C][C]1917[/C][/ROW]
[ROW][C]3[/C][C]3829[/C][C]1277.51320932505[/C][C]2946[/C][/ROW]
[ROW][C]4[/C][C]2984.25[/C][C]921.741964977184[/C][C]2244[/C][/ROW]
[ROW][C]5[/C][C]3421.75[/C][C]685.060277153283[/C][C]1648[/C][/ROW]
[ROW][C]6[/C][C]2954.75[/C][C]418.280906409397[/C][C]848[/C][/ROW]
[ROW][C]7[/C][C]3446.25[/C][C]991.931911305744[/C][C]2140[/C][/ROW]
[ROW][C]8[/C][C]3764.5[/C][C]948.740393012405[/C][C]2039[/C][/ROW]
[ROW][C]9[/C][C]3001.75[/C][C]663.252277292233[/C][C]1561[/C][/ROW]
[ROW][C]10[/C][C]4090.75[/C][C]1144.24600356159[/C][C]2372[/C][/ROW]
[ROW][C]11[/C][C]6789[/C][C]1954.01484129471[/C][C]4740[/C][/ROW]
[ROW][C]12[/C][C]3186.5[/C][C]788.741402488801[/C][C]1924[/C][/ROW]
[ROW][C]13[/C][C]2991[/C][C]760.137268305315[/C][C]1613[/C][/ROW]
[ROW][C]14[/C][C]2357.75[/C][C]1556.70386286752[/C][C]3632[/C][/ROW]
[ROW][C]15[/C][C]3974.5[/C][C]2113.29923736954[/C][C]5035[/C][/ROW]
[ROW][C]16[/C][C]2531.5[/C][C]1201.06078114307[/C][C]2613[/C][/ROW]
[ROW][C]17[/C][C]3256.5[/C][C]1087.72928617372[/C][C]2532[/C][/ROW]
[ROW][C]18[/C][C]5391.75[/C][C]1767.69650015682[/C][C]4155[/C][/ROW]
[ROW][C]19[/C][C]5134.75[/C][C]1764.55705017813[/C][C]4124[/C][/ROW]
[ROW][C]20[/C][C]4052.25[/C][C]2728.67151742382[/C][C]5791[/C][/ROW]
[ROW][C]21[/C][C]3184.25[/C][C]790.040241591106[/C][C]1841[/C][/ROW]
[ROW][C]22[/C][C]5305.5[/C][C]1742.11413709512[/C][C]4026[/C][/ROW]
[ROW][C]23[/C][C]4385.5[/C][C]1964.70362480791[/C][C]4442[/C][/ROW]
[ROW][C]24[/C][C]5179.75[/C][C]1483.26899673211[/C][C]3185[/C][/ROW]
[ROW][C]25[/C][C]4679[/C][C]1234.40782023878[/C][C]2730[/C][/ROW]
[ROW][C]26[/C][C]7332.25[/C][C]1163.89672365435[/C][C]2790[/C][/ROW]
[ROW][C]27[/C][C]9762.5[/C][C]4346.95008022867[/C][C]9673[/C][/ROW]
[ROW][C]28[/C][C]14340.5[/C][C]4646.91385043163[/C][C]10689[/C][/ROW]
[ROW][C]29[/C][C]13041.5[/C][C]5600.56726293566[/C][C]12478[/C][/ROW]
[ROW][C]30[/C][C]12919[/C][C]4913.45696361872[/C][C]11633[/C][/ROW]
[ROW][C]31[/C][C]17771[/C][C]2673.18199904159[/C][C]5949[/C][/ROW]
[/TABLE]
Source: https://freestatistics.org/blog/index.php?pk=301321&T=1

Globally Unique Identifier (entire table): ba.freestatistics.org/blog/index.php?pk=301321&T=1

As an alternative you can also use a QR Code:  

The GUIDs for individual cells are displayed in the table below:

Standard Deviation-Mean Plot
SectionMeanStandard DeviationRange
13375.251202.490297951162906
23362.25911.0767896652111917
338291277.513209325052946
42984.25921.7419649771842244
53421.75685.0602771532831648
62954.75418.280906409397848
73446.25991.9319113057442140
83764.5948.7403930124052039
93001.75663.2522772922331561
104090.751144.246003561592372
1167891954.014841294714740
123186.5788.7414024888011924
132991760.1372683053151613
142357.751556.703862867523632
153974.52113.299237369545035
162531.51201.060781143072613
173256.51087.729286173722532
185391.751767.696500156824155
195134.751764.557050178134124
204052.252728.671517423825791
213184.25790.0402415911061841
225305.51742.114137095124026
234385.51964.703624807914442
245179.751483.268996732113185
2546791234.407820238782730
267332.251163.896723654352790
279762.54346.950080228679673
2814340.54646.9138504316310689
2913041.55600.5672629356612478
30129194913.4569636187211633
31177712673.181999041595949


Regression: S.E.(k) = alpha + beta * Mean(k)
alpha249.243381870882
beta0.277769530799814
S.D.0.0375920881192717
T-STAT7.38904234099768
p-value3.84836833591426e-08

\begin{tabular}{lllllllll}
\hline
Regression: S.E.(k) = alpha + beta * Mean(k) \tabularnewline
alpha & 249.243381870882 \tabularnewline
beta & 0.277769530799814 \tabularnewline
S.D. & 0.0375920881192717 \tabularnewline
T-STAT & 7.38904234099768 \tabularnewline
p-value & 3.84836833591426e-08 \tabularnewline
\hline
\end{tabular}
%Source: https://freestatistics.org/blog/index.php?pk=301321&T=2

[TABLE]
[ROW][C]Regression: S.E.(k) = alpha + beta * Mean(k)[/C][/ROW]
[ROW][C]alpha[/C][C]249.243381870882[/C][/ROW]
[ROW][C]beta[/C][C]0.277769530799814[/C][/ROW]
[ROW][C]S.D.[/C][C]0.0375920881192717[/C][/ROW]
[ROW][C]T-STAT[/C][C]7.38904234099768[/C][/ROW]
[ROW][C]p-value[/C][C]3.84836833591426e-08[/C][/ROW]
[/TABLE]
Source: https://freestatistics.org/blog/index.php?pk=301321&T=2

Globally Unique Identifier (entire table): ba.freestatistics.org/blog/index.php?pk=301321&T=2

As an alternative you can also use a QR Code:  

The GUIDs for individual cells are displayed in the table below:

Regression: S.E.(k) = alpha + beta * Mean(k)
alpha249.243381870882
beta0.277769530799814
S.D.0.0375920881192717
T-STAT7.38904234099768
p-value3.84836833591426e-08


Regression: ln S.E.(k) = alpha + beta * ln Mean(k)
alpha-0.716208461381068
beta0.94568307659901
S.D.0.129449602607105
T-STAT7.30541506156083
p-value4.78740110747504e-08
Lambda0.0543169234009898

\begin{tabular}{lllllllll}
\hline
Regression: ln S.E.(k) = alpha + beta * ln Mean(k) \tabularnewline
alpha & -0.716208461381068 \tabularnewline
beta & 0.94568307659901 \tabularnewline
S.D. & 0.129449602607105 \tabularnewline
T-STAT & 7.30541506156083 \tabularnewline
p-value & 4.78740110747504e-08 \tabularnewline
Lambda & 0.0543169234009898 \tabularnewline
\hline
\end{tabular}
%Source: https://freestatistics.org/blog/index.php?pk=301321&T=3

[TABLE]
[ROW][C]Regression: ln S.E.(k) = alpha + beta * ln Mean(k)[/C][/ROW]
[ROW][C]alpha[/C][C]-0.716208461381068[/C][/ROW]
[ROW][C]beta[/C][C]0.94568307659901[/C][/ROW]
[ROW][C]S.D.[/C][C]0.129449602607105[/C][/ROW]
[ROW][C]T-STAT[/C][C]7.30541506156083[/C][/ROW]
[ROW][C]p-value[/C][C]4.78740110747504e-08[/C][/ROW]
[ROW][C]Lambda[/C][C]0.0543169234009898[/C][/ROW]
[/TABLE]
Source: https://freestatistics.org/blog/index.php?pk=301321&T=3

Globally Unique Identifier (entire table): ba.freestatistics.org/blog/index.php?pk=301321&T=3

As an alternative you can also use a QR Code:  

The GUIDs for individual cells are displayed in the table below:

Regression: ln S.E.(k) = alpha + beta * ln Mean(k)
alpha-0.716208461381068
beta0.94568307659901
S.D.0.129449602607105
T-STAT7.30541506156083
p-value4.78740110747504e-08
Lambda0.0543169234009898


Parameters (Session):
Parameters (R input):
par1 = 4 ;
R code (references can be found in the software module):
par1 <- as.numeric(par1)
(n <- length(x))
(np <- floor(n / par1))
arr <- array(NA,dim=c(par1,np))
j <- 0
k <- 1
for (i in 1:(np*par1))
{
j = j + 1
arr[j,k] <- x[i]
if (j == par1) {
j = 0
k=k+1
}
}
arr
arr.mean <- array(NA,dim=np)
arr.sd <- array(NA,dim=np)
arr.range <- array(NA,dim=np)
for (j in 1:np)
{
arr.mean[j] <- mean(arr[,j],na.rm=TRUE)
arr.sd[j] <- sd(arr[,j],na.rm=TRUE)
arr.range[j] <- max(arr[,j],na.rm=TRUE) - min(arr[,j],na.rm=TRUE)
}
arr.mean
arr.sd
arr.range
(lm1 <- lm(arr.sd~arr.mean))
(lnlm1 <- lm(log(arr.sd)~log(arr.mean)))
(lm2 <- lm(arr.range~arr.mean))
bitmap(file='test1.png')
plot(arr.mean,arr.sd,main='Standard Deviation-Mean Plot',xlab='mean',ylab='standard deviation')
dev.off()
bitmap(file='test2.png')
plot(arr.mean,arr.range,main='Range-Mean Plot',xlab='mean',ylab='range')
dev.off()
load(file='createtable')
a<-table.start()
a<-table.row.start(a)
a<-table.element(a,'Standard Deviation-Mean Plot',4,TRUE)
a<-table.row.end(a)
a<-table.row.start(a)
a<-table.element(a,'Section',header=TRUE)
a<-table.element(a,'Mean',header=TRUE)
a<-table.element(a,'Standard Deviation',header=TRUE)
a<-table.element(a,'Range',header=TRUE)
a<-table.row.end(a)
for (j in 1:np) {
a<-table.row.start(a)
a<-table.element(a,j,header=TRUE)
a<-table.element(a,arr.mean[j])
a<-table.element(a,arr.sd[j] )
a<-table.element(a,arr.range[j] )
a<-table.row.end(a)
}
a<-table.end(a)
table.save(a,file='mytable.tab')
a<-table.start()
a<-table.row.start(a)
a<-table.element(a,'Regression: S.E.(k) = alpha + beta * Mean(k)',2,TRUE)
a<-table.row.end(a)
a<-table.row.start(a)
a<-table.element(a,'alpha',header=TRUE)
a<-table.element(a,lm1$coefficients[[1]])
a<-table.row.end(a)
a<-table.row.start(a)
a<-table.element(a,'beta',header=TRUE)
a<-table.element(a,lm1$coefficients[[2]])
a<-table.row.end(a)
a<-table.row.start(a)
a<-table.element(a,'S.D.',header=TRUE)
a<-table.element(a,summary(lm1)$coefficients[2,2])
a<-table.row.end(a)
a<-table.row.start(a)
a<-table.element(a,'T-STAT',header=TRUE)
a<-table.element(a,summary(lm1)$coefficients[2,3])
a<-table.row.end(a)
a<-table.row.start(a)
a<-table.element(a,'p-value',header=TRUE)
a<-table.element(a,summary(lm1)$coefficients[2,4])
a<-table.row.end(a)
a<-table.end(a)
table.save(a,file='mytable1.tab')
a<-table.start()
a<-table.row.start(a)
a<-table.element(a,'Regression: ln S.E.(k) = alpha + beta * ln Mean(k)',2,TRUE)
a<-table.row.end(a)
a<-table.row.start(a)
a<-table.element(a,'alpha',header=TRUE)
a<-table.element(a,lnlm1$coefficients[[1]])
a<-table.row.end(a)
a<-table.row.start(a)
a<-table.element(a,'beta',header=TRUE)
a<-table.element(a,lnlm1$coefficients[[2]])
a<-table.row.end(a)
a<-table.row.start(a)
a<-table.element(a,'S.D.',header=TRUE)
a<-table.element(a,summary(lnlm1)$coefficients[2,2])
a<-table.row.end(a)
a<-table.row.start(a)
a<-table.element(a,'T-STAT',header=TRUE)
a<-table.element(a,summary(lnlm1)$coefficients[2,3])
a<-table.row.end(a)
a<-table.row.start(a)
a<-table.element(a,'p-value',header=TRUE)
a<-table.element(a,summary(lnlm1)$coefficients[2,4])
a<-table.row.end(a)
a<-table.row.start(a)
a<-table.element(a,'Lambda',header=TRUE)
a<-table.element(a,1-lnlm1$coefficients[[2]])
a<-table.row.end(a)
a<-table.end(a)
table.save(a,file='mytable2.tab')