Free Statistics

of Irreproducible Research!

Author's title

Author*The author of this computation has been verified*
R Software Modulerwasp_structuraltimeseries.wasp
Title produced by softwareStructural Time Series Models
Date of computationMon, 19 Dec 2016 12:51:27 +0100
Cite this page as followsStatistical Computations at FreeStatistics.org, Office for Research Development and Education, URL https://freestatistics.org/blog/index.php?v=date/2016/Dec/19/t14821483247cmaaf31jblkje5.htm/, Retrieved Fri, 01 Nov 2024 03:44:56 +0000
Statistical Computations at FreeStatistics.org, Office for Research Development and Education, URL https://freestatistics.org/blog/index.php?pk=301311, Retrieved Fri, 01 Nov 2024 03:44:56 +0000
QR Codes:

Original text written by user:
IsPrivate?No (this computation is public)
User-defined keywords
Estimated Impact90
Family? (F = Feedback message, R = changed R code, M = changed R Module, P = changed Parameters, D = changed Data)
-       [Structural Time Series Models] [n1150...] [2016-12-19 11:51:27] [b7f10b15eba379294ac5bdad7f2e1205] [Current]
Feedback Forum

Post a new message
Dataseries X:
4194
4439
4466
4523
4504
4749
4783
4812
4825
4935
4938
4957
4966
5081
5094
5110


Summary of computational transaction
Raw Input view raw input (R code)
Raw Outputview raw output of R engine
Computing time2 seconds
R ServerBig Analytics Cloud Computing Center

\begin{tabular}{lllllllll}
\hline
Summary of computational transaction \tabularnewline
Raw Input view raw input (R code)  \tabularnewline
Raw Outputview raw output of R engine  \tabularnewline
Computing time2 seconds \tabularnewline
R ServerBig Analytics Cloud Computing Center \tabularnewline
\hline
\end{tabular}
%Source: https://freestatistics.org/blog/index.php?pk=301311&T=0

[TABLE]
[ROW]
Summary of computational transaction[/C][/ROW] [ROW]Raw Input[/C] view raw input (R code) [/C][/ROW] [ROW]Raw Output[/C]view raw output of R engine [/C][/ROW] [ROW]Computing time[/C]2 seconds[/C][/ROW] [ROW]R Server[/C]Big Analytics Cloud Computing Center[/C][/ROW] [/TABLE] Source: https://freestatistics.org/blog/index.php?pk=301311&T=0

Globally Unique Identifier (entire table): ba.freestatistics.org/blog/index.php?pk=301311&T=0

As an alternative you can also use a QR Code:  

The GUIDs for individual cells are displayed in the table below:

Summary of computational transaction
Raw Input view raw input (R code)
Raw Outputview raw output of R engine
Computing time2 seconds
R ServerBig Analytics Cloud Computing Center


Structural Time Series Model -- Interpolation
tObservedLevelSlopeSeasonalStand. Residuals
141944194000
244394394.9456129050351.729247937459444.0543870949661.69986147958585
344664429.0452039005446.776587360733836.954796099461-0.513053538133186
445234473.9122882305546.199036441119149.0877117694515-0.0553324946067144
545044596.6613334268268.0305492037427-92.66133342681572.10900082993789
647494693.8746511054977.447013420735755.1253488945130.75677202774112
747834760.2214989993573.865906919181422.7785010006452-0.290213129170491
848124805.0908273262164.47743120747936.90917267378613-0.767841767046738
948254907.1758262182576.5680135016821-82.17582621825440.986671552550367
1049354910.8014228779352.966987257050824.1985771220706-1.91911534020815
1149384921.8480148744139.416489971012516.151985125593-1.09900591799549
1249574958.5206553874738.5290043210613-1.52065538747373-0.0721532618952003
1349665013.113052607443.7207725353961-47.11305260740120.421601939754596
1450815047.4313250306640.680521138466933.5686749693435-0.247053208628309
1550945080.5724882640438.242969062666813.4275117359643-0.197942550665263
1651105117.0028707293937.6569077560983-7.00287072939141-0.0476126850998561

\begin{tabular}{lllllllll}
\hline
Structural Time Series Model -- Interpolation \tabularnewline
t & Observed & Level & Slope & Seasonal & Stand. Residuals \tabularnewline
1 & 4194 & 4194 & 0 & 0 & 0 \tabularnewline
2 & 4439 & 4394.94561290503 & 51.7292479374594 & 44.054387094966 & 1.69986147958585 \tabularnewline
3 & 4466 & 4429.04520390054 & 46.7765873607338 & 36.954796099461 & -0.513053538133186 \tabularnewline
4 & 4523 & 4473.91228823055 & 46.1990364411191 & 49.0877117694515 & -0.0553324946067144 \tabularnewline
5 & 4504 & 4596.66133342682 & 68.0305492037427 & -92.6613334268157 & 2.10900082993789 \tabularnewline
6 & 4749 & 4693.87465110549 & 77.4470134207357 & 55.125348894513 & 0.75677202774112 \tabularnewline
7 & 4783 & 4760.22149899935 & 73.8659069191814 & 22.7785010006452 & -0.290213129170491 \tabularnewline
8 & 4812 & 4805.09082732621 & 64.4774312074793 & 6.90917267378613 & -0.767841767046738 \tabularnewline
9 & 4825 & 4907.17582621825 & 76.5680135016821 & -82.1758262182544 & 0.986671552550367 \tabularnewline
10 & 4935 & 4910.80142287793 & 52.9669872570508 & 24.1985771220706 & -1.91911534020815 \tabularnewline
11 & 4938 & 4921.84801487441 & 39.4164899710125 & 16.151985125593 & -1.09900591799549 \tabularnewline
12 & 4957 & 4958.52065538747 & 38.5290043210613 & -1.52065538747373 & -0.0721532618952003 \tabularnewline
13 & 4966 & 5013.1130526074 & 43.7207725353961 & -47.1130526074012 & 0.421601939754596 \tabularnewline
14 & 5081 & 5047.43132503066 & 40.6805211384669 & 33.5686749693435 & -0.247053208628309 \tabularnewline
15 & 5094 & 5080.57248826404 & 38.2429690626668 & 13.4275117359643 & -0.197942550665263 \tabularnewline
16 & 5110 & 5117.00287072939 & 37.6569077560983 & -7.00287072939141 & -0.0476126850998561 \tabularnewline
\hline
\end{tabular}
%Source: https://freestatistics.org/blog/index.php?pk=301311&T=1

[TABLE]
[ROW][C]Structural Time Series Model -- Interpolation[/C][/ROW]
[ROW][C]t[/C][C]Observed[/C][C]Level[/C][C]Slope[/C][C]Seasonal[/C][C]Stand. Residuals[/C][/ROW]
[ROW][C]1[/C][C]4194[/C][C]4194[/C][C]0[/C][C]0[/C][C]0[/C][/ROW]
[ROW][C]2[/C][C]4439[/C][C]4394.94561290503[/C][C]51.7292479374594[/C][C]44.054387094966[/C][C]1.69986147958585[/C][/ROW]
[ROW][C]3[/C][C]4466[/C][C]4429.04520390054[/C][C]46.7765873607338[/C][C]36.954796099461[/C][C]-0.513053538133186[/C][/ROW]
[ROW][C]4[/C][C]4523[/C][C]4473.91228823055[/C][C]46.1990364411191[/C][C]49.0877117694515[/C][C]-0.0553324946067144[/C][/ROW]
[ROW][C]5[/C][C]4504[/C][C]4596.66133342682[/C][C]68.0305492037427[/C][C]-92.6613334268157[/C][C]2.10900082993789[/C][/ROW]
[ROW][C]6[/C][C]4749[/C][C]4693.87465110549[/C][C]77.4470134207357[/C][C]55.125348894513[/C][C]0.75677202774112[/C][/ROW]
[ROW][C]7[/C][C]4783[/C][C]4760.22149899935[/C][C]73.8659069191814[/C][C]22.7785010006452[/C][C]-0.290213129170491[/C][/ROW]
[ROW][C]8[/C][C]4812[/C][C]4805.09082732621[/C][C]64.4774312074793[/C][C]6.90917267378613[/C][C]-0.767841767046738[/C][/ROW]
[ROW][C]9[/C][C]4825[/C][C]4907.17582621825[/C][C]76.5680135016821[/C][C]-82.1758262182544[/C][C]0.986671552550367[/C][/ROW]
[ROW][C]10[/C][C]4935[/C][C]4910.80142287793[/C][C]52.9669872570508[/C][C]24.1985771220706[/C][C]-1.91911534020815[/C][/ROW]
[ROW][C]11[/C][C]4938[/C][C]4921.84801487441[/C][C]39.4164899710125[/C][C]16.151985125593[/C][C]-1.09900591799549[/C][/ROW]
[ROW][C]12[/C][C]4957[/C][C]4958.52065538747[/C][C]38.5290043210613[/C][C]-1.52065538747373[/C][C]-0.0721532618952003[/C][/ROW]
[ROW][C]13[/C][C]4966[/C][C]5013.1130526074[/C][C]43.7207725353961[/C][C]-47.1130526074012[/C][C]0.421601939754596[/C][/ROW]
[ROW][C]14[/C][C]5081[/C][C]5047.43132503066[/C][C]40.6805211384669[/C][C]33.5686749693435[/C][C]-0.247053208628309[/C][/ROW]
[ROW][C]15[/C][C]5094[/C][C]5080.57248826404[/C][C]38.2429690626668[/C][C]13.4275117359643[/C][C]-0.197942550665263[/C][/ROW]
[ROW][C]16[/C][C]5110[/C][C]5117.00287072939[/C][C]37.6569077560983[/C][C]-7.00287072939141[/C][C]-0.0476126850998561[/C][/ROW]
[/TABLE]
Source: https://freestatistics.org/blog/index.php?pk=301311&T=1

Globally Unique Identifier (entire table): ba.freestatistics.org/blog/index.php?pk=301311&T=1

As an alternative you can also use a QR Code:  

The GUIDs for individual cells are displayed in the table below:

Structural Time Series Model -- Interpolation
tObservedLevelSlopeSeasonalStand. Residuals
141944194000
244394394.9456129050351.729247937459444.0543870949661.69986147958585
344664429.0452039005446.776587360733836.954796099461-0.513053538133186
445234473.9122882305546.199036441119149.0877117694515-0.0553324946067144
545044596.6613334268268.0305492037427-92.66133342681572.10900082993789
647494693.8746511054977.447013420735755.1253488945130.75677202774112
747834760.2214989993573.865906919181422.7785010006452-0.290213129170491
848124805.0908273262164.47743120747936.90917267378613-0.767841767046738
948254907.1758262182576.5680135016821-82.17582621825440.986671552550367
1049354910.8014228779352.966987257050824.1985771220706-1.91911534020815
1149384921.8480148744139.416489971012516.151985125593-1.09900591799549
1249574958.5206553874738.5290043210613-1.52065538747373-0.0721532618952003
1349665013.113052607443.7207725353961-47.11305260740120.421601939754596
1450815047.4313250306640.680521138466933.5686749693435-0.247053208628309
1550945080.5724882640438.242969062666813.4275117359643-0.197942550665263
1651105117.0028707293937.6569077560983-7.00287072939141-0.0476126850998561


Structural Time Series Model -- Extrapolation
tObservedLevelSeasonal
15137.40640341835179.28564548796-41.8792420696581
25274.762016585835234.8251362640839.9368803217461
35306.053143499955290.3646270402115.6885164597454
45332.15796310455345.90411781633-13.7461547118334
55359.56436652285401.44360859246-41.8792420696581
65496.919979690335456.9830993685839.9368803217461
75528.211106604455512.5225901447115.6885164597454
85554.3159262095568.06208092083-13.7461547118334
95581.72232962735623.60157169696-41.8792420696581
105719.077942794835679.1410624730839.9368803217461
115750.369069708955734.6805532492115.6885164597454
125776.47388931355790.22004402533-13.7461547118334

\begin{tabular}{lllllllll}
\hline
Structural Time Series Model -- Extrapolation \tabularnewline
t & Observed & Level & Seasonal \tabularnewline
1 & 5137.4064034183 & 5179.28564548796 & -41.8792420696581 \tabularnewline
2 & 5274.76201658583 & 5234.82513626408 & 39.9368803217461 \tabularnewline
3 & 5306.05314349995 & 5290.36462704021 & 15.6885164597454 \tabularnewline
4 & 5332.1579631045 & 5345.90411781633 & -13.7461547118334 \tabularnewline
5 & 5359.5643665228 & 5401.44360859246 & -41.8792420696581 \tabularnewline
6 & 5496.91997969033 & 5456.98309936858 & 39.9368803217461 \tabularnewline
7 & 5528.21110660445 & 5512.52259014471 & 15.6885164597454 \tabularnewline
8 & 5554.315926209 & 5568.06208092083 & -13.7461547118334 \tabularnewline
9 & 5581.7223296273 & 5623.60157169696 & -41.8792420696581 \tabularnewline
10 & 5719.07794279483 & 5679.14106247308 & 39.9368803217461 \tabularnewline
11 & 5750.36906970895 & 5734.68055324921 & 15.6885164597454 \tabularnewline
12 & 5776.4738893135 & 5790.22004402533 & -13.7461547118334 \tabularnewline
\hline
\end{tabular}
%Source: https://freestatistics.org/blog/index.php?pk=301311&T=2

[TABLE]
[ROW][C]Structural Time Series Model -- Extrapolation[/C][/ROW]
[ROW][C]t[/C][C]Observed[/C][C]Level[/C][C]Seasonal[/C][/ROW]
[ROW][C]1[/C][C]5137.4064034183[/C][C]5179.28564548796[/C][C]-41.8792420696581[/C][/ROW]
[ROW][C]2[/C][C]5274.76201658583[/C][C]5234.82513626408[/C][C]39.9368803217461[/C][/ROW]
[ROW][C]3[/C][C]5306.05314349995[/C][C]5290.36462704021[/C][C]15.6885164597454[/C][/ROW]
[ROW][C]4[/C][C]5332.1579631045[/C][C]5345.90411781633[/C][C]-13.7461547118334[/C][/ROW]
[ROW][C]5[/C][C]5359.5643665228[/C][C]5401.44360859246[/C][C]-41.8792420696581[/C][/ROW]
[ROW][C]6[/C][C]5496.91997969033[/C][C]5456.98309936858[/C][C]39.9368803217461[/C][/ROW]
[ROW][C]7[/C][C]5528.21110660445[/C][C]5512.52259014471[/C][C]15.6885164597454[/C][/ROW]
[ROW][C]8[/C][C]5554.315926209[/C][C]5568.06208092083[/C][C]-13.7461547118334[/C][/ROW]
[ROW][C]9[/C][C]5581.7223296273[/C][C]5623.60157169696[/C][C]-41.8792420696581[/C][/ROW]
[ROW][C]10[/C][C]5719.07794279483[/C][C]5679.14106247308[/C][C]39.9368803217461[/C][/ROW]
[ROW][C]11[/C][C]5750.36906970895[/C][C]5734.68055324921[/C][C]15.6885164597454[/C][/ROW]
[ROW][C]12[/C][C]5776.4738893135[/C][C]5790.22004402533[/C][C]-13.7461547118334[/C][/ROW]
[/TABLE]
Source: https://freestatistics.org/blog/index.php?pk=301311&T=2

Globally Unique Identifier (entire table): ba.freestatistics.org/blog/index.php?pk=301311&T=2

As an alternative you can also use a QR Code:  

The GUIDs for individual cells are displayed in the table below:

Structural Time Series Model -- Extrapolation
tObservedLevelSeasonal
15137.40640341835179.28564548796-41.8792420696581
25274.762016585835234.8251362640839.9368803217461
35306.053143499955290.3646270402115.6885164597454
45332.15796310455345.90411781633-13.7461547118334
55359.56436652285401.44360859246-41.8792420696581
65496.919979690335456.9830993685839.9368803217461
75528.211106604455512.5225901447115.6885164597454
85554.3159262095568.06208092083-13.7461547118334
95581.72232962735623.60157169696-41.8792420696581
105719.077942794835679.1410624730839.9368803217461
115750.369069708955734.6805532492115.6885164597454
125776.47388931355790.22004402533-13.7461547118334


Parameters (Session):
par1 = Default ; par2 = 1 ; par3 = 1 ; par4 = 2 ; par5 = 3 ; par6 = White Noise ; par7 = 0.95 ;
Parameters (R input):
par1 = 4 ; par2 = 12 ; par3 = BFGS ;
R code (references can be found in the software module):
require('stsm')
require('stsm.class')
require('KFKSDS')
par1 <- as.numeric(par1)
par2 <- as.numeric(par2)
nx <- length(x)
x <- ts(x,frequency=par1)
m <- StructTS(x,type='BSM')
print(m$coef)
print(m$fitted)
print(m$resid)
mylevel <- as.numeric(m$fitted[,'level'])
myslope <- as.numeric(m$fitted[,'slope'])
myseas <- as.numeric(m$fitted[,'sea'])
myresid <- as.numeric(m$resid)
myfit <- mylevel+myseas
mm <- stsm.model(model = 'BSM', y = x, transPars = 'StructTS')
fit2 <- stsmFit(mm, stsm.method = 'maxlik.td.optim', method = par3, KF.args = list(P0cov = TRUE))
(fit2.comps <- tsSmooth(fit2, P0cov = FALSE)$states)
m2 <- set.pars(mm, pmax(fit2$par, .Machine$double.eps))
(ss <- char2numeric(m2))
(pred <- predict(ss, x, n.ahead = par2))
mylagmax <- nx/2
bitmap(file='test2.png')
op <- par(mfrow = c(2,2))
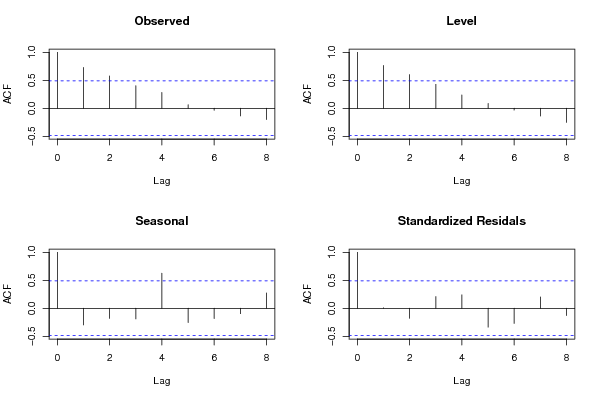
acf(as.numeric(x),lag.max = mylagmax,main='Observed')
acf(mylevel,na.action=na.pass,lag.max = mylagmax,main='Level')
acf(myseas,na.action=na.pass,lag.max = mylagmax,main='Seasonal')
acf(myresid,na.action=na.pass,lag.max = mylagmax,main='Standardized Residals')
par(op)
dev.off()
bitmap(file='test3.png')
op <- par(mfrow = c(2,2))
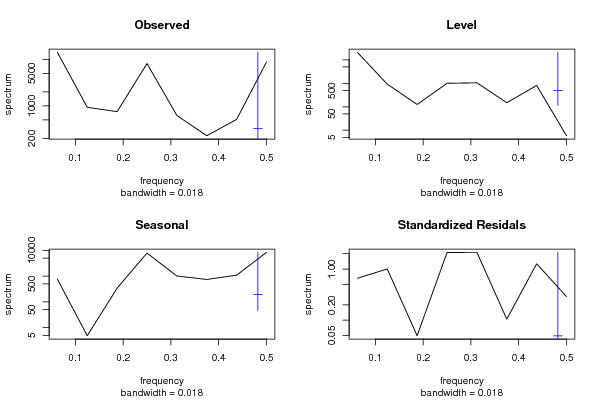
spectrum(as.numeric(x),main='Observed')
spectrum(mylevel,main='Level')
spectrum(myseas,main='Seasonal')
spectrum(myresid,main='Standardized Residals')
par(op)
dev.off()
bitmap(file='test4.png')
op <- par(mfrow = c(2,2))
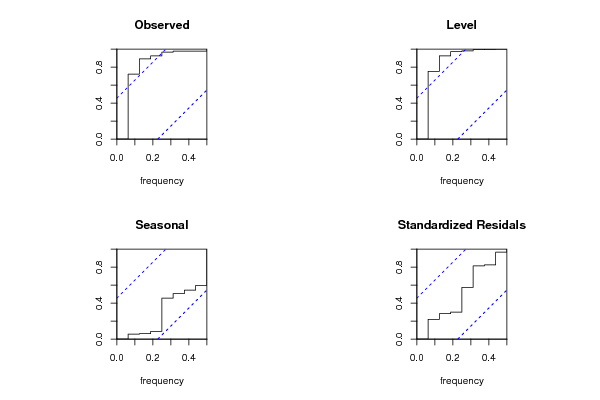
cpgram(as.numeric(x),main='Observed')
cpgram(mylevel,main='Level')
cpgram(myseas,main='Seasonal')
cpgram(myresid,main='Standardized Residals')
par(op)
dev.off()
bitmap(file='test1.png')
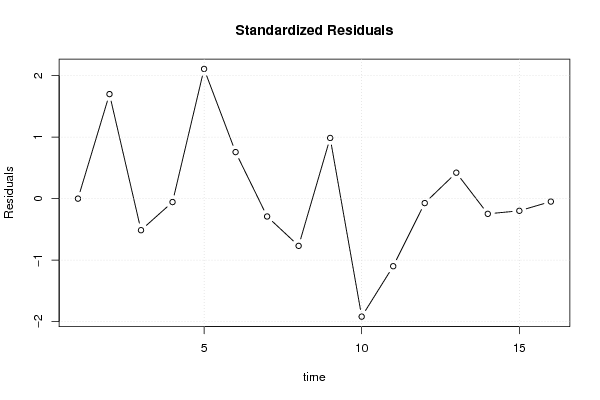
plot(as.numeric(m$resid),main='Standardized Residuals',ylab='Residuals',xlab='time',type='b')
grid()
dev.off()
bitmap(file='test5.png')
op <- par(mfrow = c(2,2))
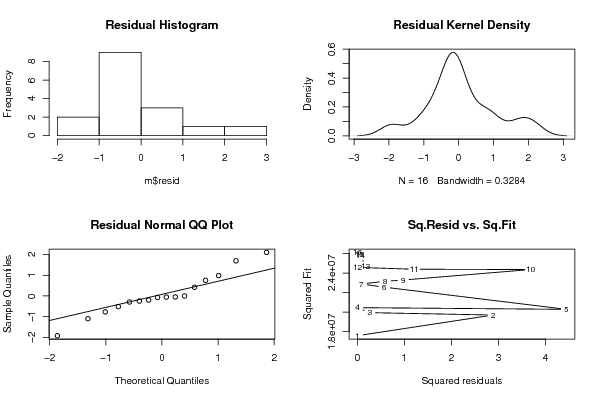
hist(m$resid,main='Residual Histogram')
plot(density(m$resid),main='Residual Kernel Density')
qqnorm(m$resid,main='Residual Normal QQ Plot')
qqline(m$resid)
plot(m$resid^2, myfit^2,main='Sq.Resid vs. Sq.Fit',xlab='Squared residuals',ylab='Squared Fit')
par(op)
dev.off()
bitmap(file='test6.png')
par(mfrow = c(3,1), mar = c(3,3,3,3))
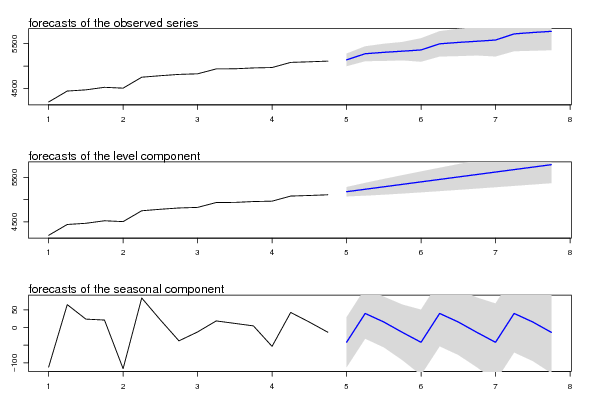
plot(cbind(x, pred$pred), type = 'n', plot.type = 'single', ylab = '')
lines(x)
polygon(c(time(pred$pred), rev(time(pred$pred))), c(pred$pred + 2 * pred$se, rev(pred$pred)), col = 'gray85', border = NA)
polygon(c(time(pred$pred), rev(time(pred$pred))), c(pred$pred - 2 * pred$se, rev(pred$pred)), col = ' gray85', border = NA)
lines(pred$pred, col = 'blue', lwd = 1.5)
mtext(text = 'forecasts of the observed series', side = 3, adj = 0)
plot(cbind(x, pred$a[,1]), type = 'n', plot.type = 'single', ylab = '')
lines(x)
polygon(c(time(pred$a[,1]), rev(time(pred$a[,1]))), c(pred$a[,1] + 2 * sqrt(pred$P[,1]), rev(pred$a[,1])), col = 'gray85', border = NA)
polygon(c(time(pred$a[,1]), rev(time(pred$a[,1]))), c(pred$a[,1] - 2 * sqrt(pred$P[,1]), rev(pred$a[,1])), col = ' gray85', border = NA)
lines(pred$a[,1], col = 'blue', lwd = 1.5)
mtext(text = 'forecasts of the level component', side = 3, adj = 0)
plot(cbind(fit2.comps[,3], pred$a[,3]), type = 'n', plot.type = 'single', ylab = '')
lines(fit2.comps[,3])
polygon(c(time(pred$a[,3]), rev(time(pred$a[,3]))), c(pred$a[,3] + 2 * sqrt(pred$P[,3]), rev(pred$a[,3])), col = 'gray85', border = NA)
polygon(c(time(pred$a[,3]), rev(time(pred$a[,3]))), c(pred$a[,3] - 2 * sqrt(pred$P[,3]), rev(pred$a[,3])), col = ' gray85', border = NA)
lines(pred$a[,3], col = 'blue', lwd = 1.5)
mtext(text = 'forecasts of the seasonal component', side = 3, adj = 0)
dev.off()
load(file='createtable')
a<-table.start()
a<-table.row.start(a)
a<-table.element(a,'Structural Time Series Model -- Interpolation',6,TRUE)
a<-table.row.end(a)
a<-table.row.start(a)
a<-table.element(a,'t',header=TRUE)
a<-table.element(a,'Observed',header=TRUE)
a<-table.element(a,'Level',header=TRUE)
a<-table.element(a,'Slope',header=TRUE)
a<-table.element(a,'Seasonal',header=TRUE)
a<-table.element(a,'Stand. Residuals',header=TRUE)
a<-table.row.end(a)
for (i in 1:nx) {
a<-table.row.start(a)
a<-table.element(a,i,header=TRUE)
a<-table.element(a,x[i])
a<-table.element(a,mylevel[i])
a<-table.element(a,myslope[i])
a<-table.element(a,myseas[i])
a<-table.element(a,myresid[i])
a<-table.row.end(a)
}
a<-table.end(a)
table.save(a,file='mytable.tab')
a<-table.start()
a<-table.row.start(a)
a<-table.element(a,'Structural Time Series Model -- Extrapolation',4,TRUE)
a<-table.row.end(a)
a<-table.row.start(a)
a<-table.element(a,'t',header=TRUE)
a<-table.element(a,'Observed',header=TRUE)
a<-table.element(a,'Level',header=TRUE)
a<-table.element(a,'Seasonal',header=TRUE)
a<-table.row.end(a)
for (i in 1:par2) {
a<-table.row.start(a)
a<-table.element(a,i,header=TRUE)
a<-table.element(a,pred$pred[i])
a<-table.element(a,pred$a[i,1])
a<-table.element(a,pred$a[i,3])
a<-table.row.end(a)
}
a<-table.end(a)
table.save(a,file='mytable1.tab')