Free Statistics

of Irreproducible Research!

Author's title

Author*The author of this computation has been verified*
R Software Modulerwasp_exponentialsmoothing.wasp
Title produced by softwareExponential Smoothing
Date of computationMon, 19 Dec 2016 12:48:16 +0100
Cite this page as followsStatistical Computations at FreeStatistics.org, Office for Research Development and Education, URL https://freestatistics.org/blog/index.php?v=date/2016/Dec/19/t14821481288vwhozilgt9m8kq.htm/, Retrieved Fri, 01 Nov 2024 03:39:44 +0000
Statistical Computations at FreeStatistics.org, Office for Research Development and Education, URL https://freestatistics.org/blog/index.php?pk=301309, Retrieved Fri, 01 Nov 2024 03:39:44 +0000
QR Codes:

Original text written by user:
IsPrivate?No (this computation is public)
User-defined keywords
Estimated Impact117
Family? (F = Feedback message, R = changed R code, M = changed R Module, P = changed Parameters, D = changed Data)
-       [Exponential Smoothing] [n1150..] [2016-12-19 11:48:16] [b7f10b15eba379294ac5bdad7f2e1205] [Current]
Feedback Forum

Post a new message
Dataseries X:
4194
4439
4466
4523
4504
4749
4783
4812
4825
4935
4938
4957
4966
5081
5094
5110


Summary of computational transaction
Raw Input view raw input (R code)
Raw Outputview raw output of R engine
Computing time1 seconds
R ServerBig Analytics Cloud Computing Center

\begin{tabular}{lllllllll}
\hline
Summary of computational transaction \tabularnewline
Raw Input view raw input (R code)  \tabularnewline
Raw Outputview raw output of R engine  \tabularnewline
Computing time1 seconds \tabularnewline
R ServerBig Analytics Cloud Computing Center \tabularnewline
\hline
\end{tabular}
%Source: https://freestatistics.org/blog/index.php?pk=301309&T=0

[TABLE]
[ROW]
Summary of computational transaction[/C][/ROW] [ROW]Raw Input[/C] view raw input (R code) [/C][/ROW] [ROW]Raw Output[/C]view raw output of R engine [/C][/ROW] [ROW]Computing time[/C]1 seconds[/C][/ROW] [ROW]R Server[/C]Big Analytics Cloud Computing Center[/C][/ROW] [/TABLE] Source: https://freestatistics.org/blog/index.php?pk=301309&T=0

Globally Unique Identifier (entire table): ba.freestatistics.org/blog/index.php?pk=301309&T=0

As an alternative you can also use a QR Code:  

The GUIDs for individual cells are displayed in the table below:

Summary of computational transaction
Raw Input view raw input (R code)
Raw Outputview raw output of R engine
Computing time1 seconds
R ServerBig Analytics Cloud Computing Center


Estimated Parameters of Exponential Smoothing
ParameterValue
alpha0.797862686352981
beta0
gamma1

\begin{tabular}{lllllllll}
\hline
Estimated Parameters of Exponential Smoothing \tabularnewline
Parameter & Value \tabularnewline
alpha & 0.797862686352981 \tabularnewline
beta & 0 \tabularnewline
gamma & 1 \tabularnewline
\hline
\end{tabular}
%Source: https://freestatistics.org/blog/index.php?pk=301309&T=1

[TABLE]
[ROW][C]Estimated Parameters of Exponential Smoothing[/C][/ROW]
[ROW][C]Parameter[/C][C]Value[/C][/ROW]
[ROW][C]alpha[/C][C]0.797862686352981[/C][/ROW]
[ROW][C]beta[/C][C]0[/C][/ROW]
[ROW][C]gamma[/C][C]1[/C][/ROW]
[/TABLE]
Source: https://freestatistics.org/blog/index.php?pk=301309&T=1

Globally Unique Identifier (entire table): ba.freestatistics.org/blog/index.php?pk=301309&T=1

As an alternative you can also use a QR Code:  

The GUIDs for individual cells are displayed in the table below:

Estimated Parameters of Exponential Smoothing
ParameterValue
alpha0.797862686352981
beta0
gamma1


Interpolation Forecasts of Exponential Smoothing
tObservedFittedResiduals
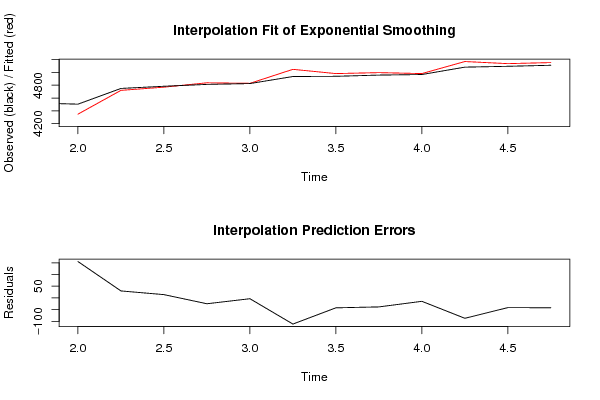
545044348.3875155.6125
647494719.119907280129.8800927198972
747834768.9101183260814.0898816739236
848124836.97690916883-24.9769091688286
948254828.45385804249-3.45385804248963
1049355046.85794254045-111.857942540453
1149384980.36887317246-42.3688731724578
1249574995.49247405157-38.492474051568
1349664980.53646975647-14.5364697564737
1450815168.18564147173-87.1856414717276
1550945135.42801432281-41.4280143228125
1651105152.0858562761-42.0858562761005

\begin{tabular}{lllllllll}
\hline
Interpolation Forecasts of Exponential Smoothing \tabularnewline
t & Observed & Fitted & Residuals \tabularnewline
5 & 4504 & 4348.3875 & 155.6125 \tabularnewline
6 & 4749 & 4719.1199072801 & 29.8800927198972 \tabularnewline
7 & 4783 & 4768.91011832608 & 14.0898816739236 \tabularnewline
8 & 4812 & 4836.97690916883 & -24.9769091688286 \tabularnewline
9 & 4825 & 4828.45385804249 & -3.45385804248963 \tabularnewline
10 & 4935 & 5046.85794254045 & -111.857942540453 \tabularnewline
11 & 4938 & 4980.36887317246 & -42.3688731724578 \tabularnewline
12 & 4957 & 4995.49247405157 & -38.492474051568 \tabularnewline
13 & 4966 & 4980.53646975647 & -14.5364697564737 \tabularnewline
14 & 5081 & 5168.18564147173 & -87.1856414717276 \tabularnewline
15 & 5094 & 5135.42801432281 & -41.4280143228125 \tabularnewline
16 & 5110 & 5152.0858562761 & -42.0858562761005 \tabularnewline
\hline
\end{tabular}
%Source: https://freestatistics.org/blog/index.php?pk=301309&T=2

[TABLE]
[ROW][C]Interpolation Forecasts of Exponential Smoothing[/C][/ROW]
[ROW][C]t[/C][C]Observed[/C][C]Fitted[/C][C]Residuals[/C][/ROW]
[ROW][C]5[/C][C]4504[/C][C]4348.3875[/C][C]155.6125[/C][/ROW]
[ROW][C]6[/C][C]4749[/C][C]4719.1199072801[/C][C]29.8800927198972[/C][/ROW]
[ROW][C]7[/C][C]4783[/C][C]4768.91011832608[/C][C]14.0898816739236[/C][/ROW]
[ROW][C]8[/C][C]4812[/C][C]4836.97690916883[/C][C]-24.9769091688286[/C][/ROW]
[ROW][C]9[/C][C]4825[/C][C]4828.45385804249[/C][C]-3.45385804248963[/C][/ROW]
[ROW][C]10[/C][C]4935[/C][C]5046.85794254045[/C][C]-111.857942540453[/C][/ROW]
[ROW][C]11[/C][C]4938[/C][C]4980.36887317246[/C][C]-42.3688731724578[/C][/ROW]
[ROW][C]12[/C][C]4957[/C][C]4995.49247405157[/C][C]-38.492474051568[/C][/ROW]
[ROW][C]13[/C][C]4966[/C][C]4980.53646975647[/C][C]-14.5364697564737[/C][/ROW]
[ROW][C]14[/C][C]5081[/C][C]5168.18564147173[/C][C]-87.1856414717276[/C][/ROW]
[ROW][C]15[/C][C]5094[/C][C]5135.42801432281[/C][C]-41.4280143228125[/C][/ROW]
[ROW][C]16[/C][C]5110[/C][C]5152.0858562761[/C][C]-42.0858562761005[/C][/ROW]
[/TABLE]
Source: https://freestatistics.org/blog/index.php?pk=301309&T=2

Globally Unique Identifier (entire table): ba.freestatistics.org/blog/index.php?pk=301309&T=2

As an alternative you can also use a QR Code:  

The GUIDs for individual cells are displayed in the table below:

Interpolation Forecasts of Exponential Smoothing
tObservedFittedResiduals
545044348.3875155.6125
647494719.119907280129.8800927198972
747834768.9101183260814.0898816739236
848124836.97690916883-24.9769091688286
948254828.45385804249-3.45385804248963
1049355046.85794254045-111.857942540453
1149384980.36887317246-42.3688731724578
1249574995.49247405157-38.492474051568
1349664980.53646975647-14.5364697564737
1450815168.18564147173-87.1856414717276
1550945135.42801432281-41.4280143228125
1651105152.0858562761-42.0858562761005


Extrapolation Forecasts of Exponential Smoothing
tForecast95% Lower Bound95% Upper Bound
175139.105228740175007.669977266075270.54048021428
185323.667398856225155.523495200275491.81130251216
195369.721265654095171.555881837295567.88664947088
205419.35195.097711095865643.50228890414
215448.405228740175188.516999534015708.29345794634
225632.967398856225352.719225469645913.21557224279
235679.021265654085379.795288016595978.24724329157
245728.65411.530082316686045.66991768332
255757.705228740175414.47271566816100.93774181225
265942.267398856225583.372281814536301.16251589791
275988.321265654085614.41906982886362.22346147936
286037.95649.57024444486426.2297555552

\begin{tabular}{lllllllll}
\hline
Extrapolation Forecasts of Exponential Smoothing \tabularnewline
t & Forecast & 95% Lower Bound & 95% Upper Bound \tabularnewline
17 & 5139.10522874017 & 5007.66997726607 & 5270.54048021428 \tabularnewline
18 & 5323.66739885622 & 5155.52349520027 & 5491.81130251216 \tabularnewline
19 & 5369.72126565409 & 5171.55588183729 & 5567.88664947088 \tabularnewline
20 & 5419.3 & 5195.09771109586 & 5643.50228890414 \tabularnewline
21 & 5448.40522874017 & 5188.51699953401 & 5708.29345794634 \tabularnewline
22 & 5632.96739885622 & 5352.71922546964 & 5913.21557224279 \tabularnewline
23 & 5679.02126565408 & 5379.79528801659 & 5978.24724329157 \tabularnewline
24 & 5728.6 & 5411.53008231668 & 6045.66991768332 \tabularnewline
25 & 5757.70522874017 & 5414.4727156681 & 6100.93774181225 \tabularnewline
26 & 5942.26739885622 & 5583.37228181453 & 6301.16251589791 \tabularnewline
27 & 5988.32126565408 & 5614.4190698288 & 6362.22346147936 \tabularnewline
28 & 6037.9 & 5649.5702444448 & 6426.2297555552 \tabularnewline
\hline
\end{tabular}
%Source: https://freestatistics.org/blog/index.php?pk=301309&T=3

[TABLE]
[ROW][C]Extrapolation Forecasts of Exponential Smoothing[/C][/ROW]
[ROW][C]t[/C][C]Forecast[/C][C]95% Lower Bound[/C][C]95% Upper Bound[/C][/ROW]
[ROW][C]17[/C][C]5139.10522874017[/C][C]5007.66997726607[/C][C]5270.54048021428[/C][/ROW]
[ROW][C]18[/C][C]5323.66739885622[/C][C]5155.52349520027[/C][C]5491.81130251216[/C][/ROW]
[ROW][C]19[/C][C]5369.72126565409[/C][C]5171.55588183729[/C][C]5567.88664947088[/C][/ROW]
[ROW][C]20[/C][C]5419.3[/C][C]5195.09771109586[/C][C]5643.50228890414[/C][/ROW]
[ROW][C]21[/C][C]5448.40522874017[/C][C]5188.51699953401[/C][C]5708.29345794634[/C][/ROW]
[ROW][C]22[/C][C]5632.96739885622[/C][C]5352.71922546964[/C][C]5913.21557224279[/C][/ROW]
[ROW][C]23[/C][C]5679.02126565408[/C][C]5379.79528801659[/C][C]5978.24724329157[/C][/ROW]
[ROW][C]24[/C][C]5728.6[/C][C]5411.53008231668[/C][C]6045.66991768332[/C][/ROW]
[ROW][C]25[/C][C]5757.70522874017[/C][C]5414.4727156681[/C][C]6100.93774181225[/C][/ROW]
[ROW][C]26[/C][C]5942.26739885622[/C][C]5583.37228181453[/C][C]6301.16251589791[/C][/ROW]
[ROW][C]27[/C][C]5988.32126565408[/C][C]5614.4190698288[/C][C]6362.22346147936[/C][/ROW]
[ROW][C]28[/C][C]6037.9[/C][C]5649.5702444448[/C][C]6426.2297555552[/C][/ROW]
[/TABLE]
Source: https://freestatistics.org/blog/index.php?pk=301309&T=3

Globally Unique Identifier (entire table): ba.freestatistics.org/blog/index.php?pk=301309&T=3

As an alternative you can also use a QR Code:  

The GUIDs for individual cells are displayed in the table below:

Extrapolation Forecasts of Exponential Smoothing
tForecast95% Lower Bound95% Upper Bound
175139.105228740175007.669977266075270.54048021428
185323.667398856225155.523495200275491.81130251216
195369.721265654095171.555881837295567.88664947088
205419.35195.097711095865643.50228890414
215448.405228740175188.516999534015708.29345794634
225632.967398856225352.719225469645913.21557224279
235679.021265654085379.795288016595978.24724329157
245728.65411.530082316686045.66991768332
255757.705228740175414.47271566816100.93774181225
265942.267398856225583.372281814536301.16251589791
275988.321265654085614.41906982886362.22346147936
286037.95649.57024444486426.2297555552


Parameters (Session):
par1 = Default ; par2 = 1 ; par3 = 1 ; par4 = 2 ; par5 = 3 ; par6 = White Noise ; par7 = 0.95 ;
Parameters (R input):
par1 = 4 ; par2 = Triple ; par3 = additive ; par4 = 12 ;
R code (references can be found in the software module):
par1 <- as.numeric(par1)
par4 <- as.numeric(par4)
if (par2 == 'Single') K <- 1
if (par2 == 'Double') K <- 2
if (par2 == 'Triple') K <- par1
nx <- length(x)
nxmK <- nx - K
x <- ts(x, frequency = par1)
if (par2 == 'Single') fit <- HoltWinters(x, gamma=F, beta=F)
if (par2 == 'Double') fit <- HoltWinters(x, gamma=F)
if (par2 == 'Triple') fit <- HoltWinters(x, seasonal=par3)
fit
myresid <- x - fit$fitted[,'xhat']
bitmap(file='test1.png')
op <- par(mfrow=c(2,1))
plot(fit,ylab='Observed (black) / Fitted (red)',main='Interpolation Fit of Exponential Smoothing')
plot(myresid,ylab='Residuals',main='Interpolation Prediction Errors')
par(op)
dev.off()
bitmap(file='test2.png')
p <- predict(fit, par4, prediction.interval=TRUE)
np <- length(p[,1])
plot(fit,p,ylab='Observed (black) / Fitted (red)',main='Extrapolation Fit of Exponential Smoothing')
dev.off()
bitmap(file='test3.png')
op <- par(mfrow = c(2,2))
acf(as.numeric(myresid),lag.max = nx/2,main='Residual ACF')
spectrum(myresid,main='Residals Periodogram')
cpgram(myresid,main='Residal Cumulative Periodogram')
qqnorm(myresid,main='Residual Normal QQ Plot')
qqline(myresid)
par(op)
dev.off()
load(file='createtable')
a<-table.start()
a<-table.row.start(a)
a<-table.element(a,'Estimated Parameters of Exponential Smoothing',2,TRUE)
a<-table.row.end(a)
a<-table.row.start(a)
a<-table.element(a,'Parameter',header=TRUE)
a<-table.element(a,'Value',header=TRUE)
a<-table.row.end(a)
a<-table.row.start(a)
a<-table.element(a,'alpha',header=TRUE)
a<-table.element(a,fit$alpha)
a<-table.row.end(a)
a<-table.row.start(a)
a<-table.element(a,'beta',header=TRUE)
a<-table.element(a,fit$beta)
a<-table.row.end(a)
a<-table.row.start(a)
a<-table.element(a,'gamma',header=TRUE)
a<-table.element(a,fit$gamma)
a<-table.row.end(a)
a<-table.end(a)
table.save(a,file='mytable.tab')
a<-table.start()
a<-table.row.start(a)
a<-table.element(a,'Interpolation Forecasts of Exponential Smoothing',4,TRUE)
a<-table.row.end(a)
a<-table.row.start(a)
a<-table.element(a,'t',header=TRUE)
a<-table.element(a,'Observed',header=TRUE)
a<-table.element(a,'Fitted',header=TRUE)
a<-table.element(a,'Residuals',header=TRUE)
a<-table.row.end(a)
for (i in 1:nxmK) {
a<-table.row.start(a)
a<-table.element(a,i+K,header=TRUE)
a<-table.element(a,x[i+K])
a<-table.element(a,fit$fitted[i,'xhat'])
a<-table.element(a,myresid[i])
a<-table.row.end(a)
}
a<-table.end(a)
table.save(a,file='mytable1.tab')
a<-table.start()
a<-table.row.start(a)
a<-table.element(a,'Extrapolation Forecasts of Exponential Smoothing',4,TRUE)
a<-table.row.end(a)
a<-table.row.start(a)
a<-table.element(a,'t',header=TRUE)
a<-table.element(a,'Forecast',header=TRUE)
a<-table.element(a,'95% Lower Bound',header=TRUE)
a<-table.element(a,'95% Upper Bound',header=TRUE)
a<-table.row.end(a)
for (i in 1:np) {
a<-table.row.start(a)
a<-table.element(a,nx+i,header=TRUE)
a<-table.element(a,p[i,'fit'])
a<-table.element(a,p[i,'lwr'])
a<-table.element(a,p[i,'upr'])
a<-table.row.end(a)
}
a<-table.end(a)
table.save(a,file='mytable2.tab')