Free Statistics

of Irreproducible Research!

Author's title

Author*The author of this computation has been verified*
R Software Modulerwasp_exponentialsmoothing.wasp
Title produced by softwareExponential Smoothing
Date of computationMon, 19 Dec 2016 12:31:16 +0100
Cite this page as followsStatistical Computations at FreeStatistics.org, Office for Research Development and Education, URL https://freestatistics.org/blog/index.php?v=date/2016/Dec/19/t148214716083g5nocses4abks.htm/, Retrieved Fri, 01 Nov 2024 03:33:22 +0000
Statistical Computations at FreeStatistics.org, Office for Research Development and Education, URL https://freestatistics.org/blog/index.php?pk=301305, Retrieved Fri, 01 Nov 2024 03:33:22 +0000
QR Codes:

Original text written by user:
IsPrivate?No (this computation is public)
User-defined keywords
Estimated Impact147
Family? (F = Feedback message, R = changed R code, M = changed R Module, P = changed Parameters, D = changed Data)
-       [Exponential Smoothing] [n1176.] [2016-12-19 11:31:16] [b7f10b15eba379294ac5bdad7f2e1205] [Current]
Feedback Forum

Post a new message
Dataseries X:
1788
1936
3952
2476
1980
2208
4354
2760
1948
2328
4732
3072
1974
2916
5932
3502


Summary of computational transaction
Raw Input view raw input (R code)
Raw Outputview raw output of R engine
Computing time1 seconds
R ServerBig Analytics Cloud Computing Center

\begin{tabular}{lllllllll}
\hline
Summary of computational transaction \tabularnewline
Raw Input view raw input (R code)  \tabularnewline
Raw Outputview raw output of R engine  \tabularnewline
Computing time1 seconds \tabularnewline
R ServerBig Analytics Cloud Computing Center \tabularnewline
\hline
\end{tabular}
%Source: https://freestatistics.org/blog/index.php?pk=301305&T=0

[TABLE]
[ROW]
Summary of computational transaction[/C][/ROW] [ROW]Raw Input[/C] view raw input (R code) [/C][/ROW] [ROW]Raw Output[/C]view raw output of R engine [/C][/ROW] [ROW]Computing time[/C]1 seconds[/C][/ROW] [ROW]R Server[/C]Big Analytics Cloud Computing Center[/C][/ROW] [/TABLE] Source: https://freestatistics.org/blog/index.php?pk=301305&T=0

Globally Unique Identifier (entire table): ba.freestatistics.org/blog/index.php?pk=301305&T=0

As an alternative you can also use a QR Code:  

The GUIDs for individual cells are displayed in the table below:

Summary of computational transaction
Raw Input view raw input (R code)
Raw Outputview raw output of R engine
Computing time1 seconds
R ServerBig Analytics Cloud Computing Center


Estimated Parameters of Exponential Smoothing
ParameterValue
alpha0.0981701076701734
beta0
gamma1

\begin{tabular}{lllllllll}
\hline
Estimated Parameters of Exponential Smoothing \tabularnewline
Parameter & Value \tabularnewline
alpha & 0.0981701076701734 \tabularnewline
beta & 0 \tabularnewline
gamma & 1 \tabularnewline
\hline
\end{tabular}
%Source: https://freestatistics.org/blog/index.php?pk=301305&T=1

[TABLE]
[ROW][C]Estimated Parameters of Exponential Smoothing[/C][/ROW]
[ROW][C]Parameter[/C][C]Value[/C][/ROW]
[ROW][C]alpha[/C][C]0.0981701076701734[/C][/ROW]
[ROW][C]beta[/C][C]0[/C][/ROW]
[ROW][C]gamma[/C][C]1[/C][/ROW]
[/TABLE]
Source: https://freestatistics.org/blog/index.php?pk=301305&T=1

Globally Unique Identifier (entire table): ba.freestatistics.org/blog/index.php?pk=301305&T=1

As an alternative you can also use a QR Code:  

The GUIDs for individual cells are displayed in the table below:

Estimated Parameters of Exponential Smoothing
ParameterValue
alpha0.0981701076701734
beta0
gamma1


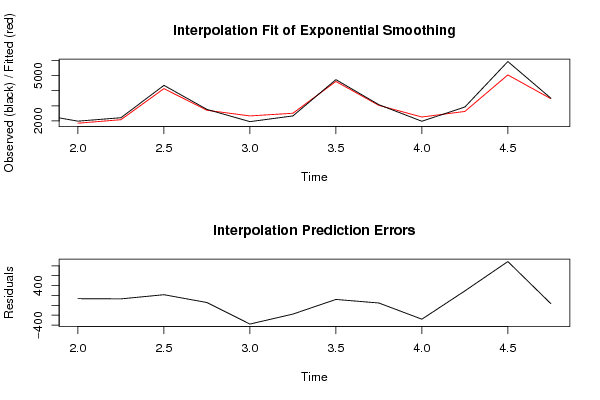
Interpolation Forecasts of Exponential Smoothing
tObservedFittedResiduals
519801844.6375135.3625
622082077.0010511995130.998948800497
743544138.68623210793215.313767892072
827602702.6486078847657.3513921152371
919482326.92774902425-378.927749024247
1023282504.8681901949-176.868190194896
1147324612.3676451432119.632354856802
1230723024.4817739613447.5182260386596
1319742254.34602124878-280.346021248778
1429162624.18759143274291.812408567258
1559325045.09052584415886.909474155847
1635023467.4936550492234.5063449507816

\begin{tabular}{lllllllll}
\hline
Interpolation Forecasts of Exponential Smoothing \tabularnewline
t & Observed & Fitted & Residuals \tabularnewline
5 & 1980 & 1844.6375 & 135.3625 \tabularnewline
6 & 2208 & 2077.0010511995 & 130.998948800497 \tabularnewline
7 & 4354 & 4138.68623210793 & 215.313767892072 \tabularnewline
8 & 2760 & 2702.64860788476 & 57.3513921152371 \tabularnewline
9 & 1948 & 2326.92774902425 & -378.927749024247 \tabularnewline
10 & 2328 & 2504.8681901949 & -176.868190194896 \tabularnewline
11 & 4732 & 4612.3676451432 & 119.632354856802 \tabularnewline
12 & 3072 & 3024.48177396134 & 47.5182260386596 \tabularnewline
13 & 1974 & 2254.34602124878 & -280.346021248778 \tabularnewline
14 & 2916 & 2624.18759143274 & 291.812408567258 \tabularnewline
15 & 5932 & 5045.09052584415 & 886.909474155847 \tabularnewline
16 & 3502 & 3467.49365504922 & 34.5063449507816 \tabularnewline
\hline
\end{tabular}
%Source: https://freestatistics.org/blog/index.php?pk=301305&T=2

[TABLE]
[ROW][C]Interpolation Forecasts of Exponential Smoothing[/C][/ROW]
[ROW][C]t[/C][C]Observed[/C][C]Fitted[/C][C]Residuals[/C][/ROW]
[ROW][C]5[/C][C]1980[/C][C]1844.6375[/C][C]135.3625[/C][/ROW]
[ROW][C]6[/C][C]2208[/C][C]2077.0010511995[/C][C]130.998948800497[/C][/ROW]
[ROW][C]7[/C][C]4354[/C][C]4138.68623210793[/C][C]215.313767892072[/C][/ROW]
[ROW][C]8[/C][C]2760[/C][C]2702.64860788476[/C][C]57.3513921152371[/C][/ROW]
[ROW][C]9[/C][C]1948[/C][C]2326.92774902425[/C][C]-378.927749024247[/C][/ROW]
[ROW][C]10[/C][C]2328[/C][C]2504.8681901949[/C][C]-176.868190194896[/C][/ROW]
[ROW][C]11[/C][C]4732[/C][C]4612.3676451432[/C][C]119.632354856802[/C][/ROW]
[ROW][C]12[/C][C]3072[/C][C]3024.48177396134[/C][C]47.5182260386596[/C][/ROW]
[ROW][C]13[/C][C]1974[/C][C]2254.34602124878[/C][C]-280.346021248778[/C][/ROW]
[ROW][C]14[/C][C]2916[/C][C]2624.18759143274[/C][C]291.812408567258[/C][/ROW]
[ROW][C]15[/C][C]5932[/C][C]5045.09052584415[/C][C]886.909474155847[/C][/ROW]
[ROW][C]16[/C][C]3502[/C][C]3467.49365504922[/C][C]34.5063449507816[/C][/ROW]
[/TABLE]
Source: https://freestatistics.org/blog/index.php?pk=301305&T=2

Globally Unique Identifier (entire table): ba.freestatistics.org/blog/index.php?pk=301305&T=2

As an alternative you can also use a QR Code:  

The GUIDs for individual cells are displayed in the table below:

Interpolation Forecasts of Exponential Smoothing
tObservedFittedResiduals
519801844.6375135.3625
622082077.0010511995130.998948800497
743544138.68623210793215.313767892072
827602702.6486078847657.3513921152371
919482326.92774902425-378.927749024247
1023282504.8681901949-176.868190194896
1147324612.3676451432119.632354856802
1230723024.4817739613447.5182260386596
1319742254.34602124878-280.346021248778
1429162624.18759143274291.812408567258
1559325045.09052584415886.909474155847
1635023467.4936550492234.5063449507816


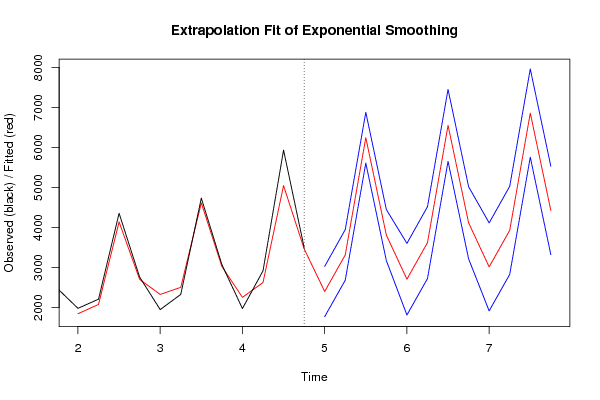
Extrapolation Forecasts of Exponential Smoothing
tForecast95% Lower Bound95% Upper Bound
172400.402745739241772.1209355363028.68455594248
183313.75549017072682.453447147363945.05753319404
196242.687491599125608.379596315916876.99538688234
203809.33172.000429537414446.59957046259
212707.702745739241812.77885202313602.62663945538
223621.05549017072724.008661940844518.10231840056
236549.987491599125650.82274110547449.15224209284
244116.63215.322304157255017.87769584275
253015.002745739241916.349243466634113.65624801185
263928.35549017072827.972032212045028.73894812936
276857.287491599125755.176793419387959.39818977886
284423.93320.064764316975527.73523568303

\begin{tabular}{lllllllll}
\hline
Extrapolation Forecasts of Exponential Smoothing \tabularnewline
t & Forecast & 95% Lower Bound & 95% Upper Bound \tabularnewline
17 & 2400.40274573924 & 1772.120935536 & 3028.68455594248 \tabularnewline
18 & 3313.7554901707 & 2682.45344714736 & 3945.05753319404 \tabularnewline
19 & 6242.68749159912 & 5608.37959631591 & 6876.99538688234 \tabularnewline
20 & 3809.3 & 3172.00042953741 & 4446.59957046259 \tabularnewline
21 & 2707.70274573924 & 1812.7788520231 & 3602.62663945538 \tabularnewline
22 & 3621.0554901707 & 2724.00866194084 & 4518.10231840056 \tabularnewline
23 & 6549.98749159912 & 5650.8227411054 & 7449.15224209284 \tabularnewline
24 & 4116.6 & 3215.32230415725 & 5017.87769584275 \tabularnewline
25 & 3015.00274573924 & 1916.34924346663 & 4113.65624801185 \tabularnewline
26 & 3928.3554901707 & 2827.97203221204 & 5028.73894812936 \tabularnewline
27 & 6857.28749159912 & 5755.17679341938 & 7959.39818977886 \tabularnewline
28 & 4423.9 & 3320.06476431697 & 5527.73523568303 \tabularnewline
\hline
\end{tabular}
%Source: https://freestatistics.org/blog/index.php?pk=301305&T=3

[TABLE]
[ROW][C]Extrapolation Forecasts of Exponential Smoothing[/C][/ROW]
[ROW][C]t[/C][C]Forecast[/C][C]95% Lower Bound[/C][C]95% Upper Bound[/C][/ROW]
[ROW][C]17[/C][C]2400.40274573924[/C][C]1772.120935536[/C][C]3028.68455594248[/C][/ROW]
[ROW][C]18[/C][C]3313.7554901707[/C][C]2682.45344714736[/C][C]3945.05753319404[/C][/ROW]
[ROW][C]19[/C][C]6242.68749159912[/C][C]5608.37959631591[/C][C]6876.99538688234[/C][/ROW]
[ROW][C]20[/C][C]3809.3[/C][C]3172.00042953741[/C][C]4446.59957046259[/C][/ROW]
[ROW][C]21[/C][C]2707.70274573924[/C][C]1812.7788520231[/C][C]3602.62663945538[/C][/ROW]
[ROW][C]22[/C][C]3621.0554901707[/C][C]2724.00866194084[/C][C]4518.10231840056[/C][/ROW]
[ROW][C]23[/C][C]6549.98749159912[/C][C]5650.8227411054[/C][C]7449.15224209284[/C][/ROW]
[ROW][C]24[/C][C]4116.6[/C][C]3215.32230415725[/C][C]5017.87769584275[/C][/ROW]
[ROW][C]25[/C][C]3015.00274573924[/C][C]1916.34924346663[/C][C]4113.65624801185[/C][/ROW]
[ROW][C]26[/C][C]3928.3554901707[/C][C]2827.97203221204[/C][C]5028.73894812936[/C][/ROW]
[ROW][C]27[/C][C]6857.28749159912[/C][C]5755.17679341938[/C][C]7959.39818977886[/C][/ROW]
[ROW][C]28[/C][C]4423.9[/C][C]3320.06476431697[/C][C]5527.73523568303[/C][/ROW]
[/TABLE]
Source: https://freestatistics.org/blog/index.php?pk=301305&T=3

Globally Unique Identifier (entire table): ba.freestatistics.org/blog/index.php?pk=301305&T=3

As an alternative you can also use a QR Code:  

The GUIDs for individual cells are displayed in the table below:

Extrapolation Forecasts of Exponential Smoothing
tForecast95% Lower Bound95% Upper Bound
172400.402745739241772.1209355363028.68455594248
183313.75549017072682.453447147363945.05753319404
196242.687491599125608.379596315916876.99538688234
203809.33172.000429537414446.59957046259
212707.702745739241812.77885202313602.62663945538
223621.05549017072724.008661940844518.10231840056
236549.987491599125650.82274110547449.15224209284
244116.63215.322304157255017.87769584275
253015.002745739241916.349243466634113.65624801185
263928.35549017072827.972032212045028.73894812936
276857.287491599125755.176793419387959.39818977886
284423.93320.064764316975527.73523568303


Parameters (Session):
par1 = 4 ; par2 = Triple ; par3 = additive ; par4 = 12 ;
Parameters (R input):
par1 = 4 ; par2 = Triple ; par3 = additive ; par4 = 12 ;
R code (references can be found in the software module):
par4 <- '12'
par3 <- 'additive'
par2 <- 'Triple'
par1 <- '12'
par1 <- as.numeric(par1)
par4 <- as.numeric(par4)
if (par2 == 'Single') K <- 1
if (par2 == 'Double') K <- 2
if (par2 == 'Triple') K <- par1
nx <- length(x)
nxmK <- nx - K
x <- ts(x, frequency = par1)
if (par2 == 'Single') fit <- HoltWinters(x, gamma=F, beta=F)
if (par2 == 'Double') fit <- HoltWinters(x, gamma=F)
if (par2 == 'Triple') fit <- HoltWinters(x, seasonal=par3)
fit
myresid <- x - fit$fitted[,'xhat']
bitmap(file='test1.png')
op <- par(mfrow=c(2,1))
plot(fit,ylab='Observed (black) / Fitted (red)',main='Interpolation Fit of Exponential Smoothing')
plot(myresid,ylab='Residuals',main='Interpolation Prediction Errors')
par(op)
dev.off()
bitmap(file='test2.png')
p <- predict(fit, par4, prediction.interval=TRUE)
np <- length(p[,1])
plot(fit,p,ylab='Observed (black) / Fitted (red)',main='Extrapolation Fit of Exponential Smoothing')
dev.off()
bitmap(file='test3.png')
op <- par(mfrow = c(2,2))
acf(as.numeric(myresid),lag.max = nx/2,main='Residual ACF')
spectrum(myresid,main='Residals Periodogram')
cpgram(myresid,main='Residal Cumulative Periodogram')
qqnorm(myresid,main='Residual Normal QQ Plot')
qqline(myresid)
par(op)
dev.off()
load(file='createtable')
a<-table.start()
a<-table.row.start(a)
a<-table.element(a,'Estimated Parameters of Exponential Smoothing',2,TRUE)
a<-table.row.end(a)
a<-table.row.start(a)
a<-table.element(a,'Parameter',header=TRUE)
a<-table.element(a,'Value',header=TRUE)
a<-table.row.end(a)
a<-table.row.start(a)
a<-table.element(a,'alpha',header=TRUE)
a<-table.element(a,fit$alpha)
a<-table.row.end(a)
a<-table.row.start(a)
a<-table.element(a,'beta',header=TRUE)
a<-table.element(a,fit$beta)
a<-table.row.end(a)
a<-table.row.start(a)
a<-table.element(a,'gamma',header=TRUE)
a<-table.element(a,fit$gamma)
a<-table.row.end(a)
a<-table.end(a)
table.save(a,file='mytable.tab')
a<-table.start()
a<-table.row.start(a)
a<-table.element(a,'Interpolation Forecasts of Exponential Smoothing',4,TRUE)
a<-table.row.end(a)
a<-table.row.start(a)
a<-table.element(a,'t',header=TRUE)
a<-table.element(a,'Observed',header=TRUE)
a<-table.element(a,'Fitted',header=TRUE)
a<-table.element(a,'Residuals',header=TRUE)
a<-table.row.end(a)
for (i in 1:nxmK) {
a<-table.row.start(a)
a<-table.element(a,i+K,header=TRUE)
a<-table.element(a,x[i+K])
a<-table.element(a,fit$fitted[i,'xhat'])
a<-table.element(a,myresid[i])
a<-table.row.end(a)
}
a<-table.end(a)
table.save(a,file='mytable1.tab')
a<-table.start()
a<-table.row.start(a)
a<-table.element(a,'Extrapolation Forecasts of Exponential Smoothing',4,TRUE)
a<-table.row.end(a)
a<-table.row.start(a)
a<-table.element(a,'t',header=TRUE)
a<-table.element(a,'Forecast',header=TRUE)
a<-table.element(a,'95% Lower Bound',header=TRUE)
a<-table.element(a,'95% Upper Bound',header=TRUE)
a<-table.row.end(a)
for (i in 1:np) {
a<-table.row.start(a)
a<-table.element(a,nx+i,header=TRUE)
a<-table.element(a,p[i,'fit'])
a<-table.element(a,p[i,'lwr'])
a<-table.element(a,p[i,'upr'])
a<-table.row.end(a)
}
a<-table.end(a)
table.save(a,file='mytable2.tab')