Free Statistics

of Irreproducible Research!

Author's title

Author*The author of this computation has been verified*
R Software Modulerwasp_autocorrelation.wasp
Title produced by software(Partial) Autocorrelation Function
Date of computationSun, 18 Dec 2016 19:10:20 +0100
Cite this page as followsStatistical Computations at FreeStatistics.org, Office for Research Development and Education, URL https://freestatistics.org/blog/index.php?v=date/2016/Dec/18/t1482084709u3langetlxxu5nk.htm/, Retrieved Fri, 01 Nov 2024 03:35:35 +0000
Statistical Computations at FreeStatistics.org, Office for Research Development and Education, URL https://freestatistics.org/blog/index.php?pk=301208, Retrieved Fri, 01 Nov 2024 03:35:35 +0000
QR Codes:

Original text written by user:
IsPrivate?No (this computation is public)
User-defined keywords
Estimated Impact129
Family? (F = Feedback message, R = changed R code, M = changed R Module, P = changed Parameters, D = changed Data)
-       [(Partial) Autocorrelation Function] [partial autocorre...] [2016-12-18 18:10:20] [33f2a624cfeb2efbc43d2c77b7c0dad6] [Current]
Feedback Forum

Post a new message
Dataseries X:
4870
4240
3800
3990
3290
4710
4210
4440
5040
5070
4900
4790
3890
3450
4080
3280
3130
3310
3860
4570
5110
4820
4250
4210
3610
3710
2760
2710
2710
3290
2670
3620
4440
3910
4610
3760
3460
3020
3360
2610
2670
2480
2610
3320
2800
3030
3740
3060
3040
2620
3190
2750
2630
3290
2430
2730
3690
2980
2590
3360
2370
2200
2330
2370
2200
2430
2400
2840
2870
3320
3090
2680
2420
2550
2420
2430
2330
2520
2630
2570
2800
2680
2430
2790
2420
2750
2350
2330
2290
2330
2490
2480
2760
2590
2950
2570
2960
2540
2400
2470
2390
2310
2470
2490
2510
2690
3060
2690
NA
NA
NA
NA
NA
NA
NA
NA
NA
NA
NA
NA
NA
NA
NA
NA
NA
NA
NA
NA
NA
NA
NA
NA
NA
NA
NA
NA
NA
NA
NA
NA
NA
NA
NA
NA


Summary of computational transaction
Raw Input view raw input (R code)
Raw Outputview raw output of R engine
Computing time1 seconds
R ServerBig Analytics Cloud Computing Center

\begin{tabular}{lllllllll}
\hline
Summary of computational transaction \tabularnewline
Raw Input view raw input (R code)  \tabularnewline
Raw Outputview raw output of R engine  \tabularnewline
Computing time1 seconds \tabularnewline
R ServerBig Analytics Cloud Computing Center \tabularnewline
\hline
\end{tabular}
%Source: https://freestatistics.org/blog/index.php?pk=301208&T=0

[TABLE]
[ROW]
Summary of computational transaction[/C][/ROW] [ROW]Raw Input[/C] view raw input (R code) [/C][/ROW] [ROW]Raw Output[/C]view raw output of R engine [/C][/ROW] [ROW]Computing time[/C]1 seconds[/C][/ROW] [ROW]R Server[/C]Big Analytics Cloud Computing Center[/C][/ROW] [/TABLE] Source: https://freestatistics.org/blog/index.php?pk=301208&T=0

Globally Unique Identifier (entire table): ba.freestatistics.org/blog/index.php?pk=301208&T=0

As an alternative you can also use a QR Code:  

The GUIDs for individual cells are displayed in the table below:

Summary of computational transaction
Raw Input view raw input (R code)
Raw Outputview raw output of R engine
Computing time1 seconds
R ServerBig Analytics Cloud Computing Center


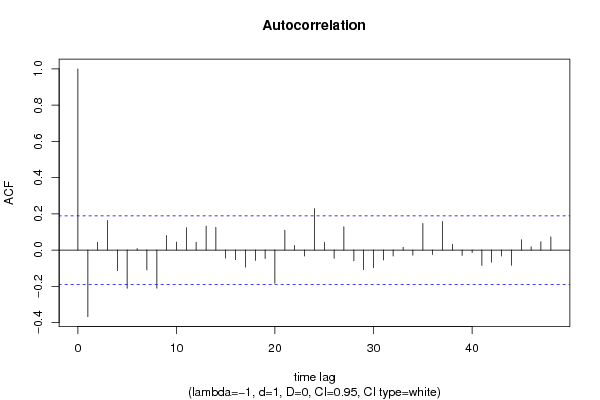
Autocorrelation Function
Time lag kACF(k)T-STATP-value
1-0.36759-3.80240.000119
20.0426210.44090.330098
30.1632861.6890.047062
4-0.113373-1.17270.121753
5-0.210485-2.17730.015828
60.0081650.08450.466424
7-0.10953-1.1330.129875
8-0.209987-2.17210.016027
90.0807840.83560.202611
100.0438880.4540.325381
110.1231041.27340.102819
120.0430490.44530.3285
130.1321821.36730.087198
140.1251881.2950.099061
15-0.043848-0.45360.325528
16-0.052655-0.54470.293559
17-0.094393-0.97640.165532
18-0.057039-0.590.278214
19-0.046272-0.47860.316583
20-0.183024-1.89320.030515
210.1098711.13650.129141
220.0255870.26470.395886
23-0.032455-0.33570.368871
240.2290792.36960.009799
250.0420330.43480.332293
26-0.045257-0.46810.320319
270.1288161.33250.092766
28-0.05912-0.61150.271069
29-0.108003-1.11720.133207
30-0.097679-1.01040.157292
31-0.054913-0.5680.285605
32-0.03251-0.33630.368657
330.0152230.15750.437585
34-0.028121-0.29090.38585
350.1464371.51480.066392
36-0.02411-0.24940.401766
370.1574931.62910.053114
380.031760.32850.371577
39-0.02924-0.30250.381443
40-0.013471-0.13930.444718
41-0.08463-0.87540.191655
42-0.066545-0.68830.246361
43-0.033048-0.34190.366567
44-0.083825-0.86710.193915
450.0575140.59490.276572
460.017950.18570.426525
470.0462960.47890.316499
480.0727380.75240.226728

\begin{tabular}{lllllllll}
\hline
Autocorrelation Function \tabularnewline
Time lag k & ACF(k) & T-STAT & P-value \tabularnewline
1 & -0.36759 & -3.8024 & 0.000119 \tabularnewline
2 & 0.042621 & 0.4409 & 0.330098 \tabularnewline
3 & 0.163286 & 1.689 & 0.047062 \tabularnewline
4 & -0.113373 & -1.1727 & 0.121753 \tabularnewline
5 & -0.210485 & -2.1773 & 0.015828 \tabularnewline
6 & 0.008165 & 0.0845 & 0.466424 \tabularnewline
7 & -0.10953 & -1.133 & 0.129875 \tabularnewline
8 & -0.209987 & -2.1721 & 0.016027 \tabularnewline
9 & 0.080784 & 0.8356 & 0.202611 \tabularnewline
10 & 0.043888 & 0.454 & 0.325381 \tabularnewline
11 & 0.123104 & 1.2734 & 0.102819 \tabularnewline
12 & 0.043049 & 0.4453 & 0.3285 \tabularnewline
13 & 0.132182 & 1.3673 & 0.087198 \tabularnewline
14 & 0.125188 & 1.295 & 0.099061 \tabularnewline
15 & -0.043848 & -0.4536 & 0.325528 \tabularnewline
16 & -0.052655 & -0.5447 & 0.293559 \tabularnewline
17 & -0.094393 & -0.9764 & 0.165532 \tabularnewline
18 & -0.057039 & -0.59 & 0.278214 \tabularnewline
19 & -0.046272 & -0.4786 & 0.316583 \tabularnewline
20 & -0.183024 & -1.8932 & 0.030515 \tabularnewline
21 & 0.109871 & 1.1365 & 0.129141 \tabularnewline
22 & 0.025587 & 0.2647 & 0.395886 \tabularnewline
23 & -0.032455 & -0.3357 & 0.368871 \tabularnewline
24 & 0.229079 & 2.3696 & 0.009799 \tabularnewline
25 & 0.042033 & 0.4348 & 0.332293 \tabularnewline
26 & -0.045257 & -0.4681 & 0.320319 \tabularnewline
27 & 0.128816 & 1.3325 & 0.092766 \tabularnewline
28 & -0.05912 & -0.6115 & 0.271069 \tabularnewline
29 & -0.108003 & -1.1172 & 0.133207 \tabularnewline
30 & -0.097679 & -1.0104 & 0.157292 \tabularnewline
31 & -0.054913 & -0.568 & 0.285605 \tabularnewline
32 & -0.03251 & -0.3363 & 0.368657 \tabularnewline
33 & 0.015223 & 0.1575 & 0.437585 \tabularnewline
34 & -0.028121 & -0.2909 & 0.38585 \tabularnewline
35 & 0.146437 & 1.5148 & 0.066392 \tabularnewline
36 & -0.02411 & -0.2494 & 0.401766 \tabularnewline
37 & 0.157493 & 1.6291 & 0.053114 \tabularnewline
38 & 0.03176 & 0.3285 & 0.371577 \tabularnewline
39 & -0.02924 & -0.3025 & 0.381443 \tabularnewline
40 & -0.013471 & -0.1393 & 0.444718 \tabularnewline
41 & -0.08463 & -0.8754 & 0.191655 \tabularnewline
42 & -0.066545 & -0.6883 & 0.246361 \tabularnewline
43 & -0.033048 & -0.3419 & 0.366567 \tabularnewline
44 & -0.083825 & -0.8671 & 0.193915 \tabularnewline
45 & 0.057514 & 0.5949 & 0.276572 \tabularnewline
46 & 0.01795 & 0.1857 & 0.426525 \tabularnewline
47 & 0.046296 & 0.4789 & 0.316499 \tabularnewline
48 & 0.072738 & 0.7524 & 0.226728 \tabularnewline
\hline
\end{tabular}
%Source: https://freestatistics.org/blog/index.php?pk=301208&T=1

[TABLE]
[ROW][C]Autocorrelation Function[/C][/ROW]
[ROW][C]Time lag k[/C][C]ACF(k)[/C][C]T-STAT[/C][C]P-value[/C][/ROW]
[ROW][C]1[/C][C]-0.36759[/C][C]-3.8024[/C][C]0.000119[/C][/ROW]
[ROW][C]2[/C][C]0.042621[/C][C]0.4409[/C][C]0.330098[/C][/ROW]
[ROW][C]3[/C][C]0.163286[/C][C]1.689[/C][C]0.047062[/C][/ROW]
[ROW][C]4[/C][C]-0.113373[/C][C]-1.1727[/C][C]0.121753[/C][/ROW]
[ROW][C]5[/C][C]-0.210485[/C][C]-2.1773[/C][C]0.015828[/C][/ROW]
[ROW][C]6[/C][C]0.008165[/C][C]0.0845[/C][C]0.466424[/C][/ROW]
[ROW][C]7[/C][C]-0.10953[/C][C]-1.133[/C][C]0.129875[/C][/ROW]
[ROW][C]8[/C][C]-0.209987[/C][C]-2.1721[/C][C]0.016027[/C][/ROW]
[ROW][C]9[/C][C]0.080784[/C][C]0.8356[/C][C]0.202611[/C][/ROW]
[ROW][C]10[/C][C]0.043888[/C][C]0.454[/C][C]0.325381[/C][/ROW]
[ROW][C]11[/C][C]0.123104[/C][C]1.2734[/C][C]0.102819[/C][/ROW]
[ROW][C]12[/C][C]0.043049[/C][C]0.4453[/C][C]0.3285[/C][/ROW]
[ROW][C]13[/C][C]0.132182[/C][C]1.3673[/C][C]0.087198[/C][/ROW]
[ROW][C]14[/C][C]0.125188[/C][C]1.295[/C][C]0.099061[/C][/ROW]
[ROW][C]15[/C][C]-0.043848[/C][C]-0.4536[/C][C]0.325528[/C][/ROW]
[ROW][C]16[/C][C]-0.052655[/C][C]-0.5447[/C][C]0.293559[/C][/ROW]
[ROW][C]17[/C][C]-0.094393[/C][C]-0.9764[/C][C]0.165532[/C][/ROW]
[ROW][C]18[/C][C]-0.057039[/C][C]-0.59[/C][C]0.278214[/C][/ROW]
[ROW][C]19[/C][C]-0.046272[/C][C]-0.4786[/C][C]0.316583[/C][/ROW]
[ROW][C]20[/C][C]-0.183024[/C][C]-1.8932[/C][C]0.030515[/C][/ROW]
[ROW][C]21[/C][C]0.109871[/C][C]1.1365[/C][C]0.129141[/C][/ROW]
[ROW][C]22[/C][C]0.025587[/C][C]0.2647[/C][C]0.395886[/C][/ROW]
[ROW][C]23[/C][C]-0.032455[/C][C]-0.3357[/C][C]0.368871[/C][/ROW]
[ROW][C]24[/C][C]0.229079[/C][C]2.3696[/C][C]0.009799[/C][/ROW]
[ROW][C]25[/C][C]0.042033[/C][C]0.4348[/C][C]0.332293[/C][/ROW]
[ROW][C]26[/C][C]-0.045257[/C][C]-0.4681[/C][C]0.320319[/C][/ROW]
[ROW][C]27[/C][C]0.128816[/C][C]1.3325[/C][C]0.092766[/C][/ROW]
[ROW][C]28[/C][C]-0.05912[/C][C]-0.6115[/C][C]0.271069[/C][/ROW]
[ROW][C]29[/C][C]-0.108003[/C][C]-1.1172[/C][C]0.133207[/C][/ROW]
[ROW][C]30[/C][C]-0.097679[/C][C]-1.0104[/C][C]0.157292[/C][/ROW]
[ROW][C]31[/C][C]-0.054913[/C][C]-0.568[/C][C]0.285605[/C][/ROW]
[ROW][C]32[/C][C]-0.03251[/C][C]-0.3363[/C][C]0.368657[/C][/ROW]
[ROW][C]33[/C][C]0.015223[/C][C]0.1575[/C][C]0.437585[/C][/ROW]
[ROW][C]34[/C][C]-0.028121[/C][C]-0.2909[/C][C]0.38585[/C][/ROW]
[ROW][C]35[/C][C]0.146437[/C][C]1.5148[/C][C]0.066392[/C][/ROW]
[ROW][C]36[/C][C]-0.02411[/C][C]-0.2494[/C][C]0.401766[/C][/ROW]
[ROW][C]37[/C][C]0.157493[/C][C]1.6291[/C][C]0.053114[/C][/ROW]
[ROW][C]38[/C][C]0.03176[/C][C]0.3285[/C][C]0.371577[/C][/ROW]
[ROW][C]39[/C][C]-0.02924[/C][C]-0.3025[/C][C]0.381443[/C][/ROW]
[ROW][C]40[/C][C]-0.013471[/C][C]-0.1393[/C][C]0.444718[/C][/ROW]
[ROW][C]41[/C][C]-0.08463[/C][C]-0.8754[/C][C]0.191655[/C][/ROW]
[ROW][C]42[/C][C]-0.066545[/C][C]-0.6883[/C][C]0.246361[/C][/ROW]
[ROW][C]43[/C][C]-0.033048[/C][C]-0.3419[/C][C]0.366567[/C][/ROW]
[ROW][C]44[/C][C]-0.083825[/C][C]-0.8671[/C][C]0.193915[/C][/ROW]
[ROW][C]45[/C][C]0.057514[/C][C]0.5949[/C][C]0.276572[/C][/ROW]
[ROW][C]46[/C][C]0.01795[/C][C]0.1857[/C][C]0.426525[/C][/ROW]
[ROW][C]47[/C][C]0.046296[/C][C]0.4789[/C][C]0.316499[/C][/ROW]
[ROW][C]48[/C][C]0.072738[/C][C]0.7524[/C][C]0.226728[/C][/ROW]
[/TABLE]
Source: https://freestatistics.org/blog/index.php?pk=301208&T=1

Globally Unique Identifier (entire table): ba.freestatistics.org/blog/index.php?pk=301208&T=1

As an alternative you can also use a QR Code:  

The GUIDs for individual cells are displayed in the table below:

Autocorrelation Function
Time lag kACF(k)T-STATP-value
1-0.36759-3.80240.000119
20.0426210.44090.330098
30.1632861.6890.047062
4-0.113373-1.17270.121753
5-0.210485-2.17730.015828
60.0081650.08450.466424
7-0.10953-1.1330.129875
8-0.209987-2.17210.016027
90.0807840.83560.202611
100.0438880.4540.325381
110.1231041.27340.102819
120.0430490.44530.3285
130.1321821.36730.087198
140.1251881.2950.099061
15-0.043848-0.45360.325528
16-0.052655-0.54470.293559
17-0.094393-0.97640.165532
18-0.057039-0.590.278214
19-0.046272-0.47860.316583
20-0.183024-1.89320.030515
210.1098711.13650.129141
220.0255870.26470.395886
23-0.032455-0.33570.368871
240.2290792.36960.009799
250.0420330.43480.332293
26-0.045257-0.46810.320319
270.1288161.33250.092766
28-0.05912-0.61150.271069
29-0.108003-1.11720.133207
30-0.097679-1.01040.157292
31-0.054913-0.5680.285605
32-0.03251-0.33630.368657
330.0152230.15750.437585
34-0.028121-0.29090.38585
350.1464371.51480.066392
36-0.02411-0.24940.401766
370.1574931.62910.053114
380.031760.32850.371577
39-0.02924-0.30250.381443
40-0.013471-0.13930.444718
41-0.08463-0.87540.191655
42-0.066545-0.68830.246361
43-0.033048-0.34190.366567
44-0.083825-0.86710.193915
450.0575140.59490.276572
460.017950.18570.426525
470.0462960.47890.316499
480.0727380.75240.226728


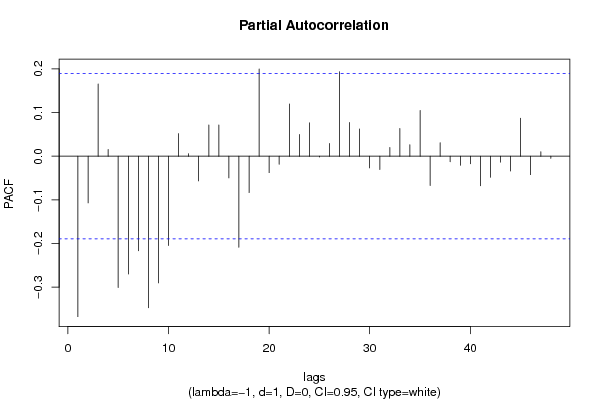
Partial Autocorrelation Function
Time lag kPACF(k)T-STATP-value
1-0.36759-3.80240.000119
2-0.106954-1.10630.13553
30.1652821.70970.045111
40.0151880.15710.437729
5-0.300958-3.11310.001187
6-0.270064-2.79360.003089
7-0.216467-2.23920.013607
8-0.347299-3.59250.000248
9-0.290179-3.00160.001671
10-0.204682-2.11720.018278
110.0516660.53440.297074
120.0055570.05750.477132
13-0.056548-0.58490.27991
140.07150.73960.230581
150.0716570.74120.23009
16-0.049676-0.51390.304207
17-0.208765-2.15950.016523
18-0.083397-0.86270.195127
190.1998912.06770.020541
20-0.037679-0.38980.348745
21-0.01842-0.19050.424623
220.1194321.23540.109692
230.0496840.51390.304178
240.076330.78960.215764
25-0.001851-0.01910.49238
260.0290490.30050.382196
270.1935732.00230.023889
280.07740.80060.21256
290.0623150.64460.260286
30-0.026792-0.27710.391104
31-0.030545-0.3160.376324
320.019770.20450.419175
330.0635640.65750.256131
340.0263830.27290.392727
350.1045671.08160.14092
36-0.067227-0.69540.244156
370.030790.31850.375366
38-0.012903-0.13350.447038
39-0.020832-0.21550.4149
40-0.017347-0.17940.428965
41-0.06761-0.69940.242922
42-0.048162-0.49820.309685
43-0.013547-0.14010.444409
44-0.033898-0.35060.363273
450.086940.89930.185252
46-0.042323-0.43780.331211
470.0103130.10670.45762
48-0.004917-0.05090.479765

\begin{tabular}{lllllllll}
\hline
Partial Autocorrelation Function \tabularnewline
Time lag k & PACF(k) & T-STAT & P-value \tabularnewline
1 & -0.36759 & -3.8024 & 0.000119 \tabularnewline
2 & -0.106954 & -1.1063 & 0.13553 \tabularnewline
3 & 0.165282 & 1.7097 & 0.045111 \tabularnewline
4 & 0.015188 & 0.1571 & 0.437729 \tabularnewline
5 & -0.300958 & -3.1131 & 0.001187 \tabularnewline
6 & -0.270064 & -2.7936 & 0.003089 \tabularnewline
7 & -0.216467 & -2.2392 & 0.013607 \tabularnewline
8 & -0.347299 & -3.5925 & 0.000248 \tabularnewline
9 & -0.290179 & -3.0016 & 0.001671 \tabularnewline
10 & -0.204682 & -2.1172 & 0.018278 \tabularnewline
11 & 0.051666 & 0.5344 & 0.297074 \tabularnewline
12 & 0.005557 & 0.0575 & 0.477132 \tabularnewline
13 & -0.056548 & -0.5849 & 0.27991 \tabularnewline
14 & 0.0715 & 0.7396 & 0.230581 \tabularnewline
15 & 0.071657 & 0.7412 & 0.23009 \tabularnewline
16 & -0.049676 & -0.5139 & 0.304207 \tabularnewline
17 & -0.208765 & -2.1595 & 0.016523 \tabularnewline
18 & -0.083397 & -0.8627 & 0.195127 \tabularnewline
19 & 0.199891 & 2.0677 & 0.020541 \tabularnewline
20 & -0.037679 & -0.3898 & 0.348745 \tabularnewline
21 & -0.01842 & -0.1905 & 0.424623 \tabularnewline
22 & 0.119432 & 1.2354 & 0.109692 \tabularnewline
23 & 0.049684 & 0.5139 & 0.304178 \tabularnewline
24 & 0.07633 & 0.7896 & 0.215764 \tabularnewline
25 & -0.001851 & -0.0191 & 0.49238 \tabularnewline
26 & 0.029049 & 0.3005 & 0.382196 \tabularnewline
27 & 0.193573 & 2.0023 & 0.023889 \tabularnewline
28 & 0.0774 & 0.8006 & 0.21256 \tabularnewline
29 & 0.062315 & 0.6446 & 0.260286 \tabularnewline
30 & -0.026792 & -0.2771 & 0.391104 \tabularnewline
31 & -0.030545 & -0.316 & 0.376324 \tabularnewline
32 & 0.01977 & 0.2045 & 0.419175 \tabularnewline
33 & 0.063564 & 0.6575 & 0.256131 \tabularnewline
34 & 0.026383 & 0.2729 & 0.392727 \tabularnewline
35 & 0.104567 & 1.0816 & 0.14092 \tabularnewline
36 & -0.067227 & -0.6954 & 0.244156 \tabularnewline
37 & 0.03079 & 0.3185 & 0.375366 \tabularnewline
38 & -0.012903 & -0.1335 & 0.447038 \tabularnewline
39 & -0.020832 & -0.2155 & 0.4149 \tabularnewline
40 & -0.017347 & -0.1794 & 0.428965 \tabularnewline
41 & -0.06761 & -0.6994 & 0.242922 \tabularnewline
42 & -0.048162 & -0.4982 & 0.309685 \tabularnewline
43 & -0.013547 & -0.1401 & 0.444409 \tabularnewline
44 & -0.033898 & -0.3506 & 0.363273 \tabularnewline
45 & 0.08694 & 0.8993 & 0.185252 \tabularnewline
46 & -0.042323 & -0.4378 & 0.331211 \tabularnewline
47 & 0.010313 & 0.1067 & 0.45762 \tabularnewline
48 & -0.004917 & -0.0509 & 0.479765 \tabularnewline
\hline
\end{tabular}
%Source: https://freestatistics.org/blog/index.php?pk=301208&T=2

[TABLE]
[ROW][C]Partial Autocorrelation Function[/C][/ROW]
[ROW][C]Time lag k[/C][C]PACF(k)[/C][C]T-STAT[/C][C]P-value[/C][/ROW]
[ROW][C]1[/C][C]-0.36759[/C][C]-3.8024[/C][C]0.000119[/C][/ROW]
[ROW][C]2[/C][C]-0.106954[/C][C]-1.1063[/C][C]0.13553[/C][/ROW]
[ROW][C]3[/C][C]0.165282[/C][C]1.7097[/C][C]0.045111[/C][/ROW]
[ROW][C]4[/C][C]0.015188[/C][C]0.1571[/C][C]0.437729[/C][/ROW]
[ROW][C]5[/C][C]-0.300958[/C][C]-3.1131[/C][C]0.001187[/C][/ROW]
[ROW][C]6[/C][C]-0.270064[/C][C]-2.7936[/C][C]0.003089[/C][/ROW]
[ROW][C]7[/C][C]-0.216467[/C][C]-2.2392[/C][C]0.013607[/C][/ROW]
[ROW][C]8[/C][C]-0.347299[/C][C]-3.5925[/C][C]0.000248[/C][/ROW]
[ROW][C]9[/C][C]-0.290179[/C][C]-3.0016[/C][C]0.001671[/C][/ROW]
[ROW][C]10[/C][C]-0.204682[/C][C]-2.1172[/C][C]0.018278[/C][/ROW]
[ROW][C]11[/C][C]0.051666[/C][C]0.5344[/C][C]0.297074[/C][/ROW]
[ROW][C]12[/C][C]0.005557[/C][C]0.0575[/C][C]0.477132[/C][/ROW]
[ROW][C]13[/C][C]-0.056548[/C][C]-0.5849[/C][C]0.27991[/C][/ROW]
[ROW][C]14[/C][C]0.0715[/C][C]0.7396[/C][C]0.230581[/C][/ROW]
[ROW][C]15[/C][C]0.071657[/C][C]0.7412[/C][C]0.23009[/C][/ROW]
[ROW][C]16[/C][C]-0.049676[/C][C]-0.5139[/C][C]0.304207[/C][/ROW]
[ROW][C]17[/C][C]-0.208765[/C][C]-2.1595[/C][C]0.016523[/C][/ROW]
[ROW][C]18[/C][C]-0.083397[/C][C]-0.8627[/C][C]0.195127[/C][/ROW]
[ROW][C]19[/C][C]0.199891[/C][C]2.0677[/C][C]0.020541[/C][/ROW]
[ROW][C]20[/C][C]-0.037679[/C][C]-0.3898[/C][C]0.348745[/C][/ROW]
[ROW][C]21[/C][C]-0.01842[/C][C]-0.1905[/C][C]0.424623[/C][/ROW]
[ROW][C]22[/C][C]0.119432[/C][C]1.2354[/C][C]0.109692[/C][/ROW]
[ROW][C]23[/C][C]0.049684[/C][C]0.5139[/C][C]0.304178[/C][/ROW]
[ROW][C]24[/C][C]0.07633[/C][C]0.7896[/C][C]0.215764[/C][/ROW]
[ROW][C]25[/C][C]-0.001851[/C][C]-0.0191[/C][C]0.49238[/C][/ROW]
[ROW][C]26[/C][C]0.029049[/C][C]0.3005[/C][C]0.382196[/C][/ROW]
[ROW][C]27[/C][C]0.193573[/C][C]2.0023[/C][C]0.023889[/C][/ROW]
[ROW][C]28[/C][C]0.0774[/C][C]0.8006[/C][C]0.21256[/C][/ROW]
[ROW][C]29[/C][C]0.062315[/C][C]0.6446[/C][C]0.260286[/C][/ROW]
[ROW][C]30[/C][C]-0.026792[/C][C]-0.2771[/C][C]0.391104[/C][/ROW]
[ROW][C]31[/C][C]-0.030545[/C][C]-0.316[/C][C]0.376324[/C][/ROW]
[ROW][C]32[/C][C]0.01977[/C][C]0.2045[/C][C]0.419175[/C][/ROW]
[ROW][C]33[/C][C]0.063564[/C][C]0.6575[/C][C]0.256131[/C][/ROW]
[ROW][C]34[/C][C]0.026383[/C][C]0.2729[/C][C]0.392727[/C][/ROW]
[ROW][C]35[/C][C]0.104567[/C][C]1.0816[/C][C]0.14092[/C][/ROW]
[ROW][C]36[/C][C]-0.067227[/C][C]-0.6954[/C][C]0.244156[/C][/ROW]
[ROW][C]37[/C][C]0.03079[/C][C]0.3185[/C][C]0.375366[/C][/ROW]
[ROW][C]38[/C][C]-0.012903[/C][C]-0.1335[/C][C]0.447038[/C][/ROW]
[ROW][C]39[/C][C]-0.020832[/C][C]-0.2155[/C][C]0.4149[/C][/ROW]
[ROW][C]40[/C][C]-0.017347[/C][C]-0.1794[/C][C]0.428965[/C][/ROW]
[ROW][C]41[/C][C]-0.06761[/C][C]-0.6994[/C][C]0.242922[/C][/ROW]
[ROW][C]42[/C][C]-0.048162[/C][C]-0.4982[/C][C]0.309685[/C][/ROW]
[ROW][C]43[/C][C]-0.013547[/C][C]-0.1401[/C][C]0.444409[/C][/ROW]
[ROW][C]44[/C][C]-0.033898[/C][C]-0.3506[/C][C]0.363273[/C][/ROW]
[ROW][C]45[/C][C]0.08694[/C][C]0.8993[/C][C]0.185252[/C][/ROW]
[ROW][C]46[/C][C]-0.042323[/C][C]-0.4378[/C][C]0.331211[/C][/ROW]
[ROW][C]47[/C][C]0.010313[/C][C]0.1067[/C][C]0.45762[/C][/ROW]
[ROW][C]48[/C][C]-0.004917[/C][C]-0.0509[/C][C]0.479765[/C][/ROW]
[/TABLE]
Source: https://freestatistics.org/blog/index.php?pk=301208&T=2

Globally Unique Identifier (entire table): ba.freestatistics.org/blog/index.php?pk=301208&T=2

As an alternative you can also use a QR Code:  

The GUIDs for individual cells are displayed in the table below:

Partial Autocorrelation Function
Time lag kPACF(k)T-STATP-value
1-0.36759-3.80240.000119
2-0.106954-1.10630.13553
30.1652821.70970.045111
40.0151880.15710.437729
5-0.300958-3.11310.001187
6-0.270064-2.79360.003089
7-0.216467-2.23920.013607
8-0.347299-3.59250.000248
9-0.290179-3.00160.001671
10-0.204682-2.11720.018278
110.0516660.53440.297074
120.0055570.05750.477132
13-0.056548-0.58490.27991
140.07150.73960.230581
150.0716570.74120.23009
16-0.049676-0.51390.304207
17-0.208765-2.15950.016523
18-0.083397-0.86270.195127
190.1998912.06770.020541
20-0.037679-0.38980.348745
21-0.01842-0.19050.424623
220.1194321.23540.109692
230.0496840.51390.304178
240.076330.78960.215764
25-0.001851-0.01910.49238
260.0290490.30050.382196
270.1935732.00230.023889
280.07740.80060.21256
290.0623150.64460.260286
30-0.026792-0.27710.391104
31-0.030545-0.3160.376324
320.019770.20450.419175
330.0635640.65750.256131
340.0263830.27290.392727
350.1045671.08160.14092
36-0.067227-0.69540.244156
370.030790.31850.375366
38-0.012903-0.13350.447038
39-0.020832-0.21550.4149
40-0.017347-0.17940.428965
41-0.06761-0.69940.242922
42-0.048162-0.49820.309685
43-0.013547-0.14010.444409
44-0.033898-0.35060.363273
450.086940.89930.185252
46-0.042323-0.43780.331211
470.0103130.10670.45762
48-0.004917-0.05090.479765


Parameters (Session):
par4 = 12 ;
Parameters (R input):
par1 = 48 ; par2 = -1.0 ; par3 = 1 ; par4 = 0 ; par5 = 12 ; par6 = White Noise ; par7 = 0.95 ; par8 = ;
R code (references can be found in the software module):
if (par1 == 'Default') {
par1 = 10*log10(length(x))
} else {
par1 <- as.numeric(par1)
}
par2 <- as.numeric(par2)
par3 <- as.numeric(par3)
par4 <- as.numeric(par4)
par5 <- as.numeric(par5)
if (par6 == 'White Noise') par6 <- 'white' else par6 <- 'ma'
par7 <- as.numeric(par7)
if (par8 != '') par8 <- as.numeric(par8)
x <- na.omit(x)
ox <- x
if (par8 == '') {
if (par2 == 0) {
x <- log(x)
} else {
x <- (x ^ par2 - 1) / par2
}
} else {
x <- log(x,base=par8)
}
if (par3 > 0) x <- diff(x,lag=1,difference=par3)
if (par4 > 0) x <- diff(x,lag=par5,difference=par4)
bitmap(file='picts.png')
op <- par(mfrow=c(2,1))
plot(ox,type='l',main='Original Time Series',xlab='time',ylab='value')
if (par8=='') {
mytitle <- paste('Working Time Series (lambda=',par2,', d=',par3,', D=',par4,')',sep='')
mysub <- paste('(lambda=',par2,', d=',par3,', D=',par4,', CI=', par7, ', CI type=',par6,')',sep='')
} else {
mytitle <- paste('Working Time Series (base=',par8,', d=',par3,', D=',par4,')',sep='')
mysub <- paste('(base=',par8,', d=',par3,', D=',par4,', CI=', par7, ', CI type=',par6,')',sep='')
}
plot(x,type='l', main=mytitle,xlab='time',ylab='value')
par(op)
dev.off()
bitmap(file='pic1.png')
racf <- acf(x, par1, main='Autocorrelation', xlab='time lag', ylab='ACF', ci.type=par6, ci=par7, sub=mysub)
dev.off()
bitmap(file='pic2.png')
rpacf <- pacf(x,par1,main='Partial Autocorrelation',xlab='lags',ylab='PACF',sub=mysub)
dev.off()
(myacf <- c(racf$acf))
(mypacf <- c(rpacf$acf))
lengthx <- length(x)
sqrtn <- sqrt(lengthx)
load(file='createtable')
a<-table.start()
a<-table.row.start(a)
a<-table.element(a,'Autocorrelation Function',4,TRUE)
a<-table.row.end(a)
a<-table.row.start(a)
a<-table.element(a,'Time lag k',header=TRUE)
a<-table.element(a,'ACF(k)',header=TRUE)
a<-table.element(a,'T-STAT',header=TRUE)
a<-table.element(a,'P-value',header=TRUE)
a<-table.row.end(a)
for (i in 2:(par1+1)) {
a<-table.row.start(a)
a<-table.element(a,i-1,header=TRUE)
a<-table.element(a,round(myacf[i],6))
mytstat <- myacf[i]*sqrtn
a<-table.element(a,round(mytstat,4))
a<-table.element(a,round(1-pt(abs(mytstat),lengthx),6))
a<-table.row.end(a)
}
a<-table.end(a)
table.save(a,file='mytable.tab')
a<-table.start()
a<-table.row.start(a)
a<-table.element(a,'Partial Autocorrelation Function',4,TRUE)
a<-table.row.end(a)
a<-table.row.start(a)
a<-table.element(a,'Time lag k',header=TRUE)
a<-table.element(a,'PACF(k)',header=TRUE)
a<-table.element(a,'T-STAT',header=TRUE)
a<-table.element(a,'P-value',header=TRUE)
a<-table.row.end(a)
for (i in 1:par1) {
a<-table.row.start(a)
a<-table.element(a,i,header=TRUE)
a<-table.element(a,round(mypacf[i],6))
mytstat <- mypacf[i]*sqrtn
a<-table.element(a,round(mytstat,4))
a<-table.element(a,round(1-pt(abs(mytstat),lengthx),6))
a<-table.row.end(a)
}
a<-table.end(a)
table.save(a,file='mytable1.tab')