Free Statistics

of Irreproducible Research!

Author's title

Author*The author of this computation has been verified*
R Software Modulerwasp_structuraltimeseries.wasp
Title produced by softwareStructural Time Series Models
Date of computationSun, 18 Dec 2016 17:42:08 +0100
Cite this page as followsStatistical Computations at FreeStatistics.org, Office for Research Development and Education, URL https://freestatistics.org/blog/index.php?v=date/2016/Dec/18/t1482079398vir83y2c0bs1i52.htm/, Retrieved Fri, 01 Nov 2024 03:26:24 +0000
Statistical Computations at FreeStatistics.org, Office for Research Development and Education, URL https://freestatistics.org/blog/index.php?pk=301173, Retrieved Fri, 01 Nov 2024 03:26:24 +0000
QR Codes:

Original text written by user:
IsPrivate?No (this computation is public)
User-defined keywords
Estimated Impact114
Family? (F = Feedback message, R = changed R code, M = changed R Module, P = changed Parameters, D = changed Data)
-       [Structural Time Series Models] [structural time s...] [2016-12-18 16:42:08] [84a79156fb687334cf7dc390d7b82d5a] [Current]
Feedback Forum

Post a new message
Dataseries X:
5283.5
5298.3
5313
5332.2
5348.9
5411.6
5474.6
5463.6
5477.3
5530.4
5584.1
5605.5
5626.6
5659
5697.6
5705.9
5633.3
5671.2
5709.5
5723.8
5754.2
5775.7
5803.6
5846.5
5849.6
5866
5900
5949.6
5886.2
5896.7
5913.4
5963.1
5905.2
5912.2
5928.9
5990.6
5853.6
5976.1
6002.5
6091.9
5917.8
6010.3
6087.7
6192.9


Summary of computational transaction
Raw Input view raw input (R code)
Raw Outputview raw output of R engine
Computing time3 seconds
R ServerBig Analytics Cloud Computing Center

\begin{tabular}{lllllllll}
\hline
Summary of computational transaction \tabularnewline
Raw Input view raw input (R code)  \tabularnewline
Raw Outputview raw output of R engine  \tabularnewline
Computing time3 seconds \tabularnewline
R ServerBig Analytics Cloud Computing Center \tabularnewline
\hline
\end{tabular}
%Source: https://freestatistics.org/blog/index.php?pk=301173&T=0

[TABLE]
[ROW]
Summary of computational transaction[/C][/ROW] [ROW]Raw Input[/C] view raw input (R code) [/C][/ROW] [ROW]Raw Output[/C]view raw output of R engine [/C][/ROW] [ROW]Computing time[/C]3 seconds[/C][/ROW] [ROW]R Server[/C]Big Analytics Cloud Computing Center[/C][/ROW] [/TABLE] Source: https://freestatistics.org/blog/index.php?pk=301173&T=0

Globally Unique Identifier (entire table): ba.freestatistics.org/blog/index.php?pk=301173&T=0

As an alternative you can also use a QR Code:  

The GUIDs for individual cells are displayed in the table below:

Summary of computational transaction
Raw Input view raw input (R code)
Raw Outputview raw output of R engine
Computing time3 seconds
R ServerBig Analytics Cloud Computing Center


Structural Time Series Model -- Interpolation
tObservedLevelSlopeSeasonalStand. Residuals
15283.55283.5000
25298.35295.55369224372.976330767660032.746307756298050.127283314214684
353135306.379000001484.334381992545996.62099999851690.325770100706941
45332.25323.844657827366.158352822882118.355342172640030.565677517022681
55348.95350.437531501297.59167100907965-1.537531501286630.897602508093553
65411.65398.8349964135814.499286650020512.76500358642461.52228760635412
75474.65455.2960341519522.023452769098419.30396584805331.62895330960831
85463.65467.7790002996420.4176648524489-4.17900029964253-0.378245574222207
95477.35492.9573665570921.1813042555555-15.65736655708750.188309620988489
105530.45526.0737493144423.27233546950324.326250685562640.461371735935579
115584.15558.8650097096724.981140088961625.2349902903270.367730636443777
125605.55603.7474580648628.50875722365541.752541935142780.773775798543187
135626.65643.2016512281430.4320204002582-16.60165122813520.425067509673477
1456595663.5262811646428.631558113524-4.5262811646361-0.391320130782318
155697.65682.4942304985726.899421283062615.1057695014342-0.373629143135766
165705.95707.3764212057426.5386308449537-1.47642120573604-0.0781202984702007
175633.35672.2330702677615.5276270942656-38.93307026776-2.38791803589916
185671.25674.3611877772513.1303491470127-3.16118777724523-0.518555228455105
195709.55689.2786469706113.450525672763720.22135302939020.0691288833867462
205723.85704.657675451313.795921575863219.14232454870320.0746257828687867
215754.25768.1522698634322.6932503533199-13.9522698634271.92299609040699
225775.75785.0809262371221.6608797312787-9.38092623712211-0.223043339465281
235803.65792.116408931519.04086072140611.4835910685009-0.565819045346118
245846.55832.6353826203122.888332138246413.86461737969210.83099686864173
255849.65860.3734362399223.7570077167052-10.77343623992290.187634591425193
2658665875.6839550097922.244004625457-9.68395500979168-0.326792701209526
2759005895.8177351053721.86598094572174.18226489462619-0.0816419566870141
285949.65931.0693841107724.263870038357618.53061588922970.517882447985775
295886.25912.9739189141716.6758168447692-26.7739189141703-1.63884936493137
305896.75911.3911883931113.4050427290858-14.6911883931088-0.706409375363924
315913.45914.5874835198611.5762598317334-1.18748351986112-0.394966582298598
325963.15928.7385563999212.037508956411434.36144360008260.0996172874578538
335905.25930.353299141510.1703928627858-25.1532991415045-0.403247646770272
345912.25928.318120829827.9839064660267-16.1181208298197-0.472222900705903
355928.95931.616005130487.14445796736373-2.71600513048108-0.181297922128107
365990.65948.14776816018.8260891964252642.45223183990340.36318641551682
375853.65899.56416465223-1.45821149585382-45.9641646522315-2.22112948674641
385976.15960.998901133529.8083532043922715.10109886647742.43327180477298
396002.55997.9646830092814.67330352927224.535316990724161.0506963886225
406091.96029.1623366222217.633456724697762.73766337777580.639312214811512
415917.86003.87539327499.94474622341781-86.0753932748952-1.66055161906447
426010.36005.339106477768.425463858910474.96089352224334-0.32812352983529
436087.76064.4006972584217.496361356508423.29930274157811.9590660899994
446192.96108.3584755304722.236629237844284.54152446953061.02376836338634

\begin{tabular}{lllllllll}
\hline
Structural Time Series Model -- Interpolation \tabularnewline
t & Observed & Level & Slope & Seasonal & Stand. Residuals \tabularnewline
1 & 5283.5 & 5283.5 & 0 & 0 & 0 \tabularnewline
2 & 5298.3 & 5295.5536922437 & 2.97633076766003 & 2.74630775629805 & 0.127283314214684 \tabularnewline
3 & 5313 & 5306.37900000148 & 4.33438199254599 & 6.6209999985169 & 0.325770100706941 \tabularnewline
4 & 5332.2 & 5323.84465782736 & 6.15835282288211 & 8.35534217264003 & 0.565677517022681 \tabularnewline
5 & 5348.9 & 5350.43753150129 & 7.59167100907965 & -1.53753150128663 & 0.897602508093553 \tabularnewline
6 & 5411.6 & 5398.83499641358 & 14.4992866500205 & 12.7650035864246 & 1.52228760635412 \tabularnewline
7 & 5474.6 & 5455.29603415195 & 22.0234527690984 & 19.3039658480533 & 1.62895330960831 \tabularnewline
8 & 5463.6 & 5467.77900029964 & 20.4176648524489 & -4.17900029964253 & -0.378245574222207 \tabularnewline
9 & 5477.3 & 5492.95736655709 & 21.1813042555555 & -15.6573665570875 & 0.188309620988489 \tabularnewline
10 & 5530.4 & 5526.07374931444 & 23.2723354695032 & 4.32625068556264 & 0.461371735935579 \tabularnewline
11 & 5584.1 & 5558.86500970967 & 24.9811400889616 & 25.234990290327 & 0.367730636443777 \tabularnewline
12 & 5605.5 & 5603.74745806486 & 28.5087572236554 & 1.75254193514278 & 0.773775798543187 \tabularnewline
13 & 5626.6 & 5643.20165122814 & 30.4320204002582 & -16.6016512281352 & 0.425067509673477 \tabularnewline
14 & 5659 & 5663.52628116464 & 28.631558113524 & -4.5262811646361 & -0.391320130782318 \tabularnewline
15 & 5697.6 & 5682.49423049857 & 26.8994212830626 & 15.1057695014342 & -0.373629143135766 \tabularnewline
16 & 5705.9 & 5707.37642120574 & 26.5386308449537 & -1.47642120573604 & -0.0781202984702007 \tabularnewline
17 & 5633.3 & 5672.23307026776 & 15.5276270942656 & -38.93307026776 & -2.38791803589916 \tabularnewline
18 & 5671.2 & 5674.36118777725 & 13.1303491470127 & -3.16118777724523 & -0.518555228455105 \tabularnewline
19 & 5709.5 & 5689.27864697061 & 13.4505256727637 & 20.2213530293902 & 0.0691288833867462 \tabularnewline
20 & 5723.8 & 5704.6576754513 & 13.7959215758632 & 19.1423245487032 & 0.0746257828687867 \tabularnewline
21 & 5754.2 & 5768.15226986343 & 22.6932503533199 & -13.952269863427 & 1.92299609040699 \tabularnewline
22 & 5775.7 & 5785.08092623712 & 21.6608797312787 & -9.38092623712211 & -0.223043339465281 \tabularnewline
23 & 5803.6 & 5792.1164089315 & 19.040860721406 & 11.4835910685009 & -0.565819045346118 \tabularnewline
24 & 5846.5 & 5832.63538262031 & 22.8883321382464 & 13.8646173796921 & 0.83099686864173 \tabularnewline
25 & 5849.6 & 5860.37343623992 & 23.7570077167052 & -10.7734362399229 & 0.187634591425193 \tabularnewline
26 & 5866 & 5875.68395500979 & 22.244004625457 & -9.68395500979168 & -0.326792701209526 \tabularnewline
27 & 5900 & 5895.81773510537 & 21.8659809457217 & 4.18226489462619 & -0.0816419566870141 \tabularnewline
28 & 5949.6 & 5931.06938411077 & 24.2638700383576 & 18.5306158892297 & 0.517882447985775 \tabularnewline
29 & 5886.2 & 5912.97391891417 & 16.6758168447692 & -26.7739189141703 & -1.63884936493137 \tabularnewline
30 & 5896.7 & 5911.39118839311 & 13.4050427290858 & -14.6911883931088 & -0.706409375363924 \tabularnewline
31 & 5913.4 & 5914.58748351986 & 11.5762598317334 & -1.18748351986112 & -0.394966582298598 \tabularnewline
32 & 5963.1 & 5928.73855639992 & 12.0375089564114 & 34.3614436000826 & 0.0996172874578538 \tabularnewline
33 & 5905.2 & 5930.3532991415 & 10.1703928627858 & -25.1532991415045 & -0.403247646770272 \tabularnewline
34 & 5912.2 & 5928.31812082982 & 7.9839064660267 & -16.1181208298197 & -0.472222900705903 \tabularnewline
35 & 5928.9 & 5931.61600513048 & 7.14445796736373 & -2.71600513048108 & -0.181297922128107 \tabularnewline
36 & 5990.6 & 5948.1477681601 & 8.82608919642526 & 42.4522318399034 & 0.36318641551682 \tabularnewline
37 & 5853.6 & 5899.56416465223 & -1.45821149585382 & -45.9641646522315 & -2.22112948674641 \tabularnewline
38 & 5976.1 & 5960.99890113352 & 9.80835320439227 & 15.1010988664774 & 2.43327180477298 \tabularnewline
39 & 6002.5 & 5997.96468300928 & 14.6733035292722 & 4.53531699072416 & 1.0506963886225 \tabularnewline
40 & 6091.9 & 6029.16233662222 & 17.6334567246977 & 62.7376633777758 & 0.639312214811512 \tabularnewline
41 & 5917.8 & 6003.8753932749 & 9.94474622341781 & -86.0753932748952 & -1.66055161906447 \tabularnewline
42 & 6010.3 & 6005.33910647776 & 8.42546385891047 & 4.96089352224334 & -0.32812352983529 \tabularnewline
43 & 6087.7 & 6064.40069725842 & 17.4963613565084 & 23.2993027415781 & 1.9590660899994 \tabularnewline
44 & 6192.9 & 6108.35847553047 & 22.2366292378442 & 84.5415244695306 & 1.02376836338634 \tabularnewline
\hline
\end{tabular}
%Source: https://freestatistics.org/blog/index.php?pk=301173&T=1

[TABLE]
[ROW][C]Structural Time Series Model -- Interpolation[/C][/ROW]
[ROW][C]t[/C][C]Observed[/C][C]Level[/C][C]Slope[/C][C]Seasonal[/C][C]Stand. Residuals[/C][/ROW]
[ROW][C]1[/C][C]5283.5[/C][C]5283.5[/C][C]0[/C][C]0[/C][C]0[/C][/ROW]
[ROW][C]2[/C][C]5298.3[/C][C]5295.5536922437[/C][C]2.97633076766003[/C][C]2.74630775629805[/C][C]0.127283314214684[/C][/ROW]
[ROW][C]3[/C][C]5313[/C][C]5306.37900000148[/C][C]4.33438199254599[/C][C]6.6209999985169[/C][C]0.325770100706941[/C][/ROW]
[ROW][C]4[/C][C]5332.2[/C][C]5323.84465782736[/C][C]6.15835282288211[/C][C]8.35534217264003[/C][C]0.565677517022681[/C][/ROW]
[ROW][C]5[/C][C]5348.9[/C][C]5350.43753150129[/C][C]7.59167100907965[/C][C]-1.53753150128663[/C][C]0.897602508093553[/C][/ROW]
[ROW][C]6[/C][C]5411.6[/C][C]5398.83499641358[/C][C]14.4992866500205[/C][C]12.7650035864246[/C][C]1.52228760635412[/C][/ROW]
[ROW][C]7[/C][C]5474.6[/C][C]5455.29603415195[/C][C]22.0234527690984[/C][C]19.3039658480533[/C][C]1.62895330960831[/C][/ROW]
[ROW][C]8[/C][C]5463.6[/C][C]5467.77900029964[/C][C]20.4176648524489[/C][C]-4.17900029964253[/C][C]-0.378245574222207[/C][/ROW]
[ROW][C]9[/C][C]5477.3[/C][C]5492.95736655709[/C][C]21.1813042555555[/C][C]-15.6573665570875[/C][C]0.188309620988489[/C][/ROW]
[ROW][C]10[/C][C]5530.4[/C][C]5526.07374931444[/C][C]23.2723354695032[/C][C]4.32625068556264[/C][C]0.461371735935579[/C][/ROW]
[ROW][C]11[/C][C]5584.1[/C][C]5558.86500970967[/C][C]24.9811400889616[/C][C]25.234990290327[/C][C]0.367730636443777[/C][/ROW]
[ROW][C]12[/C][C]5605.5[/C][C]5603.74745806486[/C][C]28.5087572236554[/C][C]1.75254193514278[/C][C]0.773775798543187[/C][/ROW]
[ROW][C]13[/C][C]5626.6[/C][C]5643.20165122814[/C][C]30.4320204002582[/C][C]-16.6016512281352[/C][C]0.425067509673477[/C][/ROW]
[ROW][C]14[/C][C]5659[/C][C]5663.52628116464[/C][C]28.631558113524[/C][C]-4.5262811646361[/C][C]-0.391320130782318[/C][/ROW]
[ROW][C]15[/C][C]5697.6[/C][C]5682.49423049857[/C][C]26.8994212830626[/C][C]15.1057695014342[/C][C]-0.373629143135766[/C][/ROW]
[ROW][C]16[/C][C]5705.9[/C][C]5707.37642120574[/C][C]26.5386308449537[/C][C]-1.47642120573604[/C][C]-0.0781202984702007[/C][/ROW]
[ROW][C]17[/C][C]5633.3[/C][C]5672.23307026776[/C][C]15.5276270942656[/C][C]-38.93307026776[/C][C]-2.38791803589916[/C][/ROW]
[ROW][C]18[/C][C]5671.2[/C][C]5674.36118777725[/C][C]13.1303491470127[/C][C]-3.16118777724523[/C][C]-0.518555228455105[/C][/ROW]
[ROW][C]19[/C][C]5709.5[/C][C]5689.27864697061[/C][C]13.4505256727637[/C][C]20.2213530293902[/C][C]0.0691288833867462[/C][/ROW]
[ROW][C]20[/C][C]5723.8[/C][C]5704.6576754513[/C][C]13.7959215758632[/C][C]19.1423245487032[/C][C]0.0746257828687867[/C][/ROW]
[ROW][C]21[/C][C]5754.2[/C][C]5768.15226986343[/C][C]22.6932503533199[/C][C]-13.952269863427[/C][C]1.92299609040699[/C][/ROW]
[ROW][C]22[/C][C]5775.7[/C][C]5785.08092623712[/C][C]21.6608797312787[/C][C]-9.38092623712211[/C][C]-0.223043339465281[/C][/ROW]
[ROW][C]23[/C][C]5803.6[/C][C]5792.1164089315[/C][C]19.040860721406[/C][C]11.4835910685009[/C][C]-0.565819045346118[/C][/ROW]
[ROW][C]24[/C][C]5846.5[/C][C]5832.63538262031[/C][C]22.8883321382464[/C][C]13.8646173796921[/C][C]0.83099686864173[/C][/ROW]
[ROW][C]25[/C][C]5849.6[/C][C]5860.37343623992[/C][C]23.7570077167052[/C][C]-10.7734362399229[/C][C]0.187634591425193[/C][/ROW]
[ROW][C]26[/C][C]5866[/C][C]5875.68395500979[/C][C]22.244004625457[/C][C]-9.68395500979168[/C][C]-0.326792701209526[/C][/ROW]
[ROW][C]27[/C][C]5900[/C][C]5895.81773510537[/C][C]21.8659809457217[/C][C]4.18226489462619[/C][C]-0.0816419566870141[/C][/ROW]
[ROW][C]28[/C][C]5949.6[/C][C]5931.06938411077[/C][C]24.2638700383576[/C][C]18.5306158892297[/C][C]0.517882447985775[/C][/ROW]
[ROW][C]29[/C][C]5886.2[/C][C]5912.97391891417[/C][C]16.6758168447692[/C][C]-26.7739189141703[/C][C]-1.63884936493137[/C][/ROW]
[ROW][C]30[/C][C]5896.7[/C][C]5911.39118839311[/C][C]13.4050427290858[/C][C]-14.6911883931088[/C][C]-0.706409375363924[/C][/ROW]
[ROW][C]31[/C][C]5913.4[/C][C]5914.58748351986[/C][C]11.5762598317334[/C][C]-1.18748351986112[/C][C]-0.394966582298598[/C][/ROW]
[ROW][C]32[/C][C]5963.1[/C][C]5928.73855639992[/C][C]12.0375089564114[/C][C]34.3614436000826[/C][C]0.0996172874578538[/C][/ROW]
[ROW][C]33[/C][C]5905.2[/C][C]5930.3532991415[/C][C]10.1703928627858[/C][C]-25.1532991415045[/C][C]-0.403247646770272[/C][/ROW]
[ROW][C]34[/C][C]5912.2[/C][C]5928.31812082982[/C][C]7.9839064660267[/C][C]-16.1181208298197[/C][C]-0.472222900705903[/C][/ROW]
[ROW][C]35[/C][C]5928.9[/C][C]5931.61600513048[/C][C]7.14445796736373[/C][C]-2.71600513048108[/C][C]-0.181297922128107[/C][/ROW]
[ROW][C]36[/C][C]5990.6[/C][C]5948.1477681601[/C][C]8.82608919642526[/C][C]42.4522318399034[/C][C]0.36318641551682[/C][/ROW]
[ROW][C]37[/C][C]5853.6[/C][C]5899.56416465223[/C][C]-1.45821149585382[/C][C]-45.9641646522315[/C][C]-2.22112948674641[/C][/ROW]
[ROW][C]38[/C][C]5976.1[/C][C]5960.99890113352[/C][C]9.80835320439227[/C][C]15.1010988664774[/C][C]2.43327180477298[/C][/ROW]
[ROW][C]39[/C][C]6002.5[/C][C]5997.96468300928[/C][C]14.6733035292722[/C][C]4.53531699072416[/C][C]1.0506963886225[/C][/ROW]
[ROW][C]40[/C][C]6091.9[/C][C]6029.16233662222[/C][C]17.6334567246977[/C][C]62.7376633777758[/C][C]0.639312214811512[/C][/ROW]
[ROW][C]41[/C][C]5917.8[/C][C]6003.8753932749[/C][C]9.94474622341781[/C][C]-86.0753932748952[/C][C]-1.66055161906447[/C][/ROW]
[ROW][C]42[/C][C]6010.3[/C][C]6005.33910647776[/C][C]8.42546385891047[/C][C]4.96089352224334[/C][C]-0.32812352983529[/C][/ROW]
[ROW][C]43[/C][C]6087.7[/C][C]6064.40069725842[/C][C]17.4963613565084[/C][C]23.2993027415781[/C][C]1.9590660899994[/C][/ROW]
[ROW][C]44[/C][C]6192.9[/C][C]6108.35847553047[/C][C]22.2366292378442[/C][C]84.5415244695306[/C][C]1.02376836338634[/C][/ROW]
[/TABLE]
Source: https://freestatistics.org/blog/index.php?pk=301173&T=1

Globally Unique Identifier (entire table): ba.freestatistics.org/blog/index.php?pk=301173&T=1

As an alternative you can also use a QR Code:  

The GUIDs for individual cells are displayed in the table below:

Structural Time Series Model -- Interpolation
tObservedLevelSlopeSeasonalStand. Residuals
15283.55283.5000
25298.35295.55369224372.976330767660032.746307756298050.127283314214684
353135306.379000001484.334381992545996.62099999851690.325770100706941
45332.25323.844657827366.158352822882118.355342172640030.565677517022681
55348.95350.437531501297.59167100907965-1.537531501286630.897602508093553
65411.65398.8349964135814.499286650020512.76500358642461.52228760635412
75474.65455.2960341519522.023452769098419.30396584805331.62895330960831
85463.65467.7790002996420.4176648524489-4.17900029964253-0.378245574222207
95477.35492.9573665570921.1813042555555-15.65736655708750.188309620988489
105530.45526.0737493144423.27233546950324.326250685562640.461371735935579
115584.15558.8650097096724.981140088961625.2349902903270.367730636443777
125605.55603.7474580648628.50875722365541.752541935142780.773775798543187
135626.65643.2016512281430.4320204002582-16.60165122813520.425067509673477
1456595663.5262811646428.631558113524-4.5262811646361-0.391320130782318
155697.65682.4942304985726.899421283062615.1057695014342-0.373629143135766
165705.95707.3764212057426.5386308449537-1.47642120573604-0.0781202984702007
175633.35672.2330702677615.5276270942656-38.93307026776-2.38791803589916
185671.25674.3611877772513.1303491470127-3.16118777724523-0.518555228455105
195709.55689.2786469706113.450525672763720.22135302939020.0691288833867462
205723.85704.657675451313.795921575863219.14232454870320.0746257828687867
215754.25768.1522698634322.6932503533199-13.9522698634271.92299609040699
225775.75785.0809262371221.6608797312787-9.38092623712211-0.223043339465281
235803.65792.116408931519.04086072140611.4835910685009-0.565819045346118
245846.55832.6353826203122.888332138246413.86461737969210.83099686864173
255849.65860.3734362399223.7570077167052-10.77343623992290.187634591425193
2658665875.6839550097922.244004625457-9.68395500979168-0.326792701209526
2759005895.8177351053721.86598094572174.18226489462619-0.0816419566870141
285949.65931.0693841107724.263870038357618.53061588922970.517882447985775
295886.25912.9739189141716.6758168447692-26.7739189141703-1.63884936493137
305896.75911.3911883931113.4050427290858-14.6911883931088-0.706409375363924
315913.45914.5874835198611.5762598317334-1.18748351986112-0.394966582298598
325963.15928.7385563999212.037508956411434.36144360008260.0996172874578538
335905.25930.353299141510.1703928627858-25.1532991415045-0.403247646770272
345912.25928.318120829827.9839064660267-16.1181208298197-0.472222900705903
355928.95931.616005130487.14445796736373-2.71600513048108-0.181297922128107
365990.65948.14776816018.8260891964252642.45223183990340.36318641551682
375853.65899.56416465223-1.45821149585382-45.9641646522315-2.22112948674641
385976.15960.998901133529.8083532043922715.10109886647742.43327180477298
396002.55997.9646830092814.67330352927224.535316990724161.0506963886225
406091.96029.1623366222217.633456724697762.73766337777580.639312214811512
415917.86003.87539327499.94474622341781-86.0753932748952-1.66055161906447
426010.36005.339106477768.425463858910474.96089352224334-0.32812352983529
436087.76064.4006972584217.496361356508423.29930274157811.9590660899994
446192.96108.3584755304722.236629237844284.54152446953061.02376836338634


Structural Time Series Model -- Extrapolation
tObservedLevelSeasonal
16044.602990106776128.59949918886-83.9965090820853
26135.905062614786146.63707014374-10.7320075289546
36177.065085943636164.6746410986212.3904448450176
46265.050283819526182.712212053582.3380717660223
56116.753273926296200.74978300838-83.9965090820853
66208.05534643436218.78735396326-10.7320075289546
76249.215369763156236.8249249181412.3904448450176
86337.200567639046254.8624958730282.3380717660223
96188.903557745816272.9000668279-83.9965090820853
106280.205630253826290.93763778278-10.7320075289546
116321.365653582676308.9752087376612.3904448450176
126409.350851458566327.0127796925482.3380717660223

\begin{tabular}{lllllllll}
\hline
Structural Time Series Model -- Extrapolation \tabularnewline
t & Observed & Level & Seasonal \tabularnewline
1 & 6044.60299010677 & 6128.59949918886 & -83.9965090820853 \tabularnewline
2 & 6135.90506261478 & 6146.63707014374 & -10.7320075289546 \tabularnewline
3 & 6177.06508594363 & 6164.67464109862 & 12.3904448450176 \tabularnewline
4 & 6265.05028381952 & 6182.7122120535 & 82.3380717660223 \tabularnewline
5 & 6116.75327392629 & 6200.74978300838 & -83.9965090820853 \tabularnewline
6 & 6208.0553464343 & 6218.78735396326 & -10.7320075289546 \tabularnewline
7 & 6249.21536976315 & 6236.82492491814 & 12.3904448450176 \tabularnewline
8 & 6337.20056763904 & 6254.86249587302 & 82.3380717660223 \tabularnewline
9 & 6188.90355774581 & 6272.9000668279 & -83.9965090820853 \tabularnewline
10 & 6280.20563025382 & 6290.93763778278 & -10.7320075289546 \tabularnewline
11 & 6321.36565358267 & 6308.97520873766 & 12.3904448450176 \tabularnewline
12 & 6409.35085145856 & 6327.01277969254 & 82.3380717660223 \tabularnewline
\hline
\end{tabular}
%Source: https://freestatistics.org/blog/index.php?pk=301173&T=2

[TABLE]
[ROW][C]Structural Time Series Model -- Extrapolation[/C][/ROW]
[ROW][C]t[/C][C]Observed[/C][C]Level[/C][C]Seasonal[/C][/ROW]
[ROW][C]1[/C][C]6044.60299010677[/C][C]6128.59949918886[/C][C]-83.9965090820853[/C][/ROW]
[ROW][C]2[/C][C]6135.90506261478[/C][C]6146.63707014374[/C][C]-10.7320075289546[/C][/ROW]
[ROW][C]3[/C][C]6177.06508594363[/C][C]6164.67464109862[/C][C]12.3904448450176[/C][/ROW]
[ROW][C]4[/C][C]6265.05028381952[/C][C]6182.7122120535[/C][C]82.3380717660223[/C][/ROW]
[ROW][C]5[/C][C]6116.75327392629[/C][C]6200.74978300838[/C][C]-83.9965090820853[/C][/ROW]
[ROW][C]6[/C][C]6208.0553464343[/C][C]6218.78735396326[/C][C]-10.7320075289546[/C][/ROW]
[ROW][C]7[/C][C]6249.21536976315[/C][C]6236.82492491814[/C][C]12.3904448450176[/C][/ROW]
[ROW][C]8[/C][C]6337.20056763904[/C][C]6254.86249587302[/C][C]82.3380717660223[/C][/ROW]
[ROW][C]9[/C][C]6188.90355774581[/C][C]6272.9000668279[/C][C]-83.9965090820853[/C][/ROW]
[ROW][C]10[/C][C]6280.20563025382[/C][C]6290.93763778278[/C][C]-10.7320075289546[/C][/ROW]
[ROW][C]11[/C][C]6321.36565358267[/C][C]6308.97520873766[/C][C]12.3904448450176[/C][/ROW]
[ROW][C]12[/C][C]6409.35085145856[/C][C]6327.01277969254[/C][C]82.3380717660223[/C][/ROW]
[/TABLE]
Source: https://freestatistics.org/blog/index.php?pk=301173&T=2

Globally Unique Identifier (entire table): ba.freestatistics.org/blog/index.php?pk=301173&T=2

As an alternative you can also use a QR Code:  

The GUIDs for individual cells are displayed in the table below:

Structural Time Series Model -- Extrapolation
tObservedLevelSeasonal
16044.602990106776128.59949918886-83.9965090820853
26135.905062614786146.63707014374-10.7320075289546
36177.065085943636164.6746410986212.3904448450176
46265.050283819526182.712212053582.3380717660223
56116.753273926296200.74978300838-83.9965090820853
66208.05534643436218.78735396326-10.7320075289546
76249.215369763156236.8249249181412.3904448450176
86337.200567639046254.8624958730282.3380717660223
96188.903557745816272.9000668279-83.9965090820853
106280.205630253826290.93763778278-10.7320075289546
116321.365653582676308.9752087376612.3904448450176
126409.350851458566327.0127796925482.3380717660223


Parameters (Session):
par1 = Default ; par2 = 1 ; par3 = 1 ; par4 = 0 ; par5 = 1 ; par6 = White Noise ; par7 = 0.95 ;
Parameters (R input):
par1 = 4 ; par2 = 12 ; par3 = BFGS ;
R code (references can be found in the software module):
par3 <- 'BFGS'
par2 <- '2'
par1 <- '4'
require('stsm')
require('stsm.class')
require('KFKSDS')
par1 <- as.numeric(par1)
par2 <- as.numeric(par2)
nx <- length(x)
x <- ts(x,frequency=par1)
m <- StructTS(x,type='BSM')
print(m$coef)
print(m$fitted)
print(m$resid)
mylevel <- as.numeric(m$fitted[,'level'])
myslope <- as.numeric(m$fitted[,'slope'])
myseas <- as.numeric(m$fitted[,'sea'])
myresid <- as.numeric(m$resid)
myfit <- mylevel+myseas
mm <- stsm.model(model = 'BSM', y = x, transPars = 'StructTS')
fit2 <- stsmFit(mm, stsm.method = 'maxlik.td.optim', method = par3, KF.args = list(P0cov = TRUE))
(fit2.comps <- tsSmooth(fit2, P0cov = FALSE)$states)
m2 <- set.pars(mm, pmax(fit2$par, .Machine$double.eps))
(ss <- char2numeric(m2))
(pred <- predict(ss, x, n.ahead = par2))
mylagmax <- nx/2
bitmap(file='test2.png')
op <- par(mfrow = c(2,2))
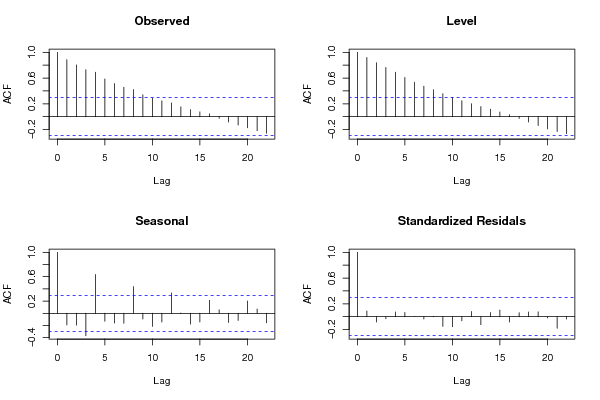
acf(as.numeric(x),lag.max = mylagmax,main='Observed')
acf(mylevel,na.action=na.pass,lag.max = mylagmax,main='Level')
acf(myseas,na.action=na.pass,lag.max = mylagmax,main='Seasonal')
acf(myresid,na.action=na.pass,lag.max = mylagmax,main='Standardized Residals')
par(op)
dev.off()
bitmap(file='test3.png')
op <- par(mfrow = c(2,2))
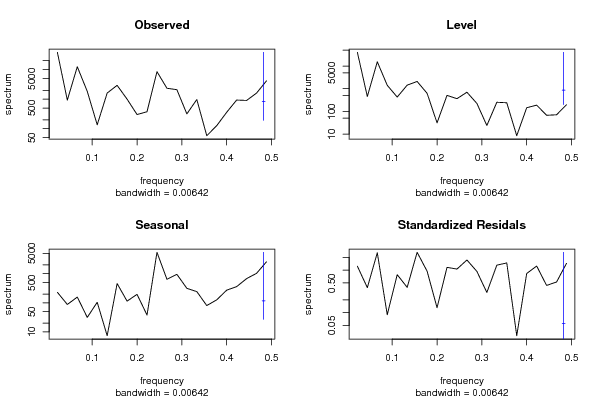
spectrum(as.numeric(x),main='Observed')
spectrum(mylevel,main='Level')
spectrum(myseas,main='Seasonal')
spectrum(myresid,main='Standardized Residals')
par(op)
dev.off()
bitmap(file='test4.png')
op <- par(mfrow = c(2,2))
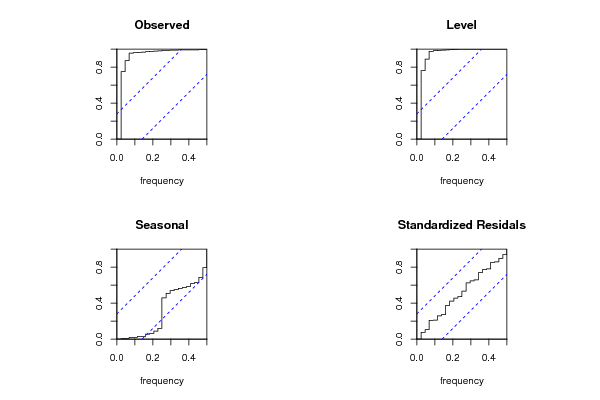
cpgram(as.numeric(x),main='Observed')
cpgram(mylevel,main='Level')
cpgram(myseas,main='Seasonal')
cpgram(myresid,main='Standardized Residals')
par(op)
dev.off()
bitmap(file='test1.png')
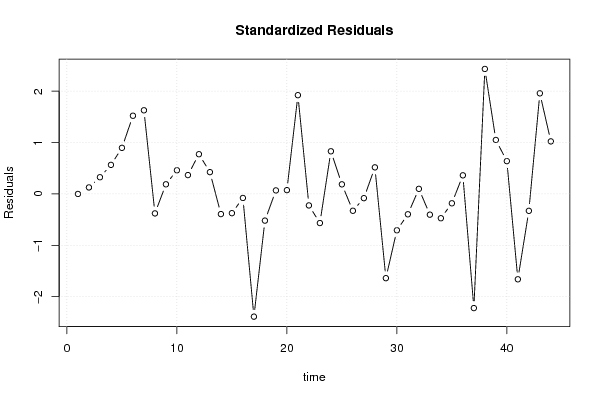
plot(as.numeric(m$resid),main='Standardized Residuals',ylab='Residuals',xlab='time',type='b')
grid()
dev.off()
bitmap(file='test5.png')
op <- par(mfrow = c(2,2))
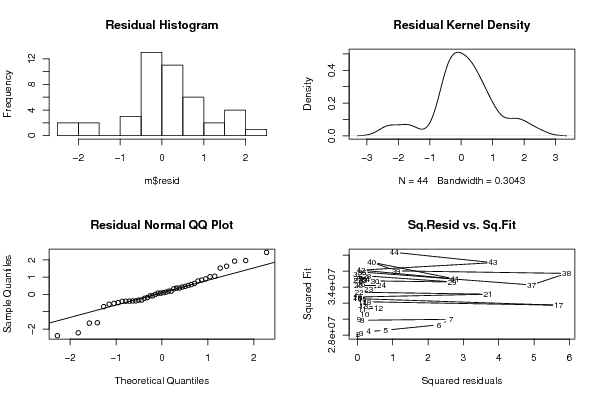
hist(m$resid,main='Residual Histogram')
plot(density(m$resid),main='Residual Kernel Density')
qqnorm(m$resid,main='Residual Normal QQ Plot')
qqline(m$resid)
plot(m$resid^2, myfit^2,main='Sq.Resid vs. Sq.Fit',xlab='Squared residuals',ylab='Squared Fit')
par(op)
dev.off()
bitmap(file='test6.png')
par(mfrow = c(3,1), mar = c(3,3,3,3))
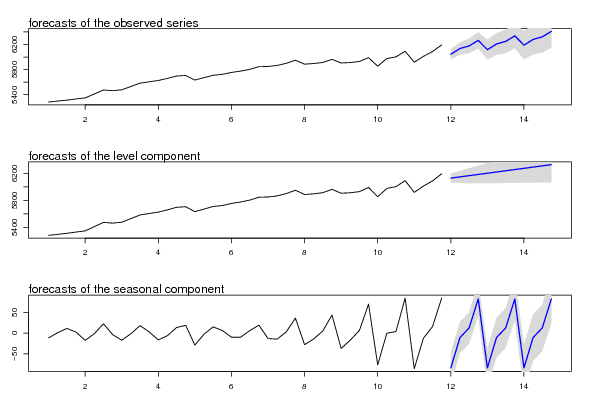
plot(cbind(x, pred$pred), type = 'n', plot.type = 'single', ylab = '')
lines(x)
polygon(c(time(pred$pred), rev(time(pred$pred))), c(pred$pred + 2 * pred$se, rev(pred$pred)), col = 'gray85', border = NA)
polygon(c(time(pred$pred), rev(time(pred$pred))), c(pred$pred - 2 * pred$se, rev(pred$pred)), col = ' gray85', border = NA)
lines(pred$pred, col = 'blue', lwd = 1.5)
mtext(text = 'forecasts of the observed series', side = 3, adj = 0)
plot(cbind(x, pred$a[,1]), type = 'n', plot.type = 'single', ylab = '')
lines(x)
polygon(c(time(pred$a[,1]), rev(time(pred$a[,1]))), c(pred$a[,1] + 2 * sqrt(pred$P[,1]), rev(pred$a[,1])), col = 'gray85', border = NA)
polygon(c(time(pred$a[,1]), rev(time(pred$a[,1]))), c(pred$a[,1] - 2 * sqrt(pred$P[,1]), rev(pred$a[,1])), col = ' gray85', border = NA)
lines(pred$a[,1], col = 'blue', lwd = 1.5)
mtext(text = 'forecasts of the level component', side = 3, adj = 0)
plot(cbind(fit2.comps[,3], pred$a[,3]), type = 'n', plot.type = 'single', ylab = '')
lines(fit2.comps[,3])
polygon(c(time(pred$a[,3]), rev(time(pred$a[,3]))), c(pred$a[,3] + 2 * sqrt(pred$P[,3]), rev(pred$a[,3])), col = 'gray85', border = NA)
polygon(c(time(pred$a[,3]), rev(time(pred$a[,3]))), c(pred$a[,3] - 2 * sqrt(pred$P[,3]), rev(pred$a[,3])), col = ' gray85', border = NA)
lines(pred$a[,3], col = 'blue', lwd = 1.5)
mtext(text = 'forecasts of the seasonal component', side = 3, adj = 0)
dev.off()
load(file='createtable')
a<-table.start()
a<-table.row.start(a)
a<-table.element(a,'Structural Time Series Model -- Interpolation',6,TRUE)
a<-table.row.end(a)
a<-table.row.start(a)
a<-table.element(a,'t',header=TRUE)
a<-table.element(a,'Observed',header=TRUE)
a<-table.element(a,'Level',header=TRUE)
a<-table.element(a,'Slope',header=TRUE)
a<-table.element(a,'Seasonal',header=TRUE)
a<-table.element(a,'Stand. Residuals',header=TRUE)
a<-table.row.end(a)
for (i in 1:nx) {
a<-table.row.start(a)
a<-table.element(a,i,header=TRUE)
a<-table.element(a,x[i])
a<-table.element(a,mylevel[i])
a<-table.element(a,myslope[i])
a<-table.element(a,myseas[i])
a<-table.element(a,myresid[i])
a<-table.row.end(a)
}
a<-table.end(a)
table.save(a,file='mytable.tab')
a<-table.start()
a<-table.row.start(a)
a<-table.element(a,'Structural Time Series Model -- Extrapolation',4,TRUE)
a<-table.row.end(a)
a<-table.row.start(a)
a<-table.element(a,'t',header=TRUE)
a<-table.element(a,'Observed',header=TRUE)
a<-table.element(a,'Level',header=TRUE)
a<-table.element(a,'Seasonal',header=TRUE)
a<-table.row.end(a)
for (i in 1:par2) {
a<-table.row.start(a)
a<-table.element(a,i,header=TRUE)
a<-table.element(a,pred$pred[i])
a<-table.element(a,pred$a[i,1])
a<-table.element(a,pred$a[i,3])
a<-table.row.end(a)
}
a<-table.end(a)
table.save(a,file='mytable1.tab')