Free Statistics

of Irreproducible Research!

Author's title

Author*The author of this computation has been verified*
R Software Modulerwasp_autocorrelation.wasp
Title produced by software(Partial) Autocorrelation Function
Date of computationSun, 18 Dec 2016 16:46:49 +0100
Cite this page as followsStatistical Computations at FreeStatistics.org, Office for Research Development and Education, URL https://freestatistics.org/blog/index.php?v=date/2016/Dec/18/t1482076090h7vzyurc1v82n9h.htm/, Retrieved Fri, 01 Nov 2024 03:45:36 +0000
Statistical Computations at FreeStatistics.org, Office for Research Development and Education, URL https://freestatistics.org/blog/index.php?pk=301149, Retrieved Fri, 01 Nov 2024 03:45:36 +0000
QR Codes:

Original text written by user:
IsPrivate?No (this computation is public)
User-defined keywords
Estimated Impact65
Family? (F = Feedback message, R = changed R code, M = changed R Module, P = changed Parameters, D = changed Data)
-       [(Partial) Autocorrelation Function] [plot en describe ...] [2016-12-18 15:46:49] [84a79156fb687334cf7dc390d7b82d5a] [Current]
Feedback Forum

Post a new message
Dataseries X:
5283.5
5298.3
5313
5332.2
5348.9
5411.6
5474.6
5463.6
5477.3
5530.4
5584.1
5605.5
5626.6
5659
5697.6
5705.9
5633.3
5671.2
5709.5
5723.8
5754.2
5775.7
5803.6
5846.5
5849.6
5866
5900
5949.6
5886.2
5896.7
5913.4
5963.1
5905.2
5912.2
5928.9
5990.6
5853.6
5976.1
6002.5
6091.9
5917.8
6010.3
6087.7
6192.9


Summary of computational transaction
Raw Input view raw input (R code)
Raw Outputview raw output of R engine
Computing time1 seconds
R ServerBig Analytics Cloud Computing Center

\begin{tabular}{lllllllll}
\hline
Summary of computational transaction \tabularnewline
Raw Input view raw input (R code)  \tabularnewline
Raw Outputview raw output of R engine  \tabularnewline
Computing time1 seconds \tabularnewline
R ServerBig Analytics Cloud Computing Center \tabularnewline
\hline
\end{tabular}
%Source: https://freestatistics.org/blog/index.php?pk=301149&T=0

[TABLE]
[ROW]
Summary of computational transaction[/C][/ROW] [ROW]Raw Input[/C] view raw input (R code) [/C][/ROW] [ROW]Raw Output[/C]view raw output of R engine [/C][/ROW] [ROW]Computing time[/C]1 seconds[/C][/ROW] [ROW]R Server[/C]Big Analytics Cloud Computing Center[/C][/ROW] [/TABLE] Source: https://freestatistics.org/blog/index.php?pk=301149&T=0

Globally Unique Identifier (entire table): ba.freestatistics.org/blog/index.php?pk=301149&T=0

As an alternative you can also use a QR Code:  

The GUIDs for individual cells are displayed in the table below:

Summary of computational transaction
Raw Input view raw input (R code)
Raw Outputview raw output of R engine
Computing time1 seconds
R ServerBig Analytics Cloud Computing Center


Autocorrelation Function
Time lag kACF(k)T-STATP-value
1-0.632604-4.09979.3e-05
20.2639191.71040.047286
3-0.423925-2.74730.004406
40.5817023.76990.000252
5-0.355809-2.30590.013061
60.1119910.72580.235998
7-0.175876-1.13980.130413
80.3108652.01460.025187
9-0.197468-1.27970.10383
100.0443190.28720.387677
11-0.138788-0.89940.186771
120.2467021.59880.05868
13-0.140932-0.91330.183138
140.0282080.18280.427915
15-0.057982-0.37580.354491
160.0631450.40920.342226

\begin{tabular}{lllllllll}
\hline
Autocorrelation Function \tabularnewline
Time lag k & ACF(k) & T-STAT & P-value \tabularnewline
1 & -0.632604 & -4.0997 & 9.3e-05 \tabularnewline
2 & 0.263919 & 1.7104 & 0.047286 \tabularnewline
3 & -0.423925 & -2.7473 & 0.004406 \tabularnewline
4 & 0.581702 & 3.7699 & 0.000252 \tabularnewline
5 & -0.355809 & -2.3059 & 0.013061 \tabularnewline
6 & 0.111991 & 0.7258 & 0.235998 \tabularnewline
7 & -0.175876 & -1.1398 & 0.130413 \tabularnewline
8 & 0.310865 & 2.0146 & 0.025187 \tabularnewline
9 & -0.197468 & -1.2797 & 0.10383 \tabularnewline
10 & 0.044319 & 0.2872 & 0.387677 \tabularnewline
11 & -0.138788 & -0.8994 & 0.186771 \tabularnewline
12 & 0.246702 & 1.5988 & 0.05868 \tabularnewline
13 & -0.140932 & -0.9133 & 0.183138 \tabularnewline
14 & 0.028208 & 0.1828 & 0.427915 \tabularnewline
15 & -0.057982 & -0.3758 & 0.354491 \tabularnewline
16 & 0.063145 & 0.4092 & 0.342226 \tabularnewline
\hline
\end{tabular}
%Source: https://freestatistics.org/blog/index.php?pk=301149&T=1

[TABLE]
[ROW][C]Autocorrelation Function[/C][/ROW]
[ROW][C]Time lag k[/C][C]ACF(k)[/C][C]T-STAT[/C][C]P-value[/C][/ROW]
[ROW][C]1[/C][C]-0.632604[/C][C]-4.0997[/C][C]9.3e-05[/C][/ROW]
[ROW][C]2[/C][C]0.263919[/C][C]1.7104[/C][C]0.047286[/C][/ROW]
[ROW][C]3[/C][C]-0.423925[/C][C]-2.7473[/C][C]0.004406[/C][/ROW]
[ROW][C]4[/C][C]0.581702[/C][C]3.7699[/C][C]0.000252[/C][/ROW]
[ROW][C]5[/C][C]-0.355809[/C][C]-2.3059[/C][C]0.013061[/C][/ROW]
[ROW][C]6[/C][C]0.111991[/C][C]0.7258[/C][C]0.235998[/C][/ROW]
[ROW][C]7[/C][C]-0.175876[/C][C]-1.1398[/C][C]0.130413[/C][/ROW]
[ROW][C]8[/C][C]0.310865[/C][C]2.0146[/C][C]0.025187[/C][/ROW]
[ROW][C]9[/C][C]-0.197468[/C][C]-1.2797[/C][C]0.10383[/C][/ROW]
[ROW][C]10[/C][C]0.044319[/C][C]0.2872[/C][C]0.387677[/C][/ROW]
[ROW][C]11[/C][C]-0.138788[/C][C]-0.8994[/C][C]0.186771[/C][/ROW]
[ROW][C]12[/C][C]0.246702[/C][C]1.5988[/C][C]0.05868[/C][/ROW]
[ROW][C]13[/C][C]-0.140932[/C][C]-0.9133[/C][C]0.183138[/C][/ROW]
[ROW][C]14[/C][C]0.028208[/C][C]0.1828[/C][C]0.427915[/C][/ROW]
[ROW][C]15[/C][C]-0.057982[/C][C]-0.3758[/C][C]0.354491[/C][/ROW]
[ROW][C]16[/C][C]0.063145[/C][C]0.4092[/C][C]0.342226[/C][/ROW]
[/TABLE]
Source: https://freestatistics.org/blog/index.php?pk=301149&T=1

Globally Unique Identifier (entire table): ba.freestatistics.org/blog/index.php?pk=301149&T=1

As an alternative you can also use a QR Code:  

The GUIDs for individual cells are displayed in the table below:

Autocorrelation Function
Time lag kACF(k)T-STATP-value
1-0.632604-4.09979.3e-05
20.2639191.71040.047286
3-0.423925-2.74730.004406
40.5817023.76990.000252
5-0.355809-2.30590.013061
60.1119910.72580.235998
7-0.175876-1.13980.130413
80.3108652.01460.025187
9-0.197468-1.27970.10383
100.0443190.28720.387677
11-0.138788-0.89940.186771
120.2467021.59880.05868
13-0.140932-0.91330.183138
140.0282080.18280.427915
15-0.057982-0.37580.354491
160.0631450.40920.342226


Partial Autocorrelation Function
Time lag kPACF(k)T-STATP-value
1-0.632604-4.09979.3e-05
2-0.227186-1.47230.074193
3-0.637699-4.13288.4e-05
4-0.064035-0.4150.34013
50.0636170.41230.341114
6-0.123162-0.79820.214628
7-0.020022-0.12980.448688
80.0689390.44680.328666
90.0655120.42460.336659
100.0960160.62230.268569
11-0.09911-0.64230.262083
12-0.047213-0.3060.380567
136e-0600.499985
14-0.039206-0.25410.400335
150.1053570.68280.249244
16-0.121189-0.78540.218315

\begin{tabular}{lllllllll}
\hline
Partial Autocorrelation Function \tabularnewline
Time lag k & PACF(k) & T-STAT & P-value \tabularnewline
1 & -0.632604 & -4.0997 & 9.3e-05 \tabularnewline
2 & -0.227186 & -1.4723 & 0.074193 \tabularnewline
3 & -0.637699 & -4.1328 & 8.4e-05 \tabularnewline
4 & -0.064035 & -0.415 & 0.34013 \tabularnewline
5 & 0.063617 & 0.4123 & 0.341114 \tabularnewline
6 & -0.123162 & -0.7982 & 0.214628 \tabularnewline
7 & -0.020022 & -0.1298 & 0.448688 \tabularnewline
8 & 0.068939 & 0.4468 & 0.328666 \tabularnewline
9 & 0.065512 & 0.4246 & 0.336659 \tabularnewline
10 & 0.096016 & 0.6223 & 0.268569 \tabularnewline
11 & -0.09911 & -0.6423 & 0.262083 \tabularnewline
12 & -0.047213 & -0.306 & 0.380567 \tabularnewline
13 & 6e-06 & 0 & 0.499985 \tabularnewline
14 & -0.039206 & -0.2541 & 0.400335 \tabularnewline
15 & 0.105357 & 0.6828 & 0.249244 \tabularnewline
16 & -0.121189 & -0.7854 & 0.218315 \tabularnewline
\hline
\end{tabular}
%Source: https://freestatistics.org/blog/index.php?pk=301149&T=2

[TABLE]
[ROW][C]Partial Autocorrelation Function[/C][/ROW]
[ROW][C]Time lag k[/C][C]PACF(k)[/C][C]T-STAT[/C][C]P-value[/C][/ROW]
[ROW][C]1[/C][C]-0.632604[/C][C]-4.0997[/C][C]9.3e-05[/C][/ROW]
[ROW][C]2[/C][C]-0.227186[/C][C]-1.4723[/C][C]0.074193[/C][/ROW]
[ROW][C]3[/C][C]-0.637699[/C][C]-4.1328[/C][C]8.4e-05[/C][/ROW]
[ROW][C]4[/C][C]-0.064035[/C][C]-0.415[/C][C]0.34013[/C][/ROW]
[ROW][C]5[/C][C]0.063617[/C][C]0.4123[/C][C]0.341114[/C][/ROW]
[ROW][C]6[/C][C]-0.123162[/C][C]-0.7982[/C][C]0.214628[/C][/ROW]
[ROW][C]7[/C][C]-0.020022[/C][C]-0.1298[/C][C]0.448688[/C][/ROW]
[ROW][C]8[/C][C]0.068939[/C][C]0.4468[/C][C]0.328666[/C][/ROW]
[ROW][C]9[/C][C]0.065512[/C][C]0.4246[/C][C]0.336659[/C][/ROW]
[ROW][C]10[/C][C]0.096016[/C][C]0.6223[/C][C]0.268569[/C][/ROW]
[ROW][C]11[/C][C]-0.09911[/C][C]-0.6423[/C][C]0.262083[/C][/ROW]
[ROW][C]12[/C][C]-0.047213[/C][C]-0.306[/C][C]0.380567[/C][/ROW]
[ROW][C]13[/C][C]6e-06[/C][C]0[/C][C]0.499985[/C][/ROW]
[ROW][C]14[/C][C]-0.039206[/C][C]-0.2541[/C][C]0.400335[/C][/ROW]
[ROW][C]15[/C][C]0.105357[/C][C]0.6828[/C][C]0.249244[/C][/ROW]
[ROW][C]16[/C][C]-0.121189[/C][C]-0.7854[/C][C]0.218315[/C][/ROW]
[/TABLE]
Source: https://freestatistics.org/blog/index.php?pk=301149&T=2

Globally Unique Identifier (entire table): ba.freestatistics.org/blog/index.php?pk=301149&T=2

As an alternative you can also use a QR Code:  

The GUIDs for individual cells are displayed in the table below:

Partial Autocorrelation Function
Time lag kPACF(k)T-STATP-value
1-0.632604-4.09979.3e-05
2-0.227186-1.47230.074193
3-0.637699-4.13288.4e-05
4-0.064035-0.4150.34013
50.0636170.41230.341114
6-0.123162-0.79820.214628
7-0.020022-0.12980.448688
80.0689390.44680.328666
90.0655120.42460.336659
100.0960160.62230.268569
11-0.09911-0.64230.262083
12-0.047213-0.3060.380567
136e-0600.499985
14-0.039206-0.25410.400335
150.1053570.68280.249244
16-0.121189-0.78540.218315


Parameters (Session):
par1 = Default ; par2 = 1 ; par3 = 1 ; par4 = 0 ; par5 = 1 ; par6 = White Noise ; par7 = 0.95 ;
Parameters (R input):
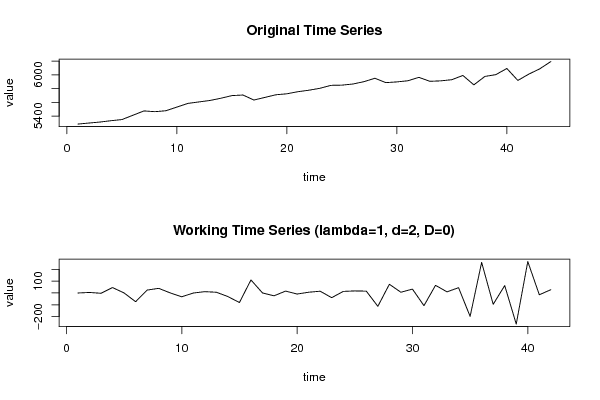
par1 = Default ; par2 = 1 ; par3 = 2 ; par4 = 0 ; par5 = 1 ; par6 = White Noise ; par7 = 0.95 ; par8 = ;
R code (references can be found in the software module):
par8 <- ''
par7 <- '0.95'
par6 <- 'White Noise'
par5 <- '1'
par4 <- '0'
par3 <- '1'
par2 <- '1'
par1 <- 'Default'
if (par1 == 'Default') {
par1 = 10*log10(length(x))
} else {
par1 <- as.numeric(par1)
}
par2 <- as.numeric(par2)
par3 <- as.numeric(par3)
par4 <- as.numeric(par4)
par5 <- as.numeric(par5)
if (par6 == 'White Noise') par6 <- 'white' else par6 <- 'ma'
par7 <- as.numeric(par7)
if (par8 != '') par8 <- as.numeric(par8)
x <- na.omit(x)
ox <- x
if (par8 == '') {
if (par2 == 0) {
x <- log(x)
} else {
x <- (x ^ par2 - 1) / par2
}
} else {
x <- log(x,base=par8)
}
if (par3 > 0) x <- diff(x,lag=1,difference=par3)
if (par4 > 0) x <- diff(x,lag=par5,difference=par4)
bitmap(file='picts.png')
op <- par(mfrow=c(2,1))
plot(ox,type='l',main='Original Time Series',xlab='time',ylab='value')
if (par8=='') {
mytitle <- paste('Working Time Series (lambda=',par2,', d=',par3,', D=',par4,')',sep='')
mysub <- paste('(lambda=',par2,', d=',par3,', D=',par4,', CI=', par7, ', CI type=',par6,')',sep='')
} else {
mytitle <- paste('Working Time Series (base=',par8,', d=',par3,', D=',par4,')',sep='')
mysub <- paste('(base=',par8,', d=',par3,', D=',par4,', CI=', par7, ', CI type=',par6,')',sep='')
}
plot(x,type='l', main=mytitle,xlab='time',ylab='value')
par(op)
dev.off()
bitmap(file='pic1.png')
racf <- acf(x, par1, main='Autocorrelation', xlab='time lag', ylab='ACF', ci.type=par6, ci=par7, sub=mysub)
dev.off()
bitmap(file='pic2.png')
rpacf <- pacf(x,par1,main='Partial Autocorrelation',xlab='lags',ylab='PACF',sub=mysub)
dev.off()
(myacf <- c(racf$acf))
(mypacf <- c(rpacf$acf))
lengthx <- length(x)
sqrtn <- sqrt(lengthx)
load(file='createtable')
a<-table.start()
a<-table.row.start(a)
a<-table.element(a,'Autocorrelation Function',4,TRUE)
a<-table.row.end(a)
a<-table.row.start(a)
a<-table.element(a,'Time lag k',header=TRUE)
a<-table.element(a,'ACF(k)',header=TRUE)
a<-table.element(a,'T-STAT',header=TRUE)
a<-table.element(a,'P-value',header=TRUE)
a<-table.row.end(a)
for (i in 2:(par1+1)) {
a<-table.row.start(a)
a<-table.element(a,i-1,header=TRUE)
a<-table.element(a,round(myacf[i],6))
mytstat <- myacf[i]*sqrtn
a<-table.element(a,round(mytstat,4))
a<-table.element(a,round(1-pt(abs(mytstat),lengthx),6))
a<-table.row.end(a)
}
a<-table.end(a)
table.save(a,file='mytable.tab')
a<-table.start()
a<-table.row.start(a)
a<-table.element(a,'Partial Autocorrelation Function',4,TRUE)
a<-table.row.end(a)
a<-table.row.start(a)
a<-table.element(a,'Time lag k',header=TRUE)
a<-table.element(a,'PACF(k)',header=TRUE)
a<-table.element(a,'T-STAT',header=TRUE)
a<-table.element(a,'P-value',header=TRUE)
a<-table.row.end(a)
for (i in 1:par1) {
a<-table.row.start(a)
a<-table.element(a,i,header=TRUE)
a<-table.element(a,round(mypacf[i],6))
mytstat <- mypacf[i]*sqrtn
a<-table.element(a,round(mytstat,4))
a<-table.element(a,round(1-pt(abs(mytstat),lengthx),6))
a<-table.row.end(a)
}
a<-table.end(a)
table.save(a,file='mytable1.tab')