Free Statistics

of Irreproducible Research!

Author's title

Author*The author of this computation has been verified*
R Software Modulerwasp_arimabackwardselection.wasp
Title produced by softwareARIMA Backward Selection
Date of computationSun, 18 Dec 2016 15:42:10 +0100
Cite this page as followsStatistical Computations at FreeStatistics.org, Office for Research Development and Education, URL https://freestatistics.org/blog/index.php?v=date/2016/Dec/18/t1482072344p6amzkibi42d16w.htm/, Retrieved Fri, 01 Nov 2024 03:35:35 +0000
Statistical Computations at FreeStatistics.org, Office for Research Development and Education, URL https://freestatistics.org/blog/index.php?pk=301113, Retrieved Fri, 01 Nov 2024 03:35:35 +0000
QR Codes:

Original text written by user:
IsPrivate?No (this computation is public)
User-defined keywords
Estimated Impact56
Family? (F = Feedback message, R = changed R code, M = changed R Module, P = changed Parameters, D = changed Data)
-       [ARIMA Backward Selection] [ARIMA Backward Se...] [2016-12-18 14:42:10] [3b055ff671ad33431c4331443bac114d] [Current]
Feedback Forum

Post a new message
Dataseries X:
9137.8
9009.4
8926.6
9145
9186.2
9152.2
9093.6
9199.2
9310.6
9282
9248.4
9341.6
9478.8
9438
9374.6
9488.8
9631.8
9588.4
9514.6
9623.2
9744.6
9685.8
9598
9703.4
9817.8
9762.6
9669.6
9789.2
9917.4
9864.4
9779.2
9898.8
10048.8
9983.4
9913.4
10031.6
10184.6
10125
10065.4
10188.6
10350.4
10320.6
10232.6
10357.2
10520.2
10473.8
10407
10536
10700.2
10664.2
10606
10716.6
10882.8
10849.4
10794
10907.8


Summary of computational transaction
Raw Input view raw input (R code)
Raw Outputview raw output of R engine
Computing time3 seconds
R ServerBig Analytics Cloud Computing Center

\begin{tabular}{lllllllll}
\hline
Summary of computational transaction \tabularnewline
Raw Input view raw input (R code)  \tabularnewline
Raw Outputview raw output of R engine  \tabularnewline
Computing time3 seconds \tabularnewline
R ServerBig Analytics Cloud Computing Center \tabularnewline
\hline
\end{tabular}
%Source: https://freestatistics.org/blog/index.php?pk=301113&T=0

[TABLE]
[ROW]
Summary of computational transaction[/C][/ROW] [ROW]Raw Input[/C] view raw input (R code) [/C][/ROW] [ROW]Raw Output[/C]view raw output of R engine [/C][/ROW] [ROW]Computing time[/C]3 seconds[/C][/ROW] [ROW]R Server[/C]Big Analytics Cloud Computing Center[/C][/ROW] [/TABLE] Source: https://freestatistics.org/blog/index.php?pk=301113&T=0

Globally Unique Identifier (entire table): ba.freestatistics.org/blog/index.php?pk=301113&T=0

As an alternative you can also use a QR Code:  

The GUIDs for individual cells are displayed in the table below:

Summary of computational transaction
Raw Input view raw input (R code)
Raw Outputview raw output of R engine
Computing time3 seconds
R ServerBig Analytics Cloud Computing Center


ARIMA Parameter Estimation and Backward Selection
Iterationar1ar2ar3ma1sar1sar2sma1
Estimates ( 1 )0.18610.01590.5968-0.69430.3644-0.2245-0.7428
(p-val)(0.4389 )(0.9159 )(3e-04 )(9e-04 )(0.2412 )(0.351 )(8e-04 )
Estimates ( 2 )0.186600.5983-0.68870.3643-0.2258-0.7373
(p-val)(0.4521 )(NA )(3e-04 )(9e-04 )(0.2414 )(0.3491 )(7e-04 )
Estimates ( 3 )000.6033-0.56420.3355-0.155-0.725
(p-val)(NA )(NA )(9e-04 )(0 )(0.2919 )(0.4986 )(0.0022 )
Estimates ( 4 )000.6254-0.56960.33980-0.7954
(p-val)(NA )(NA )(2e-04 )(0 )(0.2439 )(NA )(0 )
Estimates ( 5 )000.668-0.543600-0.6381
(p-val)(NA )(NA )(0 )(0 )(NA )(NA )(6e-04 )
Estimates ( 6 )NANANANANANANA
(p-val)(NA )(NA )(NA )(NA )(NA )(NA )(NA )
Estimates ( 7 )NANANANANANANA
(p-val)(NA )(NA )(NA )(NA )(NA )(NA )(NA )
Estimates ( 8 )NANANANANANANA
(p-val)(NA )(NA )(NA )(NA )(NA )(NA )(NA )
Estimates ( 9 )NANANANANANANA
(p-val)(NA )(NA )(NA )(NA )(NA )(NA )(NA )
Estimates ( 10 )NANANANANANANA
(p-val)(NA )(NA )(NA )(NA )(NA )(NA )(NA )
Estimates ( 11 )NANANANANANANA
(p-val)(NA )(NA )(NA )(NA )(NA )(NA )(NA )
Estimates ( 12 )NANANANANANANA
(p-val)(NA )(NA )(NA )(NA )(NA )(NA )(NA )
Estimates ( 13 )NANANANANANANA
(p-val)(NA )(NA )(NA )(NA )(NA )(NA )(NA )

\begin{tabular}{lllllllll}
\hline
ARIMA Parameter Estimation and Backward Selection \tabularnewline
Iteration & ar1 & ar2 & ar3 & ma1 & sar1 & sar2 & sma1 \tabularnewline
Estimates ( 1 ) & 0.1861 & 0.0159 & 0.5968 & -0.6943 & 0.3644 & -0.2245 & -0.7428 \tabularnewline
(p-val) & (0.4389 ) & (0.9159 ) & (3e-04 ) & (9e-04 ) & (0.2412 ) & (0.351 ) & (8e-04 ) \tabularnewline
Estimates ( 2 ) & 0.1866 & 0 & 0.5983 & -0.6887 & 0.3643 & -0.2258 & -0.7373 \tabularnewline
(p-val) & (0.4521 ) & (NA ) & (3e-04 ) & (9e-04 ) & (0.2414 ) & (0.3491 ) & (7e-04 ) \tabularnewline
Estimates ( 3 ) & 0 & 0 & 0.6033 & -0.5642 & 0.3355 & -0.155 & -0.725 \tabularnewline
(p-val) & (NA ) & (NA ) & (9e-04 ) & (0 ) & (0.2919 ) & (0.4986 ) & (0.0022 ) \tabularnewline
Estimates ( 4 ) & 0 & 0 & 0.6254 & -0.5696 & 0.3398 & 0 & -0.7954 \tabularnewline
(p-val) & (NA ) & (NA ) & (2e-04 ) & (0 ) & (0.2439 ) & (NA ) & (0 ) \tabularnewline
Estimates ( 5 ) & 0 & 0 & 0.668 & -0.5436 & 0 & 0 & -0.6381 \tabularnewline
(p-val) & (NA ) & (NA ) & (0 ) & (0 ) & (NA ) & (NA ) & (6e-04 ) \tabularnewline
Estimates ( 6 ) & NA & NA & NA & NA & NA & NA & NA \tabularnewline
(p-val) & (NA ) & (NA ) & (NA ) & (NA ) & (NA ) & (NA ) & (NA ) \tabularnewline
Estimates ( 7 ) & NA & NA & NA & NA & NA & NA & NA \tabularnewline
(p-val) & (NA ) & (NA ) & (NA ) & (NA ) & (NA ) & (NA ) & (NA ) \tabularnewline
Estimates ( 8 ) & NA & NA & NA & NA & NA & NA & NA \tabularnewline
(p-val) & (NA ) & (NA ) & (NA ) & (NA ) & (NA ) & (NA ) & (NA ) \tabularnewline
Estimates ( 9 ) & NA & NA & NA & NA & NA & NA & NA \tabularnewline
(p-val) & (NA ) & (NA ) & (NA ) & (NA ) & (NA ) & (NA ) & (NA ) \tabularnewline
Estimates ( 10 ) & NA & NA & NA & NA & NA & NA & NA \tabularnewline
(p-val) & (NA ) & (NA ) & (NA ) & (NA ) & (NA ) & (NA ) & (NA ) \tabularnewline
Estimates ( 11 ) & NA & NA & NA & NA & NA & NA & NA \tabularnewline
(p-val) & (NA ) & (NA ) & (NA ) & (NA ) & (NA ) & (NA ) & (NA ) \tabularnewline
Estimates ( 12 ) & NA & NA & NA & NA & NA & NA & NA \tabularnewline
(p-val) & (NA ) & (NA ) & (NA ) & (NA ) & (NA ) & (NA ) & (NA ) \tabularnewline
Estimates ( 13 ) & NA & NA & NA & NA & NA & NA & NA \tabularnewline
(p-val) & (NA ) & (NA ) & (NA ) & (NA ) & (NA ) & (NA ) & (NA ) \tabularnewline
\hline
\end{tabular}
%Source: https://freestatistics.org/blog/index.php?pk=301113&T=1

[TABLE]
[ROW][C]ARIMA Parameter Estimation and Backward Selection[/C][/ROW]
[ROW][C]Iteration[/C][C]ar1[/C][C]ar2[/C][C]ar3[/C][C]ma1[/C][C]sar1[/C][C]sar2[/C][C]sma1[/C][/ROW]
[ROW][C]Estimates ( 1 )[/C][C]0.1861[/C][C]0.0159[/C][C]0.5968[/C][C]-0.6943[/C][C]0.3644[/C][C]-0.2245[/C][C]-0.7428[/C][/ROW]
[ROW][C](p-val)[/C][C](0.4389 )[/C][C](0.9159 )[/C][C](3e-04 )[/C][C](9e-04 )[/C][C](0.2412 )[/C][C](0.351 )[/C][C](8e-04 )[/C][/ROW]
[ROW][C]Estimates ( 2 )[/C][C]0.1866[/C][C]0[/C][C]0.5983[/C][C]-0.6887[/C][C]0.3643[/C][C]-0.2258[/C][C]-0.7373[/C][/ROW]
[ROW][C](p-val)[/C][C](0.4521 )[/C][C](NA )[/C][C](3e-04 )[/C][C](9e-04 )[/C][C](0.2414 )[/C][C](0.3491 )[/C][C](7e-04 )[/C][/ROW]
[ROW][C]Estimates ( 3 )[/C][C]0[/C][C]0[/C][C]0.6033[/C][C]-0.5642[/C][C]0.3355[/C][C]-0.155[/C][C]-0.725[/C][/ROW]
[ROW][C](p-val)[/C][C](NA )[/C][C](NA )[/C][C](9e-04 )[/C][C](0 )[/C][C](0.2919 )[/C][C](0.4986 )[/C][C](0.0022 )[/C][/ROW]
[ROW][C]Estimates ( 4 )[/C][C]0[/C][C]0[/C][C]0.6254[/C][C]-0.5696[/C][C]0.3398[/C][C]0[/C][C]-0.7954[/C][/ROW]
[ROW][C](p-val)[/C][C](NA )[/C][C](NA )[/C][C](2e-04 )[/C][C](0 )[/C][C](0.2439 )[/C][C](NA )[/C][C](0 )[/C][/ROW]
[ROW][C]Estimates ( 5 )[/C][C]0[/C][C]0[/C][C]0.668[/C][C]-0.5436[/C][C]0[/C][C]0[/C][C]-0.6381[/C][/ROW]
[ROW][C](p-val)[/C][C](NA )[/C][C](NA )[/C][C](0 )[/C][C](0 )[/C][C](NA )[/C][C](NA )[/C][C](6e-04 )[/C][/ROW]
[ROW][C]Estimates ( 6 )[/C][C]NA[/C][C]NA[/C][C]NA[/C][C]NA[/C][C]NA[/C][C]NA[/C][C]NA[/C][/ROW]
[ROW][C](p-val)[/C][C](NA )[/C][C](NA )[/C][C](NA )[/C][C](NA )[/C][C](NA )[/C][C](NA )[/C][C](NA )[/C][/ROW]
[ROW][C]Estimates ( 7 )[/C][C]NA[/C][C]NA[/C][C]NA[/C][C]NA[/C][C]NA[/C][C]NA[/C][C]NA[/C][/ROW]
[ROW][C](p-val)[/C][C](NA )[/C][C](NA )[/C][C](NA )[/C][C](NA )[/C][C](NA )[/C][C](NA )[/C][C](NA )[/C][/ROW]
[ROW][C]Estimates ( 8 )[/C][C]NA[/C][C]NA[/C][C]NA[/C][C]NA[/C][C]NA[/C][C]NA[/C][C]NA[/C][/ROW]
[ROW][C](p-val)[/C][C](NA )[/C][C](NA )[/C][C](NA )[/C][C](NA )[/C][C](NA )[/C][C](NA )[/C][C](NA )[/C][/ROW]
[ROW][C]Estimates ( 9 )[/C][C]NA[/C][C]NA[/C][C]NA[/C][C]NA[/C][C]NA[/C][C]NA[/C][C]NA[/C][/ROW]
[ROW][C](p-val)[/C][C](NA )[/C][C](NA )[/C][C](NA )[/C][C](NA )[/C][C](NA )[/C][C](NA )[/C][C](NA )[/C][/ROW]
[ROW][C]Estimates ( 10 )[/C][C]NA[/C][C]NA[/C][C]NA[/C][C]NA[/C][C]NA[/C][C]NA[/C][C]NA[/C][/ROW]
[ROW][C](p-val)[/C][C](NA )[/C][C](NA )[/C][C](NA )[/C][C](NA )[/C][C](NA )[/C][C](NA )[/C][C](NA )[/C][/ROW]
[ROW][C]Estimates ( 11 )[/C][C]NA[/C][C]NA[/C][C]NA[/C][C]NA[/C][C]NA[/C][C]NA[/C][C]NA[/C][/ROW]
[ROW][C](p-val)[/C][C](NA )[/C][C](NA )[/C][C](NA )[/C][C](NA )[/C][C](NA )[/C][C](NA )[/C][C](NA )[/C][/ROW]
[ROW][C]Estimates ( 12 )[/C][C]NA[/C][C]NA[/C][C]NA[/C][C]NA[/C][C]NA[/C][C]NA[/C][C]NA[/C][/ROW]
[ROW][C](p-val)[/C][C](NA )[/C][C](NA )[/C][C](NA )[/C][C](NA )[/C][C](NA )[/C][C](NA )[/C][C](NA )[/C][/ROW]
[ROW][C]Estimates ( 13 )[/C][C]NA[/C][C]NA[/C][C]NA[/C][C]NA[/C][C]NA[/C][C]NA[/C][C]NA[/C][/ROW]
[ROW][C](p-val)[/C][C](NA )[/C][C](NA )[/C][C](NA )[/C][C](NA )[/C][C](NA )[/C][C](NA )[/C][C](NA )[/C][/ROW]
[/TABLE]
Source: https://freestatistics.org/blog/index.php?pk=301113&T=1

Globally Unique Identifier (entire table): ba.freestatistics.org/blog/index.php?pk=301113&T=1

As an alternative you can also use a QR Code:  

The GUIDs for individual cells are displayed in the table below:

ARIMA Parameter Estimation and Backward Selection
Iterationar1ar2ar3ma1sar1sar2sma1
Estimates ( 1 )0.18610.01590.5968-0.69430.3644-0.2245-0.7428
(p-val)(0.4389 )(0.9159 )(3e-04 )(9e-04 )(0.2412 )(0.351 )(8e-04 )
Estimates ( 2 )0.186600.5983-0.68870.3643-0.2258-0.7373
(p-val)(0.4521 )(NA )(3e-04 )(9e-04 )(0.2414 )(0.3491 )(7e-04 )
Estimates ( 3 )000.6033-0.56420.3355-0.155-0.725
(p-val)(NA )(NA )(9e-04 )(0 )(0.2919 )(0.4986 )(0.0022 )
Estimates ( 4 )000.6254-0.56960.33980-0.7954
(p-val)(NA )(NA )(2e-04 )(0 )(0.2439 )(NA )(0 )
Estimates ( 5 )000.668-0.543600-0.6381
(p-val)(NA )(NA )(0 )(0 )(NA )(NA )(6e-04 )
Estimates ( 6 )NANANANANANANA
(p-val)(NA )(NA )(NA )(NA )(NA )(NA )(NA )
Estimates ( 7 )NANANANANANANA
(p-val)(NA )(NA )(NA )(NA )(NA )(NA )(NA )
Estimates ( 8 )NANANANANANANA
(p-val)(NA )(NA )(NA )(NA )(NA )(NA )(NA )
Estimates ( 9 )NANANANANANANA
(p-val)(NA )(NA )(NA )(NA )(NA )(NA )(NA )
Estimates ( 10 )NANANANANANANA
(p-val)(NA )(NA )(NA )(NA )(NA )(NA )(NA )
Estimates ( 11 )NANANANANANANA
(p-val)(NA )(NA )(NA )(NA )(NA )(NA )(NA )
Estimates ( 12 )NANANANANANANA
(p-val)(NA )(NA )(NA )(NA )(NA )(NA )(NA )
Estimates ( 13 )NANANANANANANA
(p-val)(NA )(NA )(NA )(NA )(NA )(NA )(NA )


Estimated ARIMA Residuals
Value
-19.1347162089009
53.0738793326493
45.2417386987882
-25.2108292967038
-16.9571367199222
-8.05709163804784
90.4048643151936
-8.54854994550224
9.93173725802694
-15.5236732395913
4.95959141766339
-17.0682729807632
6.60423557542451
12.9253026369088
1.91113206714379
-24.3928314456224
-25.8272882268431
-22.0857874387761
-19.5455127033123
-17.6846445831463
-10.0340629520404
3.72959124713675
-2.95501202384552
8.18163529614556
15.3127187917592
17.4010208300278
6.00400360212494
-3.66939096195535
22.7284950923472
0.736046044231243
12.854629086534
-10.2981517174244
17.5375433081114
2.50625716333827
17.3520302660896
4.19228018478115
22.4425288121722
31.3893759695165
-4.79304153014094
-12.3959542086846
-10.3319159569561
2.11936881523752
14.2218723052685
5.47710483390201
18.0207803515965
13.3760305427608
16.9018339578075
-12.8308219698212
-3.90819486168087
-1.56105908942725
18.800676979431
1.31909705728209

\begin{tabular}{lllllllll}
\hline
Estimated ARIMA Residuals \tabularnewline
Value \tabularnewline
-19.1347162089009 \tabularnewline
53.0738793326493 \tabularnewline
45.2417386987882 \tabularnewline
-25.2108292967038 \tabularnewline
-16.9571367199222 \tabularnewline
-8.05709163804784 \tabularnewline
90.4048643151936 \tabularnewline
-8.54854994550224 \tabularnewline
9.93173725802694 \tabularnewline
-15.5236732395913 \tabularnewline
4.95959141766339 \tabularnewline
-17.0682729807632 \tabularnewline
6.60423557542451 \tabularnewline
12.9253026369088 \tabularnewline
1.91113206714379 \tabularnewline
-24.3928314456224 \tabularnewline
-25.8272882268431 \tabularnewline
-22.0857874387761 \tabularnewline
-19.5455127033123 \tabularnewline
-17.6846445831463 \tabularnewline
-10.0340629520404 \tabularnewline
3.72959124713675 \tabularnewline
-2.95501202384552 \tabularnewline
8.18163529614556 \tabularnewline
15.3127187917592 \tabularnewline
17.4010208300278 \tabularnewline
6.00400360212494 \tabularnewline
-3.66939096195535 \tabularnewline
22.7284950923472 \tabularnewline
0.736046044231243 \tabularnewline
12.854629086534 \tabularnewline
-10.2981517174244 \tabularnewline
17.5375433081114 \tabularnewline
2.50625716333827 \tabularnewline
17.3520302660896 \tabularnewline
4.19228018478115 \tabularnewline
22.4425288121722 \tabularnewline
31.3893759695165 \tabularnewline
-4.79304153014094 \tabularnewline
-12.3959542086846 \tabularnewline
-10.3319159569561 \tabularnewline
2.11936881523752 \tabularnewline
14.2218723052685 \tabularnewline
5.47710483390201 \tabularnewline
18.0207803515965 \tabularnewline
13.3760305427608 \tabularnewline
16.9018339578075 \tabularnewline
-12.8308219698212 \tabularnewline
-3.90819486168087 \tabularnewline
-1.56105908942725 \tabularnewline
18.800676979431 \tabularnewline
1.31909705728209 \tabularnewline
\hline
\end{tabular}
%Source: https://freestatistics.org/blog/index.php?pk=301113&T=2

[TABLE]
[ROW][C]Estimated ARIMA Residuals[/C][/ROW]
[ROW][C]Value[/C][/ROW]
[ROW][C]-19.1347162089009[/C][/ROW]
[ROW][C]53.0738793326493[/C][/ROW]
[ROW][C]45.2417386987882[/C][/ROW]
[ROW][C]-25.2108292967038[/C][/ROW]
[ROW][C]-16.9571367199222[/C][/ROW]
[ROW][C]-8.05709163804784[/C][/ROW]
[ROW][C]90.4048643151936[/C][/ROW]
[ROW][C]-8.54854994550224[/C][/ROW]
[ROW][C]9.93173725802694[/C][/ROW]
[ROW][C]-15.5236732395913[/C][/ROW]
[ROW][C]4.95959141766339[/C][/ROW]
[ROW][C]-17.0682729807632[/C][/ROW]
[ROW][C]6.60423557542451[/C][/ROW]
[ROW][C]12.9253026369088[/C][/ROW]
[ROW][C]1.91113206714379[/C][/ROW]
[ROW][C]-24.3928314456224[/C][/ROW]
[ROW][C]-25.8272882268431[/C][/ROW]
[ROW][C]-22.0857874387761[/C][/ROW]
[ROW][C]-19.5455127033123[/C][/ROW]
[ROW][C]-17.6846445831463[/C][/ROW]
[ROW][C]-10.0340629520404[/C][/ROW]
[ROW][C]3.72959124713675[/C][/ROW]
[ROW][C]-2.95501202384552[/C][/ROW]
[ROW][C]8.18163529614556[/C][/ROW]
[ROW][C]15.3127187917592[/C][/ROW]
[ROW][C]17.4010208300278[/C][/ROW]
[ROW][C]6.00400360212494[/C][/ROW]
[ROW][C]-3.66939096195535[/C][/ROW]
[ROW][C]22.7284950923472[/C][/ROW]
[ROW][C]0.736046044231243[/C][/ROW]
[ROW][C]12.854629086534[/C][/ROW]
[ROW][C]-10.2981517174244[/C][/ROW]
[ROW][C]17.5375433081114[/C][/ROW]
[ROW][C]2.50625716333827[/C][/ROW]
[ROW][C]17.3520302660896[/C][/ROW]
[ROW][C]4.19228018478115[/C][/ROW]
[ROW][C]22.4425288121722[/C][/ROW]
[ROW][C]31.3893759695165[/C][/ROW]
[ROW][C]-4.79304153014094[/C][/ROW]
[ROW][C]-12.3959542086846[/C][/ROW]
[ROW][C]-10.3319159569561[/C][/ROW]
[ROW][C]2.11936881523752[/C][/ROW]
[ROW][C]14.2218723052685[/C][/ROW]
[ROW][C]5.47710483390201[/C][/ROW]
[ROW][C]18.0207803515965[/C][/ROW]
[ROW][C]13.3760305427608[/C][/ROW]
[ROW][C]16.9018339578075[/C][/ROW]
[ROW][C]-12.8308219698212[/C][/ROW]
[ROW][C]-3.90819486168087[/C][/ROW]
[ROW][C]-1.56105908942725[/C][/ROW]
[ROW][C]18.800676979431[/C][/ROW]
[ROW][C]1.31909705728209[/C][/ROW]
[/TABLE]
Source: https://freestatistics.org/blog/index.php?pk=301113&T=2

Globally Unique Identifier (entire table): ba.freestatistics.org/blog/index.php?pk=301113&T=2

As an alternative you can also use a QR Code:  

The GUIDs for individual cells are displayed in the table below:

Estimated ARIMA Residuals
Value
-19.1347162089009
53.0738793326493
45.2417386987882
-25.2108292967038
-16.9571367199222
-8.05709163804784
90.4048643151936
-8.54854994550224
9.93173725802694
-15.5236732395913
4.95959141766339
-17.0682729807632
6.60423557542451
12.9253026369088
1.91113206714379
-24.3928314456224
-25.8272882268431
-22.0857874387761
-19.5455127033123
-17.6846445831463
-10.0340629520404
3.72959124713675
-2.95501202384552
8.18163529614556
15.3127187917592
17.4010208300278
6.00400360212494
-3.66939096195535
22.7284950923472
0.736046044231243
12.854629086534
-10.2981517174244
17.5375433081114
2.50625716333827
17.3520302660896
4.19228018478115
22.4425288121722
31.3893759695165
-4.79304153014094
-12.3959542086846
-10.3319159569561
2.11936881523752
14.2218723052685
5.47710483390201
18.0207803515965
13.3760305427608
16.9018339578075
-12.8308219698212
-3.90819486168087
-1.56105908942725
18.800676979431
1.31909705728209


Parameters (Session):
par1 = FALSE ; par2 = 1 ; par3 = 1 ; par4 = 1 ; par5 = 4 ; par6 = 3 ; par7 = 1 ; par8 = 2 ; par9 = 1 ;
Parameters (R input):
par1 = FALSE ; par2 = 1 ; par3 = 1 ; par4 = 1 ; par5 = 4 ; par6 = 3 ; par7 = 1 ; par8 = 2 ; par9 = 1 ;
R code (references can be found in the software module):
library(lattice)
if (par1 == 'TRUE') par1 <- TRUE
if (par1 == 'FALSE') par1 <- FALSE
par2 <- as.numeric(par2) #Box-Cox lambda transformation parameter
par3 <- as.numeric(par3) #degree of non-seasonal differencing
par4 <- as.numeric(par4) #degree of seasonal differencing
par5 <- as.numeric(par5) #seasonal period
par6 <- as.numeric(par6) #degree (p) of the non-seasonal AR(p) polynomial
par7 <- as.numeric(par7) #degree (q) of the non-seasonal MA(q) polynomial
par8 <- as.numeric(par8) #degree (P) of the seasonal AR(P) polynomial
par9 <- as.numeric(par9) #degree (Q) of the seasonal MA(Q) polynomial
armaGR <- function(arima.out, names, n){
try1 <- arima.out$coef
try2 <- sqrt(diag(arima.out$var.coef))
try.data.frame <- data.frame(matrix(NA,ncol=4,nrow=length(names)))
dimnames(try.data.frame) <- list(names,c('coef','std','tstat','pv'))
try.data.frame[,1] <- try1
for(i in 1:length(try2)) try.data.frame[which(rownames(try.data.frame)==names(try2)[i]),2] <- try2[i]
try.data.frame[,3] <- try.data.frame[,1] / try.data.frame[,2]
try.data.frame[,4] <- round((1-pt(abs(try.data.frame[,3]),df=n-(length(try2)+1)))*2,5)
vector <- rep(NA,length(names))
vector[is.na(try.data.frame[,4])] <- 0
maxi <- which.max(try.data.frame[,4])
continue <- max(try.data.frame[,4],na.rm=TRUE) > .05
vector[maxi] <- 0
list(summary=try.data.frame,next.vector=vector,continue=continue)
}
arimaSelect <- function(series, order=c(13,0,0), seasonal=list(order=c(2,0,0),period=12), include.mean=F){
nrc <- order[1]+order[3]+seasonal$order[1]+seasonal$order[3]
coeff <- matrix(NA, nrow=nrc*2, ncol=nrc)
pval <- matrix(NA, nrow=nrc*2, ncol=nrc)
mylist <- rep(list(NULL), nrc)
names <- NULL
if(order[1] > 0) names <- paste('ar',1:order[1],sep='')
if(order[3] > 0) names <- c( names , paste('ma',1:order[3],sep='') )
if(seasonal$order[1] > 0) names <- c(names, paste('sar',1:seasonal$order[1],sep=''))
if(seasonal$order[3] > 0) names <- c(names, paste('sma',1:seasonal$order[3],sep=''))
arima.out <- arima(series, order=order, seasonal=seasonal, include.mean=include.mean, method='ML')
mylist[[1]] <- arima.out
last.arma <- armaGR(arima.out, names, length(series))
mystop <- FALSE
i <- 1
coeff[i,] <- last.arma[[1]][,1]
pval [i,] <- last.arma[[1]][,4]
i <- 2
aic <- arima.out$aic
while(!mystop){
mylist[[i]] <- arima.out
arima.out <- arima(series, order=order, seasonal=seasonal, include.mean=include.mean, method='ML', fixed=last.arma$next.vector)
aic <- c(aic, arima.out$aic)
last.arma <- armaGR(arima.out, names, length(series))
mystop <- !last.arma$continue
coeff[i,] <- last.arma[[1]][,1]
pval [i,] <- last.arma[[1]][,4]
i <- i+1
}
list(coeff, pval, mylist, aic=aic)
}
arimaSelectplot <- function(arimaSelect.out,noms,choix){
noms <- names(arimaSelect.out[[3]][[1]]$coef)
coeff <- arimaSelect.out[[1]]
k <- min(which(is.na(coeff[,1])))-1
coeff <- coeff[1:k,]
pval <- arimaSelect.out[[2]][1:k,]
aic <- arimaSelect.out$aic[1:k]
coeff[coeff==0] <- NA
n <- ncol(coeff)
if(missing(choix)) choix <- k
layout(matrix(c(1,1,1,2,
3,3,3,2,
3,3,3,4,
5,6,7,7),nr=4),
widths=c(10,35,45,15),
heights=c(30,30,15,15))
couleurs <- rainbow(75)[1:50]#(50)
ticks <- pretty(coeff)
par(mar=c(1,1,3,1))
plot(aic,k:1-.5,type='o',pch=21,bg='blue',cex=2,axes=F,lty=2,xpd=NA)
points(aic[choix],k-choix+.5,pch=21,cex=4,bg=2,xpd=NA)
title('aic',line=2)
par(mar=c(3,0,0,0))
plot(0,axes=F,xlab='',ylab='',xlim=range(ticks),ylim=c(.1,1))
rect(xleft = min(ticks) + (0:49)/50*(max(ticks)-min(ticks)),
xright = min(ticks) + (1:50)/50*(max(ticks)-min(ticks)),
ytop = rep(1,50),
ybottom= rep(0,50),col=couleurs,border=NA)
axis(1,ticks)
rect(xleft=min(ticks),xright=max(ticks),ytop=1,ybottom=0)
text(mean(coeff,na.rm=T),.5,'coefficients',cex=2,font=2)
par(mar=c(1,1,3,1))
image(1:n,1:k,t(coeff[k:1,]),axes=F,col=couleurs,zlim=range(ticks))
for(i in 1:n) for(j in 1:k) if(!is.na(coeff[j,i])) {
if(pval[j,i]<.01) symb = 'green'
else if( (pval[j,i]<.05) & (pval[j,i]>=.01)) symb = 'orange'
else if( (pval[j,i]<.1) & (pval[j,i]>=.05)) symb = 'red'
else symb = 'black'
polygon(c(i+.5 ,i+.2 ,i+.5 ,i+.5),
c(k-j+0.5,k-j+0.5,k-j+0.8,k-j+0.5),
col=symb)
if(j==choix) {
rect(xleft=i-.5,
xright=i+.5,
ybottom=k-j+1.5,
ytop=k-j+.5,
lwd=4)
text(i,
k-j+1,
round(coeff[j,i],2),
cex=1.2,
font=2)
}
else{
rect(xleft=i-.5,xright=i+.5,ybottom=k-j+1.5,ytop=k-j+.5)
text(i,k-j+1,round(coeff[j,i],2),cex=1.2,font=1)
}
}
axis(3,1:n,noms)
par(mar=c(0.5,0,0,0.5))
plot(0,axes=F,xlab='',ylab='',type='n',xlim=c(0,8),ylim=c(-.2,.8))
cols <- c('green','orange','red','black')
niv <- c('0','0.01','0.05','0.1')
for(i in 0:3){
polygon(c(1+2*i ,1+2*i ,1+2*i-.5 ,1+2*i),
c(.4 ,.7 , .4 , .4),
col=cols[i+1])
text(2*i,0.5,niv[i+1],cex=1.5)
}
text(8,.5,1,cex=1.5)
text(4,0,'p-value',cex=2)
box()
residus <- arimaSelect.out[[3]][[choix]]$res
par(mar=c(1,2,4,1))
acf(residus,main='')
title('acf',line=.5)
par(mar=c(1,2,4,1))
pacf(residus,main='')
title('pacf',line=.5)
par(mar=c(2,2,4,1))
qqnorm(residus,main='')
title('qq-norm',line=.5)
qqline(residus)
residus
}
if (par2 == 0) x <- log(x)
if (par2 != 0) x <- x^par2
(selection <- arimaSelect(x, order=c(par6,par3,par7), seasonal=list(order=c(par8,par4,par9), period=par5)))
bitmap(file='test1.png')
resid <- arimaSelectplot(selection)
dev.off()
resid
bitmap(file='test2.png')
acf(resid,length(resid)/2, main='Residual Autocorrelation Function')
dev.off()
bitmap(file='test3.png')
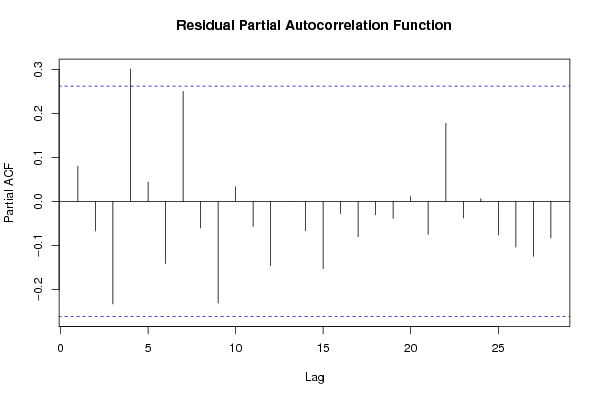
pacf(resid,length(resid)/2, main='Residual Partial Autocorrelation Function')
dev.off()
bitmap(file='test4.png')
cpgram(resid, main='Residual Cumulative Periodogram')
dev.off()
bitmap(file='test5.png')
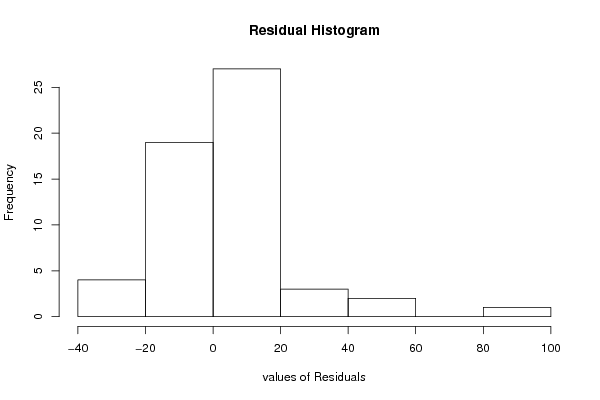
hist(resid, main='Residual Histogram', xlab='values of Residuals')
dev.off()
bitmap(file='test6.png')
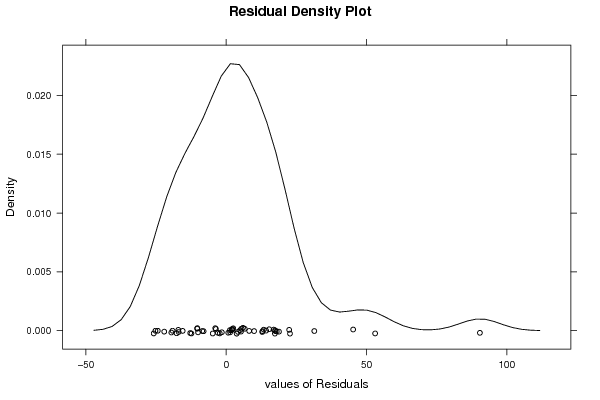
densityplot(~resid,col='black',main='Residual Density Plot', xlab='values of Residuals')
dev.off()
bitmap(file='test7.png')
qqnorm(resid, main='Residual Normal Q-Q Plot')
qqline(resid)
dev.off()
ncols <- length(selection[[1]][1,])
nrows <- length(selection[[2]][,1])-1
load(file='createtable')
a<-table.start()
a<-table.row.start(a)
a<-table.element(a,'ARIMA Parameter Estimation and Backward Selection', ncols+1,TRUE)
a<-table.row.end(a)
a<-table.row.start(a)
a<-table.element(a,'Iteration', header=TRUE)
for (i in 1:ncols) {
a<-table.element(a,names(selection[[3]][[1]]$coef)[i],header=TRUE)
}
a<-table.row.end(a)
for (j in 1:nrows) {
a<-table.row.start(a)
mydum <- 'Estimates ('
mydum <- paste(mydum,j)
mydum <- paste(mydum,')')
a<-table.element(a,mydum, header=TRUE)
for (i in 1:ncols) {
a<-table.element(a,round(selection[[1]][j,i],4))
}
a<-table.row.end(a)
a<-table.row.start(a)
a<-table.element(a,'(p-val)', header=TRUE)
for (i in 1:ncols) {
mydum <- '('
mydum <- paste(mydum,round(selection[[2]][j,i],4),sep='')
mydum <- paste(mydum,')')
a<-table.element(a,mydum)
}
a<-table.row.end(a)
}
a<-table.end(a)
table.save(a,file='mytable.tab')
a<-table.start()
a<-table.row.start(a)
a<-table.element(a,'Estimated ARIMA Residuals', 1,TRUE)
a<-table.row.end(a)
a<-table.row.start(a)
a<-table.element(a,'Value', 1,TRUE)
a<-table.row.end(a)
for (i in (par4*par5+par3):length(resid)) {
a<-table.row.start(a)
a<-table.element(a,resid[i])
a<-table.row.end(a)
}
a<-table.end(a)
table.save(a,file='mytable1.tab')