Free Statistics

of Irreproducible Research!

Author's title

Author*The author of this computation has been verified*
R Software Modulerwasp_autocorrelation.wasp
Title produced by software(Partial) Autocorrelation Function
Date of computationSun, 18 Dec 2016 15:23:36 +0100
Cite this page as followsStatistical Computations at FreeStatistics.org, Office for Research Development and Education, URL https://freestatistics.org/blog/index.php?v=date/2016/Dec/18/t1482071060uehhw7xs07qh9am.htm/, Retrieved Fri, 01 Nov 2024 03:39:09 +0000
Statistical Computations at FreeStatistics.org, Office for Research Development and Education, URL https://freestatistics.org/blog/index.php?pk=301105, Retrieved Fri, 01 Nov 2024 03:39:09 +0000
QR Codes:

Original text written by user:
IsPrivate?No (this computation is public)
User-defined keywords
Estimated Impact78
Family? (F = Feedback message, R = changed R code, M = changed R Module, P = changed Parameters, D = changed Data)
-       [(Partial) Autocorrelation Function] [(partial) autocor...] [2016-12-18 14:23:36] [cedc5386ad7644fa02c81dc221bdf6b7] [Current]
Feedback Forum

Post a new message
Dataseries X:
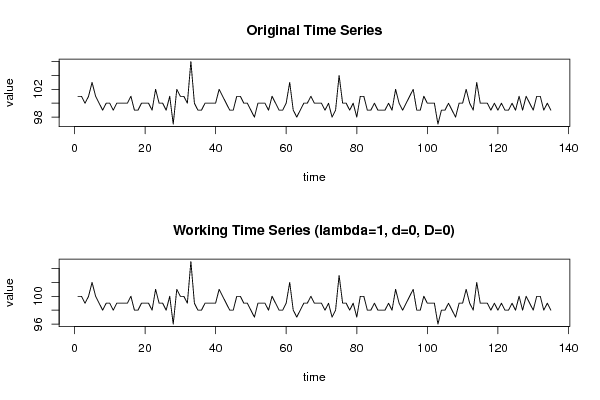
101
101
100
101
103
101
100
99
100
100
99
100
100
100
100
101
99
99
100
100
100
99
102
100
100
99
101
97
102
101
101
100
106
100
99
99
100
100
100
100
102
101
100
99
99
101
101
100
100
99
98
100
100
100
99
101
100
99
99
100
103
99
98
99
100
100
101
100
100
100
99
100
98
99
104
100
100
99
100
98
101
101
99
99
100
99
99
99
100
99
102
100
99
100
101
102
99
99
101
100
100
100
97
99
99
100
99
98
100
100
102
100
99
103
100
100
100
99
100
99
100
99
99
100
99
101
99
101
100
99
101
101
99
100
99


Summary of computational transaction
Raw Input view raw input (R code)
Raw Outputview raw output of R engine
Computing time1 seconds
R ServerBig Analytics Cloud Computing Center

\begin{tabular}{lllllllll}
\hline
Summary of computational transaction \tabularnewline
Raw Input view raw input (R code)  \tabularnewline
Raw Outputview raw output of R engine  \tabularnewline
Computing time1 seconds \tabularnewline
R ServerBig Analytics Cloud Computing Center \tabularnewline
\hline
\end{tabular}
%Source: https://freestatistics.org/blog/index.php?pk=301105&T=0

[TABLE]
[ROW]
Summary of computational transaction[/C][/ROW] [ROW]Raw Input[/C] view raw input (R code) [/C][/ROW] [ROW]Raw Output[/C]view raw output of R engine [/C][/ROW] [ROW]Computing time[/C]1 seconds[/C][/ROW] [ROW]R Server[/C]Big Analytics Cloud Computing Center[/C][/ROW] [/TABLE] Source: https://freestatistics.org/blog/index.php?pk=301105&T=0

Globally Unique Identifier (entire table): ba.freestatistics.org/blog/index.php?pk=301105&T=0

As an alternative you can also use a QR Code:  

The GUIDs for individual cells are displayed in the table below:

Summary of computational transaction
Raw Input view raw input (R code)
Raw Outputview raw output of R engine
Computing time1 seconds
R ServerBig Analytics Cloud Computing Center


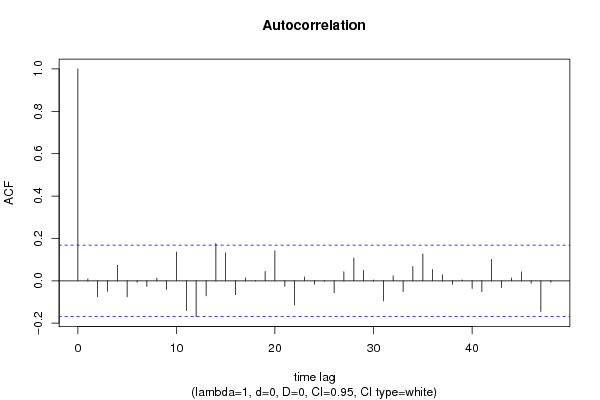
Autocorrelation Function
Time lag kACF(k)T-STATP-value
10.0089410.10390.458706
2-0.075068-0.87220.19232
3-0.050239-0.58370.280188
40.0726540.84420.200037
5-0.076002-0.88310.189387
6-0.00698-0.08110.467741
7-0.026709-0.31030.378393
80.0127290.14790.441322
9-0.041332-0.48020.315919
100.1359811.580.058229
11-0.139775-1.6240.05335
12-0.169365-1.96780.025568
13-0.070577-0.820.206821
140.1761292.04640.021327
150.1317471.53080.064085
16-0.065484-0.76090.224034
170.0135810.15780.437426
18-0.000852-0.00990.496057
190.0435160.50560.306975
200.1421221.65130.0505
21-0.025526-0.29660.383622
22-0.114648-1.33210.092537
230.0182890.21250.416021
24-0.016232-0.18860.425343
25-0.001813-0.02110.491614
26-0.055873-0.64920.258659
270.0425490.49440.310921
280.1075531.24970.106793
290.0481970.560.288205
300.0036320.04220.483201
31-0.094987-1.10360.135855
320.0235240.27330.392513
33-0.05099-0.59250.277269
340.0673380.78240.217677
350.1266811.47190.071688
360.0528970.61460.269922
370.0280550.3260.372476
38-0.016145-0.18760.425743
390.0037540.04360.482638
40-0.036063-0.4190.337935
41-0.05141-0.59730.275646
420.101251.17640.120749
43-0.031701-0.36830.356603
440.0128510.14930.440765
450.0422450.49080.312168
46-0.011998-0.13940.444667
47-0.145314-1.68840.046822
48-0.007081-0.08230.467274

\begin{tabular}{lllllllll}
\hline
Autocorrelation Function \tabularnewline
Time lag k & ACF(k) & T-STAT & P-value \tabularnewline
1 & 0.008941 & 0.1039 & 0.458706 \tabularnewline
2 & -0.075068 & -0.8722 & 0.19232 \tabularnewline
3 & -0.050239 & -0.5837 & 0.280188 \tabularnewline
4 & 0.072654 & 0.8442 & 0.200037 \tabularnewline
5 & -0.076002 & -0.8831 & 0.189387 \tabularnewline
6 & -0.00698 & -0.0811 & 0.467741 \tabularnewline
7 & -0.026709 & -0.3103 & 0.378393 \tabularnewline
8 & 0.012729 & 0.1479 & 0.441322 \tabularnewline
9 & -0.041332 & -0.4802 & 0.315919 \tabularnewline
10 & 0.135981 & 1.58 & 0.058229 \tabularnewline
11 & -0.139775 & -1.624 & 0.05335 \tabularnewline
12 & -0.169365 & -1.9678 & 0.025568 \tabularnewline
13 & -0.070577 & -0.82 & 0.206821 \tabularnewline
14 & 0.176129 & 2.0464 & 0.021327 \tabularnewline
15 & 0.131747 & 1.5308 & 0.064085 \tabularnewline
16 & -0.065484 & -0.7609 & 0.224034 \tabularnewline
17 & 0.013581 & 0.1578 & 0.437426 \tabularnewline
18 & -0.000852 & -0.0099 & 0.496057 \tabularnewline
19 & 0.043516 & 0.5056 & 0.306975 \tabularnewline
20 & 0.142122 & 1.6513 & 0.0505 \tabularnewline
21 & -0.025526 & -0.2966 & 0.383622 \tabularnewline
22 & -0.114648 & -1.3321 & 0.092537 \tabularnewline
23 & 0.018289 & 0.2125 & 0.416021 \tabularnewline
24 & -0.016232 & -0.1886 & 0.425343 \tabularnewline
25 & -0.001813 & -0.0211 & 0.491614 \tabularnewline
26 & -0.055873 & -0.6492 & 0.258659 \tabularnewline
27 & 0.042549 & 0.4944 & 0.310921 \tabularnewline
28 & 0.107553 & 1.2497 & 0.106793 \tabularnewline
29 & 0.048197 & 0.56 & 0.288205 \tabularnewline
30 & 0.003632 & 0.0422 & 0.483201 \tabularnewline
31 & -0.094987 & -1.1036 & 0.135855 \tabularnewline
32 & 0.023524 & 0.2733 & 0.392513 \tabularnewline
33 & -0.05099 & -0.5925 & 0.277269 \tabularnewline
34 & 0.067338 & 0.7824 & 0.217677 \tabularnewline
35 & 0.126681 & 1.4719 & 0.071688 \tabularnewline
36 & 0.052897 & 0.6146 & 0.269922 \tabularnewline
37 & 0.028055 & 0.326 & 0.372476 \tabularnewline
38 & -0.016145 & -0.1876 & 0.425743 \tabularnewline
39 & 0.003754 & 0.0436 & 0.482638 \tabularnewline
40 & -0.036063 & -0.419 & 0.337935 \tabularnewline
41 & -0.05141 & -0.5973 & 0.275646 \tabularnewline
42 & 0.10125 & 1.1764 & 0.120749 \tabularnewline
43 & -0.031701 & -0.3683 & 0.356603 \tabularnewline
44 & 0.012851 & 0.1493 & 0.440765 \tabularnewline
45 & 0.042245 & 0.4908 & 0.312168 \tabularnewline
46 & -0.011998 & -0.1394 & 0.444667 \tabularnewline
47 & -0.145314 & -1.6884 & 0.046822 \tabularnewline
48 & -0.007081 & -0.0823 & 0.467274 \tabularnewline
\hline
\end{tabular}
%Source: https://freestatistics.org/blog/index.php?pk=301105&T=1

[TABLE]
[ROW][C]Autocorrelation Function[/C][/ROW]
[ROW][C]Time lag k[/C][C]ACF(k)[/C][C]T-STAT[/C][C]P-value[/C][/ROW]
[ROW][C]1[/C][C]0.008941[/C][C]0.1039[/C][C]0.458706[/C][/ROW]
[ROW][C]2[/C][C]-0.075068[/C][C]-0.8722[/C][C]0.19232[/C][/ROW]
[ROW][C]3[/C][C]-0.050239[/C][C]-0.5837[/C][C]0.280188[/C][/ROW]
[ROW][C]4[/C][C]0.072654[/C][C]0.8442[/C][C]0.200037[/C][/ROW]
[ROW][C]5[/C][C]-0.076002[/C][C]-0.8831[/C][C]0.189387[/C][/ROW]
[ROW][C]6[/C][C]-0.00698[/C][C]-0.0811[/C][C]0.467741[/C][/ROW]
[ROW][C]7[/C][C]-0.026709[/C][C]-0.3103[/C][C]0.378393[/C][/ROW]
[ROW][C]8[/C][C]0.012729[/C][C]0.1479[/C][C]0.441322[/C][/ROW]
[ROW][C]9[/C][C]-0.041332[/C][C]-0.4802[/C][C]0.315919[/C][/ROW]
[ROW][C]10[/C][C]0.135981[/C][C]1.58[/C][C]0.058229[/C][/ROW]
[ROW][C]11[/C][C]-0.139775[/C][C]-1.624[/C][C]0.05335[/C][/ROW]
[ROW][C]12[/C][C]-0.169365[/C][C]-1.9678[/C][C]0.025568[/C][/ROW]
[ROW][C]13[/C][C]-0.070577[/C][C]-0.82[/C][C]0.206821[/C][/ROW]
[ROW][C]14[/C][C]0.176129[/C][C]2.0464[/C][C]0.021327[/C][/ROW]
[ROW][C]15[/C][C]0.131747[/C][C]1.5308[/C][C]0.064085[/C][/ROW]
[ROW][C]16[/C][C]-0.065484[/C][C]-0.7609[/C][C]0.224034[/C][/ROW]
[ROW][C]17[/C][C]0.013581[/C][C]0.1578[/C][C]0.437426[/C][/ROW]
[ROW][C]18[/C][C]-0.000852[/C][C]-0.0099[/C][C]0.496057[/C][/ROW]
[ROW][C]19[/C][C]0.043516[/C][C]0.5056[/C][C]0.306975[/C][/ROW]
[ROW][C]20[/C][C]0.142122[/C][C]1.6513[/C][C]0.0505[/C][/ROW]
[ROW][C]21[/C][C]-0.025526[/C][C]-0.2966[/C][C]0.383622[/C][/ROW]
[ROW][C]22[/C][C]-0.114648[/C][C]-1.3321[/C][C]0.092537[/C][/ROW]
[ROW][C]23[/C][C]0.018289[/C][C]0.2125[/C][C]0.416021[/C][/ROW]
[ROW][C]24[/C][C]-0.016232[/C][C]-0.1886[/C][C]0.425343[/C][/ROW]
[ROW][C]25[/C][C]-0.001813[/C][C]-0.0211[/C][C]0.491614[/C][/ROW]
[ROW][C]26[/C][C]-0.055873[/C][C]-0.6492[/C][C]0.258659[/C][/ROW]
[ROW][C]27[/C][C]0.042549[/C][C]0.4944[/C][C]0.310921[/C][/ROW]
[ROW][C]28[/C][C]0.107553[/C][C]1.2497[/C][C]0.106793[/C][/ROW]
[ROW][C]29[/C][C]0.048197[/C][C]0.56[/C][C]0.288205[/C][/ROW]
[ROW][C]30[/C][C]0.003632[/C][C]0.0422[/C][C]0.483201[/C][/ROW]
[ROW][C]31[/C][C]-0.094987[/C][C]-1.1036[/C][C]0.135855[/C][/ROW]
[ROW][C]32[/C][C]0.023524[/C][C]0.2733[/C][C]0.392513[/C][/ROW]
[ROW][C]33[/C][C]-0.05099[/C][C]-0.5925[/C][C]0.277269[/C][/ROW]
[ROW][C]34[/C][C]0.067338[/C][C]0.7824[/C][C]0.217677[/C][/ROW]
[ROW][C]35[/C][C]0.126681[/C][C]1.4719[/C][C]0.071688[/C][/ROW]
[ROW][C]36[/C][C]0.052897[/C][C]0.6146[/C][C]0.269922[/C][/ROW]
[ROW][C]37[/C][C]0.028055[/C][C]0.326[/C][C]0.372476[/C][/ROW]
[ROW][C]38[/C][C]-0.016145[/C][C]-0.1876[/C][C]0.425743[/C][/ROW]
[ROW][C]39[/C][C]0.003754[/C][C]0.0436[/C][C]0.482638[/C][/ROW]
[ROW][C]40[/C][C]-0.036063[/C][C]-0.419[/C][C]0.337935[/C][/ROW]
[ROW][C]41[/C][C]-0.05141[/C][C]-0.5973[/C][C]0.275646[/C][/ROW]
[ROW][C]42[/C][C]0.10125[/C][C]1.1764[/C][C]0.120749[/C][/ROW]
[ROW][C]43[/C][C]-0.031701[/C][C]-0.3683[/C][C]0.356603[/C][/ROW]
[ROW][C]44[/C][C]0.012851[/C][C]0.1493[/C][C]0.440765[/C][/ROW]
[ROW][C]45[/C][C]0.042245[/C][C]0.4908[/C][C]0.312168[/C][/ROW]
[ROW][C]46[/C][C]-0.011998[/C][C]-0.1394[/C][C]0.444667[/C][/ROW]
[ROW][C]47[/C][C]-0.145314[/C][C]-1.6884[/C][C]0.046822[/C][/ROW]
[ROW][C]48[/C][C]-0.007081[/C][C]-0.0823[/C][C]0.467274[/C][/ROW]
[/TABLE]
Source: https://freestatistics.org/blog/index.php?pk=301105&T=1

Globally Unique Identifier (entire table): ba.freestatistics.org/blog/index.php?pk=301105&T=1

As an alternative you can also use a QR Code:  

The GUIDs for individual cells are displayed in the table below:

Autocorrelation Function
Time lag kACF(k)T-STATP-value
10.0089410.10390.458706
2-0.075068-0.87220.19232
3-0.050239-0.58370.280188
40.0726540.84420.200037
5-0.076002-0.88310.189387
6-0.00698-0.08110.467741
7-0.026709-0.31030.378393
80.0127290.14790.441322
9-0.041332-0.48020.315919
100.1359811.580.058229
11-0.139775-1.6240.05335
12-0.169365-1.96780.025568
13-0.070577-0.820.206821
140.1761292.04640.021327
150.1317471.53080.064085
16-0.065484-0.76090.224034
170.0135810.15780.437426
18-0.000852-0.00990.496057
190.0435160.50560.306975
200.1421221.65130.0505
21-0.025526-0.29660.383622
22-0.114648-1.33210.092537
230.0182890.21250.416021
24-0.016232-0.18860.425343
25-0.001813-0.02110.491614
26-0.055873-0.64920.258659
270.0425490.49440.310921
280.1075531.24970.106793
290.0481970.560.288205
300.0036320.04220.483201
31-0.094987-1.10360.135855
320.0235240.27330.392513
33-0.05099-0.59250.277269
340.0673380.78240.217677
350.1266811.47190.071688
360.0528970.61460.269922
370.0280550.3260.372476
38-0.016145-0.18760.425743
390.0037540.04360.482638
40-0.036063-0.4190.337935
41-0.05141-0.59730.275646
420.101251.17640.120749
43-0.031701-0.36830.356603
440.0128510.14930.440765
450.0422450.49080.312168
46-0.011998-0.13940.444667
47-0.145314-1.68840.046822
48-0.007081-0.08230.467274


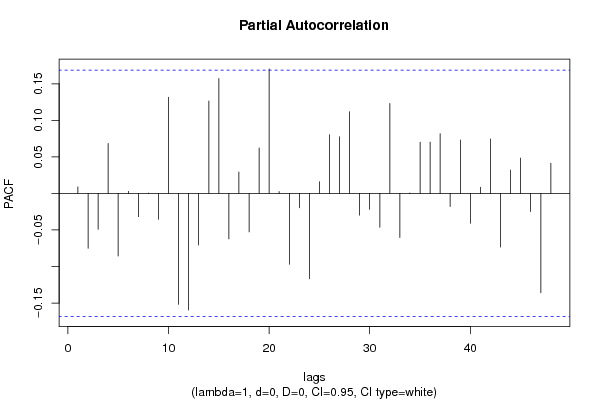
Partial Autocorrelation Function
Time lag kPACF(k)T-STATP-value
10.0089410.10390.458706
2-0.075154-0.87320.192049
3-0.049127-0.57080.28454
40.068340.7940.214284
5-0.085593-0.99450.16088
60.0027550.0320.487253
7-0.031812-0.36960.356121
8-0.000239-0.00280.498894
9-0.035384-0.41110.340815
100.1315671.52870.064343
11-0.151851-1.76430.039968
12-0.159625-1.85470.032912
13-0.070741-0.82190.206282
140.1263931.46860.072141
150.1570831.82510.035095
16-0.062251-0.72330.235377
170.0292010.33930.36746
18-0.05274-0.61280.270524
190.0620820.72130.235978
200.1702851.97850.024952
210.0024020.02790.488889
22-0.096923-1.12610.131052
23-0.019643-0.22820.409907
24-0.116891-1.35810.088341
250.0158240.18390.427202
260.0803110.93310.17621
270.0776130.90180.18439
280.1118091.29910.098062
29-0.029759-0.34580.365026
30-0.021755-0.25280.400416
31-0.04625-0.53740.295946
320.1230381.42960.077575
33-0.060317-0.70080.24231
340.0005720.00660.497354
350.0699130.81230.209021
360.0701230.81480.208325
370.0816790.9490.172153
38-0.017906-0.20810.417751
390.072940.84750.199112
40-0.040952-0.47580.317486
410.0084610.09830.460915
420.0744940.86550.194137
43-0.073426-0.85310.197549
440.0318230.36980.356072
450.0483150.56140.287739
46-0.024745-0.28750.38708
47-0.136056-1.58080.058129
480.0411550.47820.316646

\begin{tabular}{lllllllll}
\hline
Partial Autocorrelation Function \tabularnewline
Time lag k & PACF(k) & T-STAT & P-value \tabularnewline
1 & 0.008941 & 0.1039 & 0.458706 \tabularnewline
2 & -0.075154 & -0.8732 & 0.192049 \tabularnewline
3 & -0.049127 & -0.5708 & 0.28454 \tabularnewline
4 & 0.06834 & 0.794 & 0.214284 \tabularnewline
5 & -0.085593 & -0.9945 & 0.16088 \tabularnewline
6 & 0.002755 & 0.032 & 0.487253 \tabularnewline
7 & -0.031812 & -0.3696 & 0.356121 \tabularnewline
8 & -0.000239 & -0.0028 & 0.498894 \tabularnewline
9 & -0.035384 & -0.4111 & 0.340815 \tabularnewline
10 & 0.131567 & 1.5287 & 0.064343 \tabularnewline
11 & -0.151851 & -1.7643 & 0.039968 \tabularnewline
12 & -0.159625 & -1.8547 & 0.032912 \tabularnewline
13 & -0.070741 & -0.8219 & 0.206282 \tabularnewline
14 & 0.126393 & 1.4686 & 0.072141 \tabularnewline
15 & 0.157083 & 1.8251 & 0.035095 \tabularnewline
16 & -0.062251 & -0.7233 & 0.235377 \tabularnewline
17 & 0.029201 & 0.3393 & 0.36746 \tabularnewline
18 & -0.05274 & -0.6128 & 0.270524 \tabularnewline
19 & 0.062082 & 0.7213 & 0.235978 \tabularnewline
20 & 0.170285 & 1.9785 & 0.024952 \tabularnewline
21 & 0.002402 & 0.0279 & 0.488889 \tabularnewline
22 & -0.096923 & -1.1261 & 0.131052 \tabularnewline
23 & -0.019643 & -0.2282 & 0.409907 \tabularnewline
24 & -0.116891 & -1.3581 & 0.088341 \tabularnewline
25 & 0.015824 & 0.1839 & 0.427202 \tabularnewline
26 & 0.080311 & 0.9331 & 0.17621 \tabularnewline
27 & 0.077613 & 0.9018 & 0.18439 \tabularnewline
28 & 0.111809 & 1.2991 & 0.098062 \tabularnewline
29 & -0.029759 & -0.3458 & 0.365026 \tabularnewline
30 & -0.021755 & -0.2528 & 0.400416 \tabularnewline
31 & -0.04625 & -0.5374 & 0.295946 \tabularnewline
32 & 0.123038 & 1.4296 & 0.077575 \tabularnewline
33 & -0.060317 & -0.7008 & 0.24231 \tabularnewline
34 & 0.000572 & 0.0066 & 0.497354 \tabularnewline
35 & 0.069913 & 0.8123 & 0.209021 \tabularnewline
36 & 0.070123 & 0.8148 & 0.208325 \tabularnewline
37 & 0.081679 & 0.949 & 0.172153 \tabularnewline
38 & -0.017906 & -0.2081 & 0.417751 \tabularnewline
39 & 0.07294 & 0.8475 & 0.199112 \tabularnewline
40 & -0.040952 & -0.4758 & 0.317486 \tabularnewline
41 & 0.008461 & 0.0983 & 0.460915 \tabularnewline
42 & 0.074494 & 0.8655 & 0.194137 \tabularnewline
43 & -0.073426 & -0.8531 & 0.197549 \tabularnewline
44 & 0.031823 & 0.3698 & 0.356072 \tabularnewline
45 & 0.048315 & 0.5614 & 0.287739 \tabularnewline
46 & -0.024745 & -0.2875 & 0.38708 \tabularnewline
47 & -0.136056 & -1.5808 & 0.058129 \tabularnewline
48 & 0.041155 & 0.4782 & 0.316646 \tabularnewline
\hline
\end{tabular}
%Source: https://freestatistics.org/blog/index.php?pk=301105&T=2

[TABLE]
[ROW][C]Partial Autocorrelation Function[/C][/ROW]
[ROW][C]Time lag k[/C][C]PACF(k)[/C][C]T-STAT[/C][C]P-value[/C][/ROW]
[ROW][C]1[/C][C]0.008941[/C][C]0.1039[/C][C]0.458706[/C][/ROW]
[ROW][C]2[/C][C]-0.075154[/C][C]-0.8732[/C][C]0.192049[/C][/ROW]
[ROW][C]3[/C][C]-0.049127[/C][C]-0.5708[/C][C]0.28454[/C][/ROW]
[ROW][C]4[/C][C]0.06834[/C][C]0.794[/C][C]0.214284[/C][/ROW]
[ROW][C]5[/C][C]-0.085593[/C][C]-0.9945[/C][C]0.16088[/C][/ROW]
[ROW][C]6[/C][C]0.002755[/C][C]0.032[/C][C]0.487253[/C][/ROW]
[ROW][C]7[/C][C]-0.031812[/C][C]-0.3696[/C][C]0.356121[/C][/ROW]
[ROW][C]8[/C][C]-0.000239[/C][C]-0.0028[/C][C]0.498894[/C][/ROW]
[ROW][C]9[/C][C]-0.035384[/C][C]-0.4111[/C][C]0.340815[/C][/ROW]
[ROW][C]10[/C][C]0.131567[/C][C]1.5287[/C][C]0.064343[/C][/ROW]
[ROW][C]11[/C][C]-0.151851[/C][C]-1.7643[/C][C]0.039968[/C][/ROW]
[ROW][C]12[/C][C]-0.159625[/C][C]-1.8547[/C][C]0.032912[/C][/ROW]
[ROW][C]13[/C][C]-0.070741[/C][C]-0.8219[/C][C]0.206282[/C][/ROW]
[ROW][C]14[/C][C]0.126393[/C][C]1.4686[/C][C]0.072141[/C][/ROW]
[ROW][C]15[/C][C]0.157083[/C][C]1.8251[/C][C]0.035095[/C][/ROW]
[ROW][C]16[/C][C]-0.062251[/C][C]-0.7233[/C][C]0.235377[/C][/ROW]
[ROW][C]17[/C][C]0.029201[/C][C]0.3393[/C][C]0.36746[/C][/ROW]
[ROW][C]18[/C][C]-0.05274[/C][C]-0.6128[/C][C]0.270524[/C][/ROW]
[ROW][C]19[/C][C]0.062082[/C][C]0.7213[/C][C]0.235978[/C][/ROW]
[ROW][C]20[/C][C]0.170285[/C][C]1.9785[/C][C]0.024952[/C][/ROW]
[ROW][C]21[/C][C]0.002402[/C][C]0.0279[/C][C]0.488889[/C][/ROW]
[ROW][C]22[/C][C]-0.096923[/C][C]-1.1261[/C][C]0.131052[/C][/ROW]
[ROW][C]23[/C][C]-0.019643[/C][C]-0.2282[/C][C]0.409907[/C][/ROW]
[ROW][C]24[/C][C]-0.116891[/C][C]-1.3581[/C][C]0.088341[/C][/ROW]
[ROW][C]25[/C][C]0.015824[/C][C]0.1839[/C][C]0.427202[/C][/ROW]
[ROW][C]26[/C][C]0.080311[/C][C]0.9331[/C][C]0.17621[/C][/ROW]
[ROW][C]27[/C][C]0.077613[/C][C]0.9018[/C][C]0.18439[/C][/ROW]
[ROW][C]28[/C][C]0.111809[/C][C]1.2991[/C][C]0.098062[/C][/ROW]
[ROW][C]29[/C][C]-0.029759[/C][C]-0.3458[/C][C]0.365026[/C][/ROW]
[ROW][C]30[/C][C]-0.021755[/C][C]-0.2528[/C][C]0.400416[/C][/ROW]
[ROW][C]31[/C][C]-0.04625[/C][C]-0.5374[/C][C]0.295946[/C][/ROW]
[ROW][C]32[/C][C]0.123038[/C][C]1.4296[/C][C]0.077575[/C][/ROW]
[ROW][C]33[/C][C]-0.060317[/C][C]-0.7008[/C][C]0.24231[/C][/ROW]
[ROW][C]34[/C][C]0.000572[/C][C]0.0066[/C][C]0.497354[/C][/ROW]
[ROW][C]35[/C][C]0.069913[/C][C]0.8123[/C][C]0.209021[/C][/ROW]
[ROW][C]36[/C][C]0.070123[/C][C]0.8148[/C][C]0.208325[/C][/ROW]
[ROW][C]37[/C][C]0.081679[/C][C]0.949[/C][C]0.172153[/C][/ROW]
[ROW][C]38[/C][C]-0.017906[/C][C]-0.2081[/C][C]0.417751[/C][/ROW]
[ROW][C]39[/C][C]0.07294[/C][C]0.8475[/C][C]0.199112[/C][/ROW]
[ROW][C]40[/C][C]-0.040952[/C][C]-0.4758[/C][C]0.317486[/C][/ROW]
[ROW][C]41[/C][C]0.008461[/C][C]0.0983[/C][C]0.460915[/C][/ROW]
[ROW][C]42[/C][C]0.074494[/C][C]0.8655[/C][C]0.194137[/C][/ROW]
[ROW][C]43[/C][C]-0.073426[/C][C]-0.8531[/C][C]0.197549[/C][/ROW]
[ROW][C]44[/C][C]0.031823[/C][C]0.3698[/C][C]0.356072[/C][/ROW]
[ROW][C]45[/C][C]0.048315[/C][C]0.5614[/C][C]0.287739[/C][/ROW]
[ROW][C]46[/C][C]-0.024745[/C][C]-0.2875[/C][C]0.38708[/C][/ROW]
[ROW][C]47[/C][C]-0.136056[/C][C]-1.5808[/C][C]0.058129[/C][/ROW]
[ROW][C]48[/C][C]0.041155[/C][C]0.4782[/C][C]0.316646[/C][/ROW]
[/TABLE]
Source: https://freestatistics.org/blog/index.php?pk=301105&T=2

Globally Unique Identifier (entire table): ba.freestatistics.org/blog/index.php?pk=301105&T=2

As an alternative you can also use a QR Code:  

The GUIDs for individual cells are displayed in the table below:

Partial Autocorrelation Function
Time lag kPACF(k)T-STATP-value
10.0089410.10390.458706
2-0.075154-0.87320.192049
3-0.049127-0.57080.28454
40.068340.7940.214284
5-0.085593-0.99450.16088
60.0027550.0320.487253
7-0.031812-0.36960.356121
8-0.000239-0.00280.498894
9-0.035384-0.41110.340815
100.1315671.52870.064343
11-0.151851-1.76430.039968
12-0.159625-1.85470.032912
13-0.070741-0.82190.206282
140.1263931.46860.072141
150.1570831.82510.035095
16-0.062251-0.72330.235377
170.0292010.33930.36746
18-0.05274-0.61280.270524
190.0620820.72130.235978
200.1702851.97850.024952
210.0024020.02790.488889
22-0.096923-1.12610.131052
23-0.019643-0.22820.409907
24-0.116891-1.35810.088341
250.0158240.18390.427202
260.0803110.93310.17621
270.0776130.90180.18439
280.1118091.29910.098062
29-0.029759-0.34580.365026
30-0.021755-0.25280.400416
31-0.04625-0.53740.295946
320.1230381.42960.077575
33-0.060317-0.70080.24231
340.0005720.00660.497354
350.0699130.81230.209021
360.0701230.81480.208325
370.0816790.9490.172153
38-0.017906-0.20810.417751
390.072940.84750.199112
40-0.040952-0.47580.317486
410.0084610.09830.460915
420.0744940.86550.194137
43-0.073426-0.85310.197549
440.0318230.36980.356072
450.0483150.56140.287739
46-0.024745-0.28750.38708
47-0.136056-1.58080.058129
480.0411550.47820.316646


Parameters (Session):
par1 = 48 ; par2 = 1 ; par3 = 0 ; par4 = 0 ; par5 = 12 ; par6 = White Noise ; par7 = 0.95 ;
Parameters (R input):
par1 = 48 ; par2 = 1 ; par3 = 0 ; par4 = 0 ; par5 = 12 ; par6 = White Noise ; par7 = 0.95 ; par8 = ;
R code (references can be found in the software module):
if (par1 == 'Default') {
par1 = 10*log10(length(x))
} else {
par1 <- as.numeric(par1)
}
par2 <- as.numeric(par2)
par3 <- as.numeric(par3)
par4 <- as.numeric(par4)
par5 <- as.numeric(par5)
if (par6 == 'White Noise') par6 <- 'white' else par6 <- 'ma'
par7 <- as.numeric(par7)
if (par8 != '') par8 <- as.numeric(par8)
x <- na.omit(x)
ox <- x
if (par8 == '') {
if (par2 == 0) {
x <- log(x)
} else {
x <- (x ^ par2 - 1) / par2
}
} else {
x <- log(x,base=par8)
}
if (par3 > 0) x <- diff(x,lag=1,difference=par3)
if (par4 > 0) x <- diff(x,lag=par5,difference=par4)
bitmap(file='picts.png')
op <- par(mfrow=c(2,1))
plot(ox,type='l',main='Original Time Series',xlab='time',ylab='value')
if (par8=='') {
mytitle <- paste('Working Time Series (lambda=',par2,', d=',par3,', D=',par4,')',sep='')
mysub <- paste('(lambda=',par2,', d=',par3,', D=',par4,', CI=', par7, ', CI type=',par6,')',sep='')
} else {
mytitle <- paste('Working Time Series (base=',par8,', d=',par3,', D=',par4,')',sep='')
mysub <- paste('(base=',par8,', d=',par3,', D=',par4,', CI=', par7, ', CI type=',par6,')',sep='')
}
plot(x,type='l', main=mytitle,xlab='time',ylab='value')
par(op)
dev.off()
bitmap(file='pic1.png')
racf <- acf(x, par1, main='Autocorrelation', xlab='time lag', ylab='ACF', ci.type=par6, ci=par7, sub=mysub)
dev.off()
bitmap(file='pic2.png')
rpacf <- pacf(x,par1,main='Partial Autocorrelation',xlab='lags',ylab='PACF',sub=mysub)
dev.off()
(myacf <- c(racf$acf))
(mypacf <- c(rpacf$acf))
lengthx <- length(x)
sqrtn <- sqrt(lengthx)
load(file='createtable')
a<-table.start()
a<-table.row.start(a)
a<-table.element(a,'Autocorrelation Function',4,TRUE)
a<-table.row.end(a)
a<-table.row.start(a)
a<-table.element(a,'Time lag k',header=TRUE)
a<-table.element(a,'ACF(k)',header=TRUE)
a<-table.element(a,'T-STAT',header=TRUE)
a<-table.element(a,'P-value',header=TRUE)
a<-table.row.end(a)
for (i in 2:(par1+1)) {
a<-table.row.start(a)
a<-table.element(a,i-1,header=TRUE)
a<-table.element(a,round(myacf[i],6))
mytstat <- myacf[i]*sqrtn
a<-table.element(a,round(mytstat,4))
a<-table.element(a,round(1-pt(abs(mytstat),lengthx),6))
a<-table.row.end(a)
}
a<-table.end(a)
table.save(a,file='mytable.tab')
a<-table.start()
a<-table.row.start(a)
a<-table.element(a,'Partial Autocorrelation Function',4,TRUE)
a<-table.row.end(a)
a<-table.row.start(a)
a<-table.element(a,'Time lag k',header=TRUE)
a<-table.element(a,'PACF(k)',header=TRUE)
a<-table.element(a,'T-STAT',header=TRUE)
a<-table.element(a,'P-value',header=TRUE)
a<-table.row.end(a)
for (i in 1:par1) {
a<-table.row.start(a)
a<-table.element(a,i,header=TRUE)
a<-table.element(a,round(mypacf[i],6))
mytstat <- mypacf[i]*sqrtn
a<-table.element(a,round(mytstat,4))
a<-table.element(a,round(1-pt(abs(mytstat),lengthx),6))
a<-table.row.end(a)
}
a<-table.end(a)
table.save(a,file='mytable1.tab')